Monitoring applications based on custom metrics is important for a resilient system. One of the mechanisms to generate custom metrics from applications is statsd – a NodeJs process to collect custom application performance metrics periodically. However, statsd doesn’t provide long-term storage, rich querying, visualization, or an alerting solution. Amazon Managed Service for Prometheus and Amazon Managed Grafana provide a managed service for long-term storage, querying, visualizing, and alerting solutions at scale for the gathered metrics.
This post describes how AWS partners and customers can view metrics from a running instance of statsd, on a Linux or Windows based Amazon Elastic Compute Cloud (Amazon EC2) instance, with Amazon Managed Service for Prometheus and Amazon Managed Grafana. This post describes both scenarios of Repeater and Relay as applied to extracting statistics from statsd. Viewing metrics from statsd with Amazon Managed Service for Prometheus and Amazon Managed Grafana can help customers move to monitoring solutions with native AWS services, while leveraging the combination of Prometheus and Grafana.
Solution overview
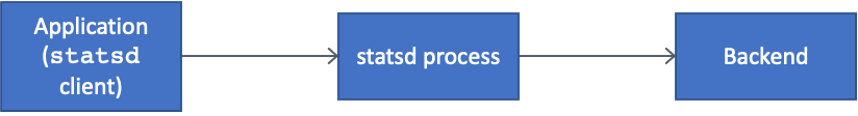
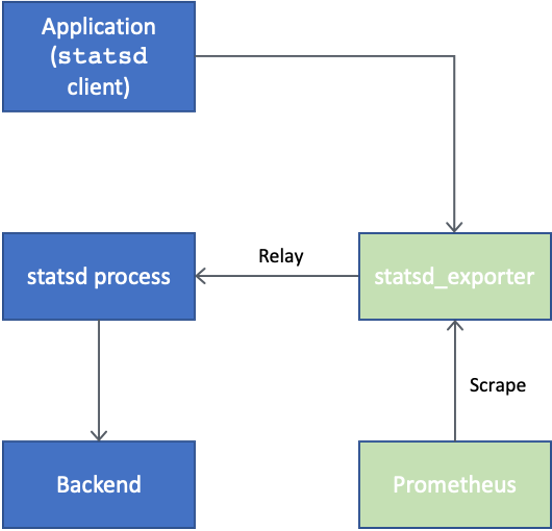
In the following figure, a typical deployment of an application performance monitoring solution with statsd is shown. In that deployment, an application is instrumented with statsd clients and writes its custom metrics to the statsd process configured to one or more back-ends.
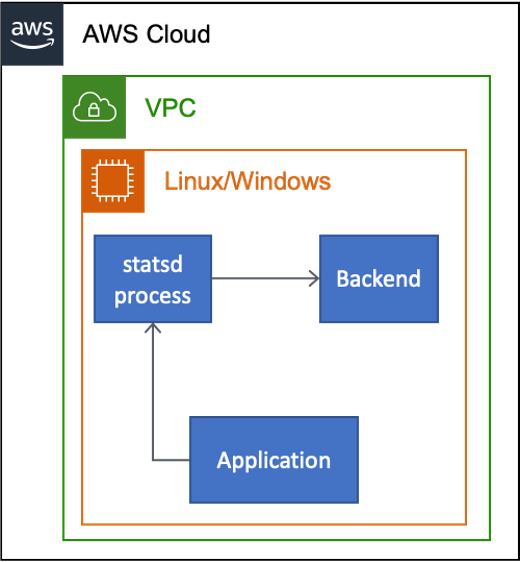
The following figure shows an illustrative deployment of an application monitoring solution with statsd, on Amazon EC2.
To integrate with Prometheus server, statsd_exporter – Prometheus official exporter for statsd – is used. There are two ways to utilize the exporter – Repeater and Relay. The Repeater use case may be used when the statsd process can be configured. The application need not be changed. The Relay use case may be used when the statsd process is unavailable for configuration. However, the application may have to be reconfigured to the statsd_exporter end-point.
Repeater
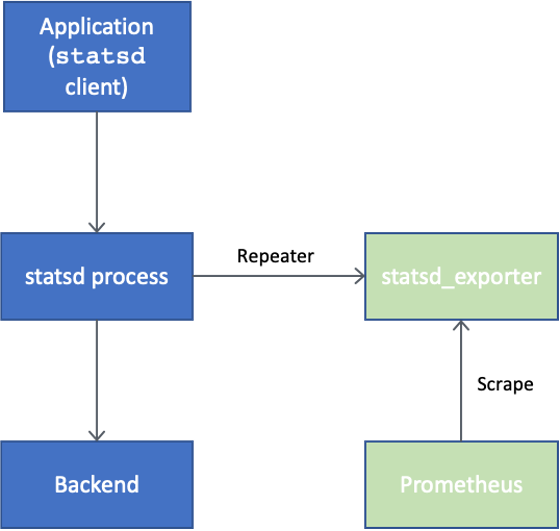
In the following figure, the Repeater use case is shown, where the repeater feature of statsd is used to “forward” the metrics to other statsd servers. However, for this solution, the metrics are forwarded to statsd_exporter. The statsd_exporter will also expose a metrics end-point that a Prometheus server can scrape. The application need not be changed.
The following figure shows an illustration of the Repeater use case with statsd and statsd_exporter using Amazon EC2, Amazon Managed Service for Prometheus, and Amazon Managed Grafana.
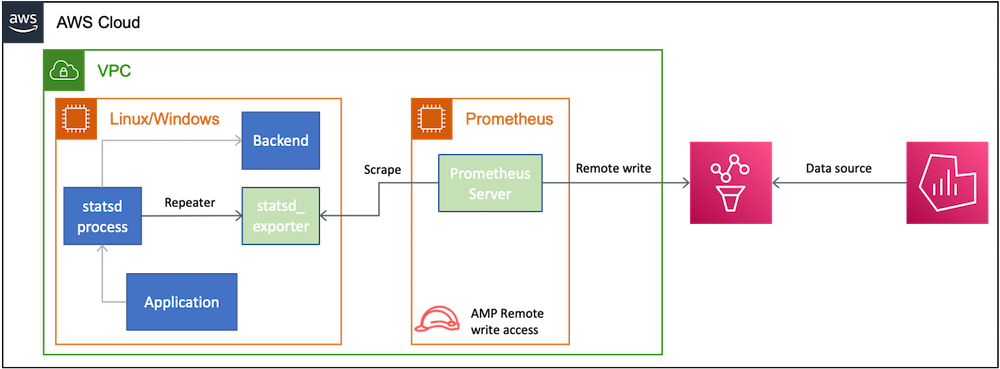
The statsd process is configured with a Repeater back-end to forward metrics from the statsd process to statsd_exporter that can be scraped by a Prometheus server. For this post, the Prometheus server will be deployed on the same Amazon EC2 instance where the application is running.
The Prometheus server will be configured with a YAML file to write remotely to an Amazon Managed Service for Prometheus workspace. Furthermore, the Amazon EC2 instance will be configured with an AWS Identity and Access Management (IAM) Role that has the AmazonPrometheusRemoteWriteAccess policy. A YAML file with Prometheus recording rules is uploaded to the Amazon Managed Service for Prometheus workspace to generate the average values of metrics.
The Amazon Managed Grafana workspace is configured to use the Amazon Managed Service for Prometheus workspace as the data source. The Amazon Managed Grafana workspace will have dashboards to display the metrics.
Relay
In the following figure, the Relay use case is shown, where statsd_exporter is configured to forward metrics to the statsd process. The statsd_exporter will also expose a metrics end-point that a Prometheus server can scrape. The application may have to be reconfigured to send the metrics to statsd_exporter instead of the statsd process.
The following figure shows an illustration of a Relay use case with statsd and statsd_exporter using Amazon EC2, Amazon Managed Service for Prometheus, and Amazon Managed Grafana.

The statsd_exporter is configured as a relay to the statsd process. The statsd_exporter can be scraped by a Prometheus server. For this post, the Prometheus server will be deployed on the same Amazon EC2 instance where the application is running.
The Prometheus server will be configured with a YAML file to write remotely to an Amazon Managed Service for Prometheus workspace. Furthermore, the Amazon EC2 instance will be configured with an IAM Role that has the AmazonPrometheusRemoteWriteAccess[DS1] policy. A YAML file with Prometheus recording rules is uploaded to the Amazon Managed Service for Prometheus workspace to generate the average values of metrics over a 5 minute duration.
The Amazon Managed Grafana workspace is configured to use the Amazon Managed Service for Prometheus workspace as the data source. The Amazon Managed Grafana workspace will have dashboards to display the metrics.
Walkthrough
The walkthrough of the solution is categorized as follows:
- General instructions with steps common to both Repeater and Relay use cases.
- Instructions for the Repeater use case.
- Instructions for the Relay use case.
Once the general instructions are done, either of the instructions for Repeater and Relay may be used.
Prerequisites
For this walkthrough, the following prerequisites should be met:
- An AWS account
- A running Linux based Amazon EC2 instance in a public subnet. This post uses Ubuntu as the operating system.
- Install hey to simulate HTTP requests on your workstation or the Amazon EC2 instance itself.
General instructions
The following instructions apply for both use cases of the Repeater and Relay.
- Install statsd
- Install statsd_exporter
- Configure mapping for statsd_exporter
- Create the Amazon Managed Service for Prometheus workspace.
- Install Prometheus server.
- Configure Prometheus server to write to Amazon Managed Service for Prometheus instance.
- Develop a NodeJs application instrumented with statsd client.
- Add Prometheus recording rules in Amazon Managed Service for Prometheus.
- Launch Amazon Managed Grafana instance.
- Import dashboard JSON to view metrics.
Install statsd
Installation of statsd is the same as any NodeJs application.
- Connect to your Linux instance using Session Manager.
- Run the following commands to install NodeJs, clone statsd, and install the required packages.
sudo apt-get update
curl -fsSL https://deb.nodesource.com/setup_16.x | sudo -E bash -
sudo apt-get install -y nodejs
git clone https://github.com/statsd/statsd
cd statsd
npm i
Install statsd_exporter
The following commands use the statsd_exporter binary for Linux amd64 system.
- Open a new terminal window.
- Connect to your Linux instance using Session Manager.
- Run the following commands to download and unzip the binary.
curl -sOL https://github.com/prometheus/statsd_exporter/releases/download/v0.22.4/statsd_exporter-0.22.4.linux-amd64.tar.gz
tar -xvf statsd_exporter-0.22.4.linux-amd64.tar.gz
Configure statsd_exporter
The statsd_exporter can be configured to translate specific dot-separated statsd metrics into labelled Prometheus metrics via a simple mapping language. This mapping is saved in a YAML file and used for launching statsd_exporter.
- Open a new file named statsd-mapping-config.yaml in the
statsd_exporter-0.22.4.linux-amd64 folder.
- Copy and paste the following into
statsd-mapping-config.yaml
mappings:
- match: "api.*.*.*"
  name: "api_metrics"
  labels:
    path: "$1"
    method: "$2"
    status: "$3"
This mapping file will take a metric named, for example, api.hello.GET.200, and transform it into the Prometheus format as api_metrics{path=hello,method=GET,status=200}. The metric api.hello.GET.200 will be generated by the NodeJs application that has a statsd client.
Launch Amazon Managed Service for Prometheus workspace
- Create Amazon Managed Service for Prometheus workspace as described here.
- Copy the workspace ID of the created workspace as described here. This workspace ID will be used in the section for configuring the Prometheus server.
- Create an IAM role with AmazonPrometheusRemoteWriteAccess policy and attach this role to the Amazon EC2 instance.
- Add the following into the YAML file named statsd-prometheus.yaml, and upload it to the created workspace. This will generate an average value of API invocations over a 5 minute duration based on the path and status code.
groups:
  - name: statsd
    rules:
    - record: metric:api_metrics
      expr: sum(rate(api_metrics[5m])) by (path, status)
Install Prometheus server
- Open a new terminal window.
- Connect to your Linux instance using Session Manager.
- Run the following commands to install Prometheus server.
export PROMETHEUS_VERSION=2.34.0
curl -OL https://github.com/prometheus/prometheus/releases/download/v${PROMETHEUS_VERSION}-rc.0/prometheus-${PROMETHEUS_VERSION}-rc.0.linux-amd64.tar.gz
tar xvzf prometheus-${PROMETHEUS_VERSION}-rc.0.linux-amd64.tar.gz
export PATH=$PATH:$HOME/prometheus-${PROMETHEUS_VERSION}-rc.0.linux-amd64
Configure Prometheus server
- Create a configuration file named prometheus.yaml using the following content. Change regionId as applicable. Change workspaceId with the workspace ID from the section on launching Amazon Managed Service for Prometheus workspace.
global:
  scrape_interval: 15s
  external_labels:
    monitor: 'statsd_exporter'
scrape_configs:
  - job_name: 'statsd_exporter'
    static_configs:
      - targets: ['localhost:9102']
remote_write:
  -
    url: https://aps-workspaces.<regionId>.amazonaws.com/workspaces/<workspace Id>/api/v1/remote_write
    queue_config:
        max_samples_per_send: 1000
        max_shards: 200
        capacity: 2500
    sigv4:
        region: <regionId>
Launch Prometheus server
- Open a new terminal window.
- Connect to your Linux instance using Session Manager.
- Launch the Prometheus server with the prometheus.yaml configuration file created previously using the following commands.
export PROMETHEUS_VERSION=2.34.0
export PATH=$PATH:$HOME/prometheus-${PROMETHEUS_VERSION}-rc.0.linux-amd64
prometheus --config.file=prometheus.yaml
The console should show output similar to this to indicate that Amazon Managed Service for Prometheus was connected to by the Prometheus server successfully:
ts=2022-03-04T01:12:25.394Z caller=dedupe.go:112 component=remote level=info remote_name=4b1ae2 url=https://aps-workspaces.regionId.amazonaws.com/workspaces/workspaceId/api/v1/remote_write msg="Starting WAL watcher" queue=4b1ae2
ts=2022-03-04T01:12:25.394Z caller=dedupe.go:112 component=remote level=info remote_name=4b1ae2 url=https://aps-workspaces.regionId.amazonaws.com/workspaces/workspaceId/api/v1/remote_write msg="Starting scraped metadata watcher"
ts=2022-03-04T01:12:25.394Z caller=dedupe.go:112 component=remote level=info remote_name=4b1ae2 url=https://aps-workspaces.regionId.amazonaws.com/workspaces/workspaceId/api/v1/remote_write msg="Replaying WAL" queue=4b1ae2
Launch a NodeJs application instrumented with statsd client
- Open a new terminal window
- Connect to your Linux instance using Session Manager.
- Run the following commands to create a folder and initialize:
mkdir app
npm init -y
npm i express node-statsd --save
- Open a new file named index.js and paste the following:
const express = require('express')
const StatsD = require('node-statsd')
const statsdClient = new StatsD()
const app = express()
const port = 4000
let incrVar
app.get('/hello', (req, res) => {
  incrVar = `${req.path}.${req.method}.200`
  incrVar = `api.${incrVar.substring(1)}`
  statsdClient.increment(incrVar)
  res.status(200).send('Hello World!')
})
app.use('/', (req, res) => {
  incrVar = `${req.path}.${req.method}.404`
  incrVar = `api.${incrVar.substring(1)}`
  statsdClient.increment(incrVar)
  res.status(404).send('Not found.')
})
app.listen(port, () => {
  console.log(`Example app listening on port ${port}`)
})
This NodeJs application exposes an ExpressJs based endpoint /hello on port 4000 for GET verb. This endpoint responds with a simple text “Hello World!” with status code 200. Invoking any other endpoint will result in a response as “Not found.” with a status code as 404.
This application uses the node-statsd package for implementing the statsd client. The metric emitted will have the format name api.<requestPath>.<requestMethod>.<statusCode> where, the requestPath is the end-point invoked, requestMethod is the HTTP method, and the statusCode is set up in the response. The value of this metric is a monotonically increasing counter to track the number of invocations. For example, when /hello is invoked with GET, a metric will be emitted as api.hello.GET.200 with the value incremented by 1.
Launch Grafana workspace
- Create a workspace as described here.
- Define user access as described here.
Add Prometheus data source
- Add the Amazon Managed Service for Prometheus data source as described here.
Create dashboard
- Create a new dashboard with the Import option as described here.
- Upload the following JSON document:
{"__inputs":[],"__requires":[{"type":"grafana","id":"grafana","name":"Grafana","version":"8.2.5"},{"type":"panel","id":"timeseries","name":"Time series","version":""}],"annotations":{"list":[{"builtIn":1,"datasource":"-- Grafana --","enable":true,"hide":true,"iconColor":"rgba(0, 211, 255, 1)","name":"Annotations & Alerts","target":{"limit":100,"matchAny":false,"tags":[],"type":"dashboard"},"type":"dashboard"}]},"editable":true,"fiscalYearStartMonth":0,"gnetId":null,"graphTooltip":0,"id":null,"links":[],"liveNow":true,"panels":[{"datasource":null,"fieldConfig":{"defaults":{"color":{"mode":"palette-classic"},"custom":{"axisLabel":"","axisPlacement":"auto","barAlignment":0,"drawStyle":"line","fillOpacity":0,"gradientMode":"none","hideFrom":{"legend":false,"tooltip":false,"viz":false},"lineInterpolation":"smooth","lineWidth":1,"pointSize":5,"scaleDistribution":{"type":"linear"},"showPoints":"auto","spanNulls":false,"stacking":{"group":"A","mode":"none"},"thresholdsStyle":{"mode":"off"}},"mappings":[],"thresholds":{"mode":"absolute","steps":[{"color":"green","value":null},{"color":"red","value":80}]}},"overrides":[]},"gridPos":{"h":19,"w":24,"x":0,"y":0},"id":2,"options":{"legend":{"calcs":[],"displayMode":"list","placement":"bottom"},"tooltip":{"mode":"single"}},"targets":[{"exemplar":true,"expr":"metric:api_metrics","interval":"","legendFormat":"{{path}}-{{status}}","refId":"A"}],"title":"API metrics (rate)","type":"timeseries"}],"refresh":"","schemaVersion":32,"style":"dark","tags":[],"templating":{"list":[]},"time":{"from":"now-5m","to":"now"},"timepicker":{},"timezone":"browser","title":"statsd","uid":"5fn7dTY7z","version":9}
Instructions for Repeater use case
As discussed earlier, in the Repeater use case,
- The statsd process is configured with the repeater backend.
- The application is not changed.
The following instructions will set up the Repeater use case.
Configure statsd process
The statsd process should be reconfigured with a repeater backend with the following commands:
- Go to the terminal where statsd is launched.
- Create a file named statsd-config.js, and paste the following.
{
 backends: [ "./backends/console", "./backends/repeater" ],
 repeater: [ { host: "localhost", port: 9125 } ]
}
The ./backends/console is strictly not required. However, using this backend will show the metrics on the console. The repeater points to the host and port of the statsd_exporter running on the same Amazon EC2 instance with 9125 as the default port number.
Launch statsd process
Launch the statsd process with the following command. Make sure that the path to statsd-config.js is correctly provided.
node stats.js statsd-config.js
Launch statsd_exporter
- Go to the terminal where statsd_exporter was installed.
- Launch it with the following command. Make sure that the path to statsd-mapping-config.js is correctly provided.
./statsd_exporter --statsd.mapping-config=statsd-mapping-config.yaml
Simulate HTTP requests
Run the following commands in two different terminals to simulate HTTP GET requests at the /hello end-point to generate the metric for 200 status code and /bye end-point to generate the metric for 404 status code. These commands will run for five minutes. The duration can be changed by setting a different value for the -z flag.
- Get the public IP address of the running Amazon EC2 instance.
- Enable in-bound TCP traffic from your IP address on port 4000.
hey -z 5m http://ec2-public-ip:4000/hello
hey -z 5m http://ec2-public-ip:4000/bye
View dashboard
- Launch the dashboard from the Amazon Managed Grafana console as described here.
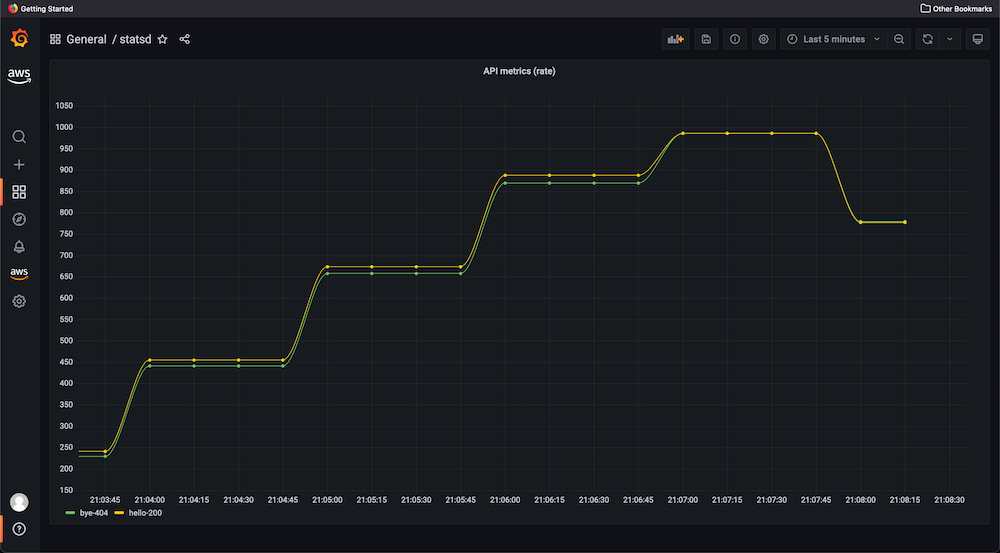
- The following graph is seen. Note the legend at the bottom left for curves corresponding to the API path and status.
Instructions for Relay use case
Configure application
- Go to the terminal where the application is running.
- Stop the application with Ctrl-C.
- Edit index.js by changing the declaration of statsdClient as shown in the following:
const statsdClient = new StatsD({
  host: "localhost",
  port: 9125
})
Launch statsd process
- In general, to use the Relay use case, the statsd process doesn’t require a change. However, in this post, the configuration was changed to add a repeater back-end that was added in an earlier section. It’s recommended that the repeater backend be removed.
Go to the terminal where the statsd process is running, and edit statsd-config.js with the following content:
{
 backends: [ "./backends/console" ]
}
Launch statsd_exporter
- Go to the terminal where statsd_exporter was installed.
- Launch it with the following command. Make sure that the path to statsd-mapping-config.js is correctly provided.
./statsd_exporter --statsd.mapping-config=statsd-mapping-config.yaml --statsd.relay.address=localhost:8125
Now the statsd_exporter is configured to relay statistics to the statsd process.
Simulate HTTP requests
Run the following commands in two different terminals to simulate HTTP GET requests at the /hello end-point to generate the metric for 200 status code and /bye end-point to generate the metric for 404 status code. These commands will run for five minutes. The duration can be changed by setting a different value for the -z flag.
- Get the public IP address of the running Amazon EC2 instance.
- Enable in-bound TCP traffic from your IP address on port 4000.
hey -z 5m http://ec2-public-ip:4000/hello
hey -z 5m http://ec2-public-ip:4000/bye
View dashboard
- Launch the dashboard from the Amazon Managed Service for Grafana console by clicking on the Grafana workspace URL.
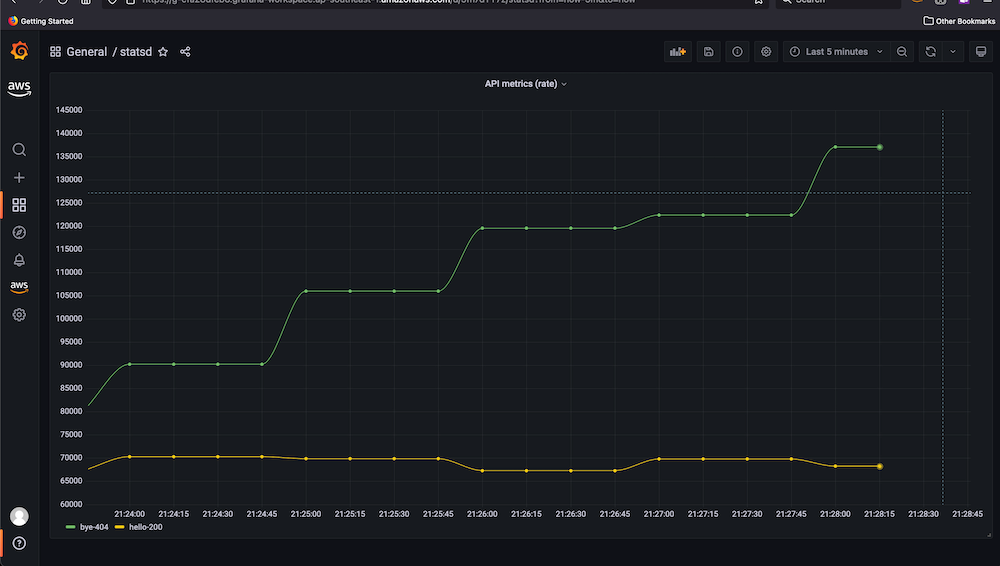
- The following graph is seen. Note the legend at the bottom left for curves corresponding to the API path and status.
Clean up
To avoid incurring future charges, delete the following resources:
- Delete Grafana workspace as described here.
- Delete Prometheus workspace as described here.
- Terminate the Amazon EC2 instance as described here.
- Remove the IAM policy as described here.
Conclusion
This post describes a means to ingest, query, and visualize custom metrics from applications collected by the statsd process running on an Amazon EC2 Linux instance using Amazon Managed Service for Prometheus and Amazon Managed Grafana. Two scenarios for using stasd_exporter were discussed – repeater and relay – based on the changes to be done either with statsd or the application. Depending on the requirements, different custom metrics can be created, such as HTTP latency, or other values of the request path, query parameters, etc. Furthermore, Amazon Managed Service for Prometheus and Amazon Managed Grafana can be configured to raise alerts as required.
Author: