Networking & Content Delivery
AWS Direct Connect monitoring and failover with Anomaly Detection
As enterprises move to the Cloud, having a reliable network connection to their on-premises data centers is fundamental. In this post, I show how to monitor your AWS Direct Connect links and initiate remediation (including automatic failover) when degradation in end-to-end path quality (packet loss, high latency) is detected.
Multiple Direct Connect links at separate locations provide the required reliability for on-premise connectivity, with an SLA of up to 99.99%. The protocol used to exchange routes between your network and AWS (Border Gateway Protocol, or BGP) is straightforward. Transient changes in end-to-end network conditions that may affect application performance are often overlooked when making routing decisions. The solution described in this post addresses these limitations by actively monitoring the path beyond the physical Direct Connect link and detecting anomalies, and taking automated remediation steps if desired.
Monitoring
You use at least one monitored IP for each of your Direct Connect Virtual Interfaces (VIF). You then use the monitored IP to measure path quality (latency and packet loss) between an AWS Region and the on-premises network, including AWS backbone links and Direct Connect links.
For example, it could be a loopback address configured at your border router in the Direct Connect location, and advertised to AWS through BGP (figure 1, left), or an IP address at your on-premise router, if you want to perform end-to-end monitoring (figure 1, right). You can also do both using more than one monitored IP per link.
Be aware that monitoring the Point-to-Point address of your router (the /30 range used for BGP peering) will work with Virtual Private Gateway attachments (VGW), but you cannot reach that IP if you are using AWS Transit Gateway.

Figure 1: Various targets for active end-to-end path monitoring.
Active/Passive and Equal Cost Multi-Path
If you are using an active/passive architecture for your links, make sure to monitor the passive links as well.
To monitor an individual link, the monitored IP must be reachable only through the selected VIF. You must take special care when multiple links are active at the same time (when using Equal Cost Multi-Path, ECMP, for example) to monitor individual links instead of the aggregate. This is to prevent blind spots. Advertise the Loopback addresses you monitor to AWS only and not into on-premises networks, so if a Direct Connect link fails, the corresponding loopback address becomes unreachable from AWS and successfully shows an issue.
Monitoring dashboard
Once you decide which IP addresses to monitor, setup the debugging tool for network connectivity using the step-by-step instructions in the blog post, Debugging tool for network connectivity from Amazon VPC. The automation launches a monitoring instance and generates an Amazon CloudWatch dashboard with Packet Loss, Latency, and links to troubleshooting information on CloudWatch logs. You can customize these dashboards, adding widgets for other metrics, such as the Virtual Interfaces ingress and egress traffic statistics. I show an example of such a dashboard the following screenshot (Figure 2).
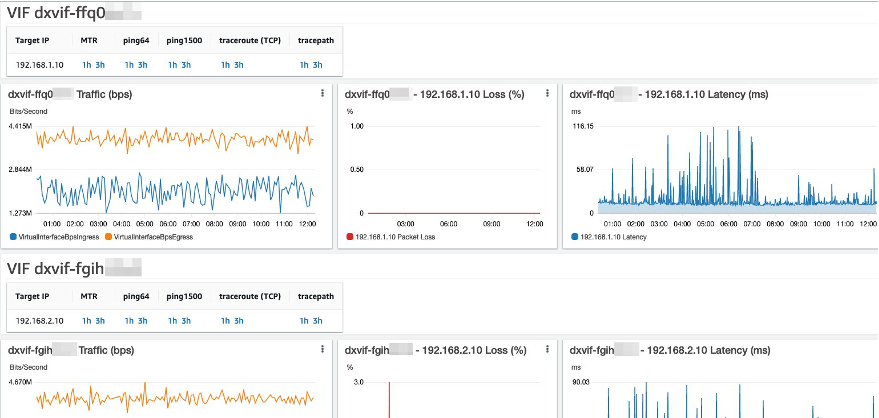
Figure 2: Sample monitoring dashboard showing traffic, packet loss and latency metrics.
Setting up alarms
Now that your monitoring is in place, it is time to configure alerts on anomalous conditions that may require your attention. The first step is to create an Amazon Simple Notification Service (Amazon SNS) Topic and subscribe to the e-mail addresses to notify of alerts.
The next step is to create some alarms; an easy way to do this is to go to your dashboard, click on the three vertical dots on a Widget, choose “View in metrics”, and once there click on the bell icon to create the alarm. I show this in the following screenshots (figures 3 and 4).
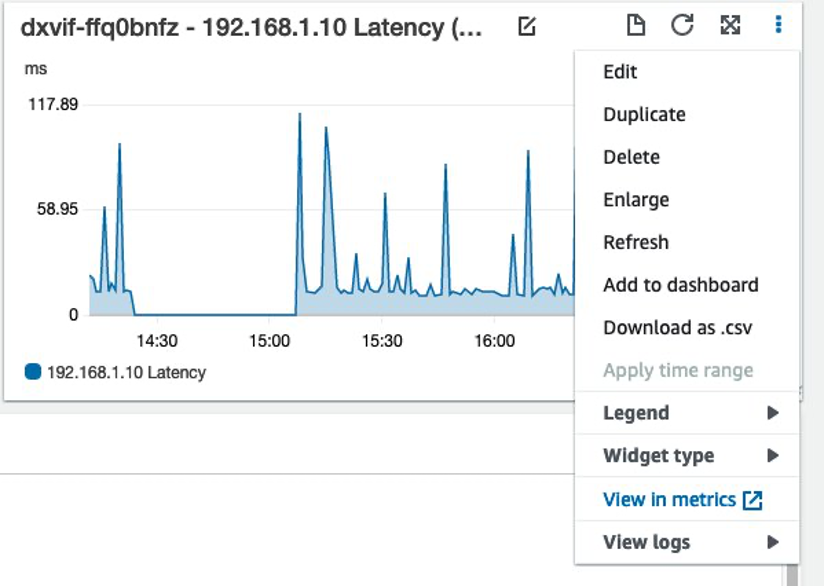
Figure 3: Setting up an alarm for a metric, part 1.
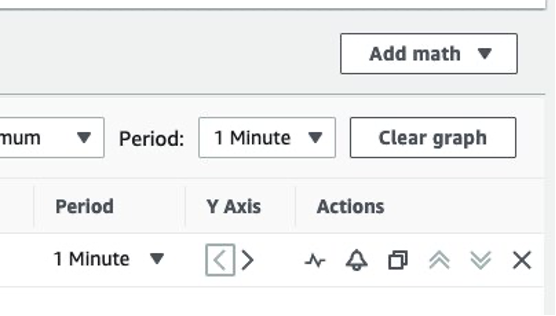
Figure 4: Setting up an alarm for a metric, part 2.
Anomaly detection
Instead of using fixed thresholds, you can use CloudWatch built-in anomaly detection. This feature works by learning from past data and making an estimate of future behavior, defining a range of “expected values.” CloudWatch measures this band in “standard deviations,” and is adjustable. Any datapoint outside of this band is considered “anomalous.” You are able to set up alerts if the actual values are above, below, or outside the predicted range.
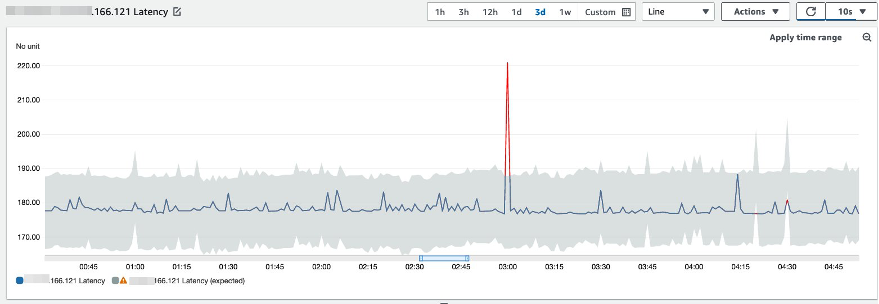
Figure 5: Anomaly detection chart in CloudWatch.
You can also specify how many anomalous datapoints in a period of time will set off an alarm. AWS recommends that a sample of at least 3 datapoints is used to avoid alerting on short spikes. If changes are regular or frequent, they are incorporated into the model over time.
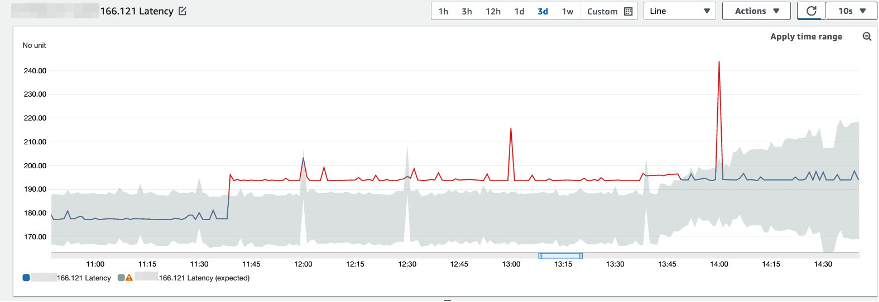
Figure 6: Anomaly detection chart showing how the expected values band adapts to persistent metric changes.
Monitor your metrics and choose an anomaly detection threshold that makes sense for your workload; a thicker band will produce less false positives, but may miss some situations that affect your applications.
For example, a sudden traffic drop on a Virtual Interface is certainly an anomaly and should set off an alarm. If the band is too thick and the lower extreme goes to negative values, it is not detected. BGP keepalive traffic on Direct Connect between the AWS router and its on-premises peer causes a baseline of visible ingress and egress traffic, even if connectivity beyond this point-to-point link is severed. Therefore, defining a manual alarm threshold of 0 bps or 0 pps is not sufficient.
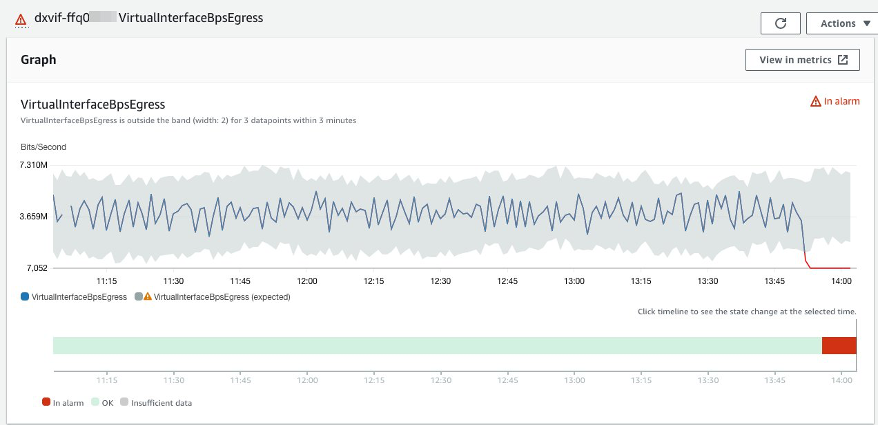
Figure 7: Traffic chart showing a sudden drop in bps, which remains above zero (see y axis legend).
Anomaly detection needs good data in order to make correct predictions. You can explicitly exclude certain periods (for example, maintenance windows or outages) from the model to keep it from learning incorrect values. You can also enable anomaly detection without actually setting any alarms if you want to see how the model performs.
AWS recommends naming your alarms using the Virtual Interface id first, and then the metric name (for example, “dxvif-ffq0wxyz VirtualInterfaceBpsEgress”). This makes it easier to understand the notifications and facilitates the automated response should you decide to implement one.
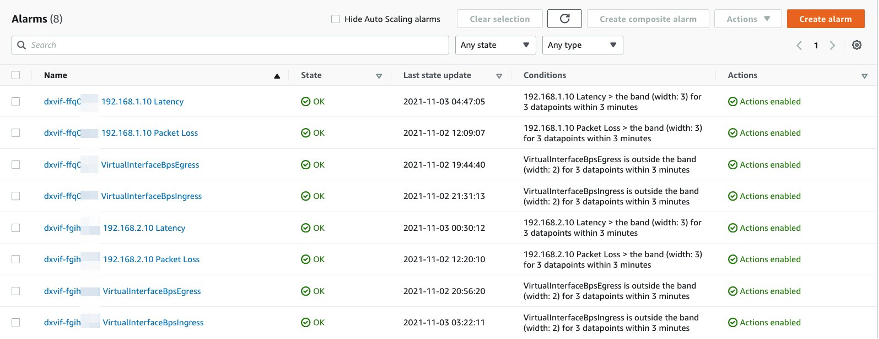
Figure 8: List of CloudWatch alarms for different metrics.
Automated response
Provided you deployed a resilient architecture, and you are comfortable with your monitoring and confident in your alarms, you may choose to setup automatic remediation. You must use extreme caution when setting automatic remediation up to avoid causing additional problems when the response is invoked (see the additional considerations section below for more details).
Remediation works by invoking the Direct Connect API to bring down BGP sessions on a particular VIF upon the reception of a CloudWatch Alarm. This way, action is taken on issues that don’t hinder BGP session between border routers, but impact application performance. By actively forcing a “degraded” link out of service, the network will converge over the remaining “good” paths.
High resiliency
You can achieve high resiliency for critical workloads by using two single connections to multiple locations.
In this scenario, you initiate failover based on Packet Loss and (if your application is sensitive to it) high latency. At a minimum, you must keep VIFs at 1 to avoid bringing down both links at the same time.
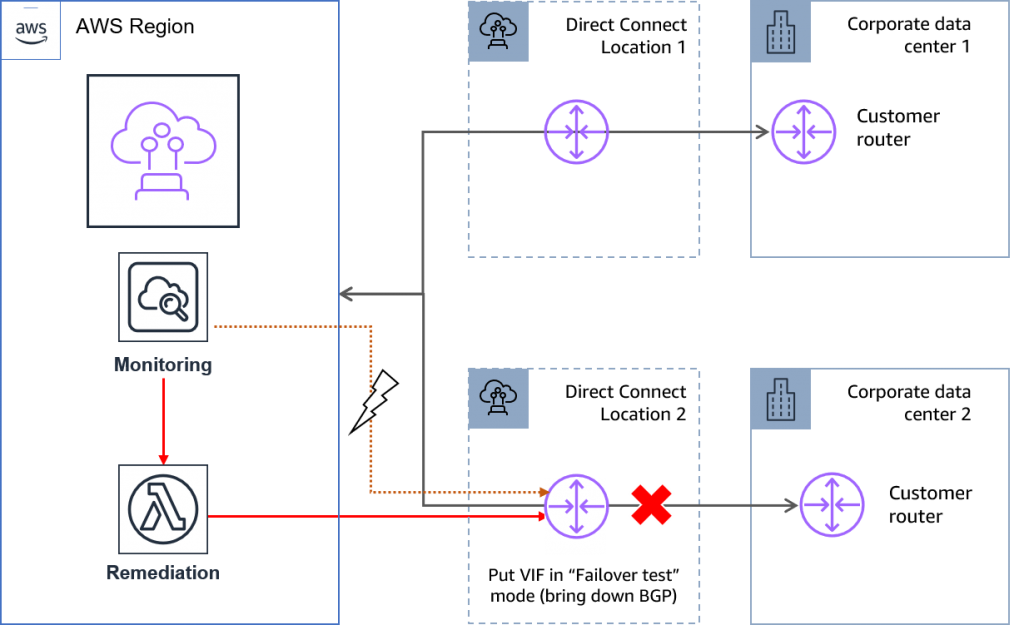
Figure 9: Invoking failover in a high resiliency model.
Maximum resiliency
You can achieve maximum resiliency for your critical workloads by using separate connections that terminate on separate devices in more than one location.
In this case, you can set minimum VIFs at 2 to account for issues that affect all links in a particular Direct Connect Location, and keep at least 2 links for enhanced performance and reliability.
Figure 10: Invoking failover in a maximum resiliency model.
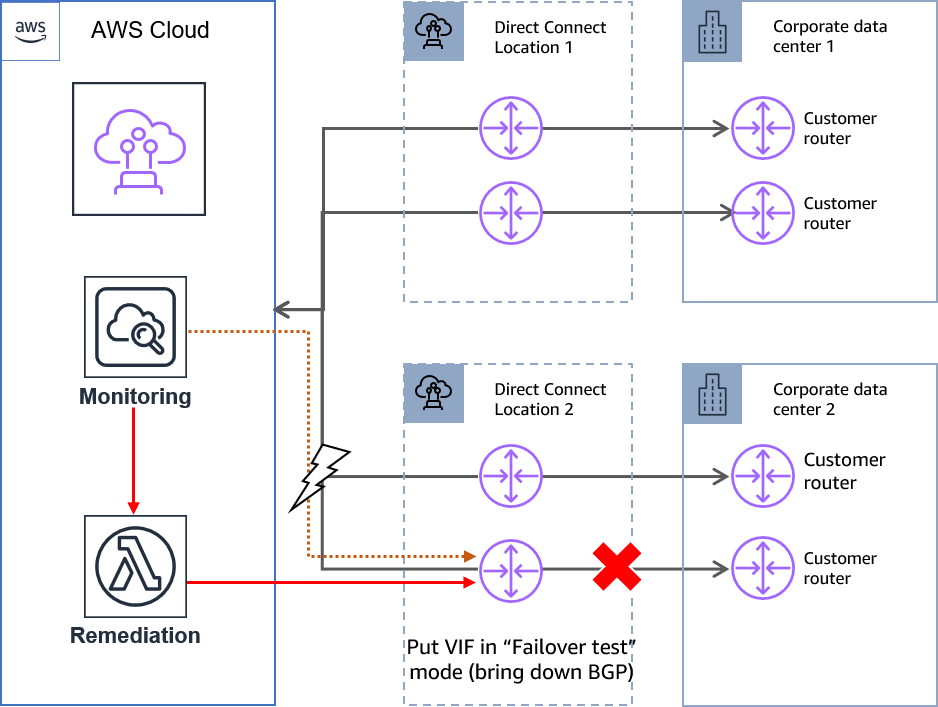
Figure 10: Invoking failover in a maximum resiliency model.
Solution architecture
This solution uses an Amazon EventBridge rule to match the desired alarms and invokes an AWS Lambda function that executes the response.
CloudWatch alarms are very flexible; you can use composite alarms to reduce alarm noise.
Sample Lambda function use the AWS Direct Connect Resiliency Toolkit API to put the impeded Virtual Interface in “Failover Test” mode for up to 180 minutes. Provided you have a Business or Enterprise Support plan, it also uses the Support API to open a Support Case.
Sample code, along with deployment instructions, can be found in this GitHub repository.
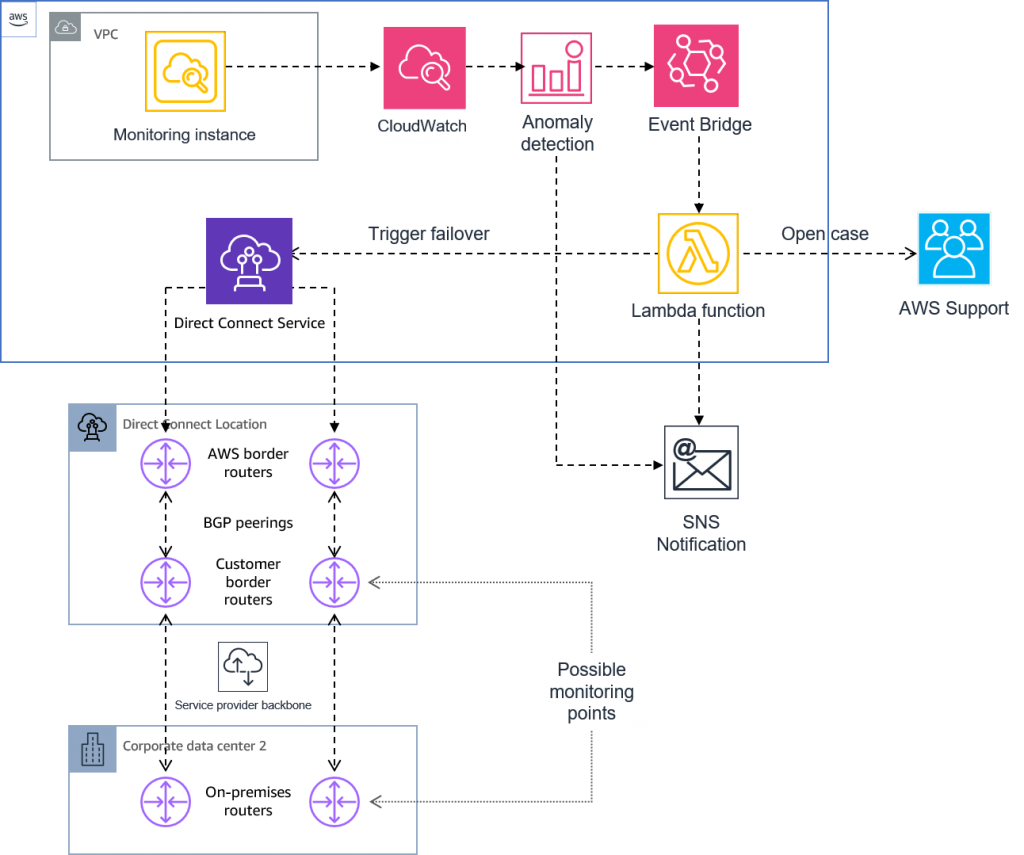
Figure 11: Automated response solution architecture.
The following diagram (Figure 12) outlines the Lambda function logic:
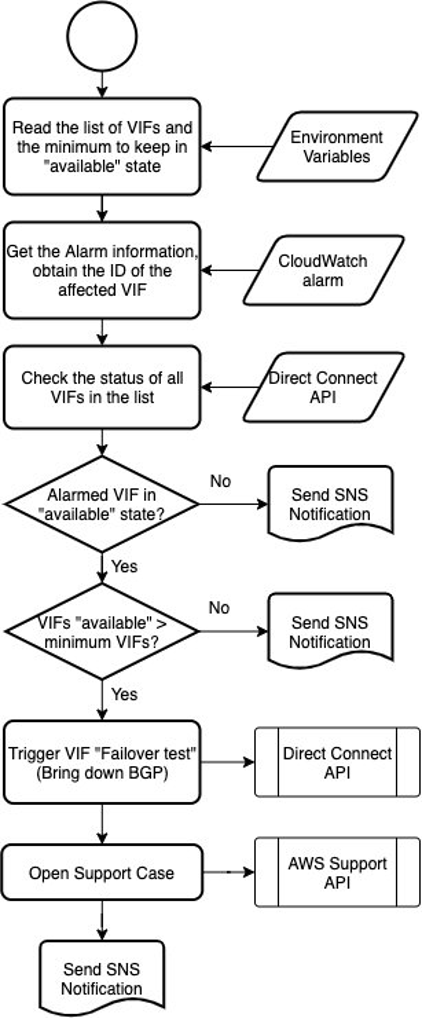
Figure 12: Sample Lambda function logic
Additional considerations
This section contains topics that require thoughtful consideration before implementing the solutions described in this blog post to ensure you don’t inadvertently cause additional problems when you invoke responses.
Keep it simple
The motivation of this post is to address some limitations of the BGP protocol, which is designed with simplicity in mind. The inevitable trade-off, especially if automated responses are implemented, is that the system becomes more complex. You must find a balance between considering every potential failure scenario and keeping the architecture as simple and easy to manage as possible.
Step-by-step
Adopt an incremental approach when implementing the solutions described in this post. Start with monitoring, then move to alarming and then, if you decide it is beneficial, implement automated responses for the most reliable alarms.
Failures with a common root cause
Some failures (for example, issues in the AWS or Service Provider network backbone) may affect more than one link at the same time. You must take care to avoid bringing down all the affected VIFs at the same time. The example Lambda function I provided implements this “minimum VIFs” concept to provide guardrails for this situation.
Cascading events
Other failures may have a cascading effect. For example, if a VIF has issues and is brought down, other VIFs may experience increased traffic and, in some cases, increased latency. You must take this into account when designing the failover logic.
Monitoring the monitor
If the monitoring instance is down, it will not send metrics to CloudWatch and no alarms are initiated. AWS recommends setting EC2 Auto Recovery in this instance. Also, you can set up an alarm to fire if you are not getting values for some of your metrics. In the event that the monitoring instance suffers some failure that affects the metrics of multiple links (for example, packet loss at the Availability Zone where you deployed the instance), it is discussed in the case described as “failures with a common root cause” above.
Cleanup
To avoid any unnecessary charges, don’t forget to remove AWS resources when they are no longer needed. Monitoring instance and dashboard termination instructions can be found in the Debugging tool for network connectivity from Amazon VPC blog post. Remove unneeded CloudWatch metrics and alarms, Amazon EventBridge rules, AWS SNS Topics, and Lambda functions.
Conclusion
In this post, I reviewed how to improve the operational excellence and resiliency of your Direct Connect architecture. I started with monitoring, then moved on to how to set up alarms using anomaly detection, and finally to automate the response with Lambda functions. AWS recommends adopting an incremental approach and move forward with caution, especially in the last stage. Don’t hesitate to reach out to AWS Support or your AWS representatives if you need additional guidance.

Hernán Terrizzano
Hernán is a Senior Technical Account Manager based in Argentina. He provides advocacy and strategic technical direction and enthusiastically keeps his customers’ AWS environments operationally healthy. Before AWS, he worked as a Network Engineer and Architect for big enterprises.