Networking & Content Delivery
Gain usage insights with Amazon CloudWatch metrics and Contributor Insights for AWS PrivateLink
We recently launched Amazon CloudWatch metrics for AWS PrivateLink. This feature publishes metrics for PrivateLink services and endpoints at 1-minute intervals at no cost to you. You can also use CloudWatch Contributor Insights to visualize usage against your PrivateLink services. This blog summarizes PrivateLink metrics, shows the metrics and filters in Amazon CloudWatch, and provides scenarios of how to make decisions informed by the metric data.
AWS PrivateLink is a fully managed service that allows private customer-initiated connectivity from consumers on AWS or on premises to services hosted in Amazon Virtual Private Clouds (VPCs). You use PrivateLink to connect to AWS services, SaaS services from service providers hosted on AWS, affiliated organizations such as partners or regulators on AWS, supported AWS Marketplace partner services, and applications shared between your VPCs.
In this blog, PrivateLink service is used interchangeably with VPC Endpoint Service, and PrivateLink endpoint is used interchangeably with VPC Endpoint. CloudWatch metrics are available for Interface and Gateway Load Balancer (GWLB) endpoints, so VPC Endpoint refers to endpoint types of GWLB and Interface, but not Gateway.
Feature overview
Until today, you had to derive visibility into PrivateLink from related metrics, such as Network Load Balancer (NLB) metrics or VPC flow logs. For example, service providers hosting a VPC Endpoint Service had some insight from NLB metrics, but did not have a granular view into active connections per consumer VPC Endpoint, top talkers to the service, and bytes processed per consumer VPC Endpoint. Also, consumers had to use VPC flow logs to understand usage of each VPC Endpoint. Deriving findings from other sources added operational overhead and cost.
You can now get metrics for your PrivateLink services and PrivateLink endpoints, such as the following use cases.
PrivateLink service metrics use cases
- Defend against unexpected user behavior: Troubleshoot unexpected traffic patterns by consumers against VPC Endpoints associated with your VPC Endpoint Service. If there is a sudden unexpected increase in ActiveConnections, the service owner can disconnect the associated endpoints. We explain this use case in the Example: Monitoring active connections section of this blog.
- Troubleshooting with consumer: Understand your service’s health by monitoring how many resets your service is sending to customers. When debugging connection errors with a consumer of your service, you can validate whether the service is resetting connections with the RstPacketsSent metric, or if something else is failing on the network path.
- VPC Endpoint Service consumer cost allocation: If your organization has multiple departments consuming a shared VPC Endpoint Service, you can have unit-based cost accounting based on VPC Endpoints’ BytesProcessed metrics against the VPC Endpoint Service.
- AWS Gateway Load Balancer (GWLB) service consumer cost allocation: If you are a service provider, you can use the BytesProcessed metric and filter by each Interface or GWLB endpoint to bill service consumers.
- Business development: Identify valuable customers for business development, such as those sending the most bytes to the service.
- Identify customer behavior: Predict customer behavior based on usage patterns. For example, you may have customers who have fewer ActiveConnections with high BytesProcessed at once, whereas other customers maintain a consistent number of ActiveConnections with a lower rate of BytesProcessed throughout the day.
- Track service adoption: Use the EndpointsCount metric as a measure of how your service is growing and how many new consumers you are acquiring.
PrivateLink Interface endpoint metrics use cases
- Resource and cost hygiene: Clean up your unused VPC Endpoints. We explain this use case in the Example: Identifying unused VPC Endpoints section of this blog.
- Tracking endpoint usage: Find your most consumed VPC Endpoints, or those growing in usage month-to-month, with BytesProcessed and ActiveConnections metrics.
- Cost visibility: Reconcile the bytes processed by your VPC Endpoints with charges on your monthly statement from AWS.
- Identify hot subnets: Customers can use the Subnet Id filter dimension to identify if distribution of traffic for VPC Endpoints is imbalanced. If you have many VPC Endpoints in the same subnet, you may be overly dependent on one Availability Zone (AZ). If this is the case, distribute your endpoints across additional subnets and AZs.
PrivateLink Gateway Load Balancer endpoint metrics use cases
- Troubleshooting connectivity failures: When debugging network infrastructure hop by hop, customers can look at metrics at each layer. Customers can now use GWLB endpoint metrics for ActiveConnections, NewConnections, BytesProcessed, and PacketsDropped when performing analysis.
- Tracking GWLB endpoint usage: Track the traffic patterns on your GWLB endpoint and detect anomalous network behavior.
- Cost visibility: Reconcile the bytes processed by your GWLB endpoints with charges on your monthly statement from AWS.
Metrics are available for PrivateLink services configured based on NLBs and GWLBs, and for PrivateLink endpoints of type Interface and GWLB. Metrics appear when traffic flows through a VPC Endpoint or VPC Endpoint Service, and CloudWatch metrics namespaces will appear when there is a CloudWatch metric to display. The data is available in CloudWatch for 15 months. Metric data before January 27, 2022 is not available. For more information about CloudWatch metrics and Contributor Insights for PrivateLink, refer to CloudWatch metrics for AWS PrivateLink.
Why CloudWatch?
Amazon CloudWatch metrics allows you to search, graph, and alarm based on data related to your PrivateLink services and endpoints. For more information on CloudWatch metrics, refer to Using Amazon CloudWatch metrics in the Amazon CloudWatch User Guide.
CloudWatch alarms enable you to receive alerts based on static thresholds, anomaly detection, composite alarms, or metric math expressions. Service providers and consumers can now understand what is happening at the service and endpoint respectively. For more information on CloudWatch alarms, refer to Using Amazon CloudWatch alarms in the Amazon CloudWatch User Guide.
The CloudWatch Contributor Insights feature helps you analyze high-cardinality time-series data. If your VPC Endpoint Service has tens, hundreds, or thousands of consumer VPC Endpoints, it’s difficult to pinpoint who or what is affecting system performance. Contributor Insights ranks and graphs the top VPC Endpoints consuming your VPC Endpoint Services based on new connections, active connections, bytes processed, and RST packets received. You can view the top-N contributors, total number of unique contributors, and usage over time window increments over the past 24 hours. During an operational event, you can quickly isolate, diagnose, and remediate issues. For more information on CloudWatch Contributor Insights, refer to Using Contributor Insights to analyze high-cardinality data in the Amazon CloudWatch User Guide.
Sample architecture
All examples in this blog use the architecture shown in Figure 1: CloudWatch metrics for PrivateLink services and endpoints. In this sample architecture, the VPC Endpoint Service is available to multiple consumers. CloudWatch metrics for VPC Endpoints are collected in each consumer’s AWS account. CloudWatch metrics for the VPC Endpoint Service are collected in the service provider’s AWS account.
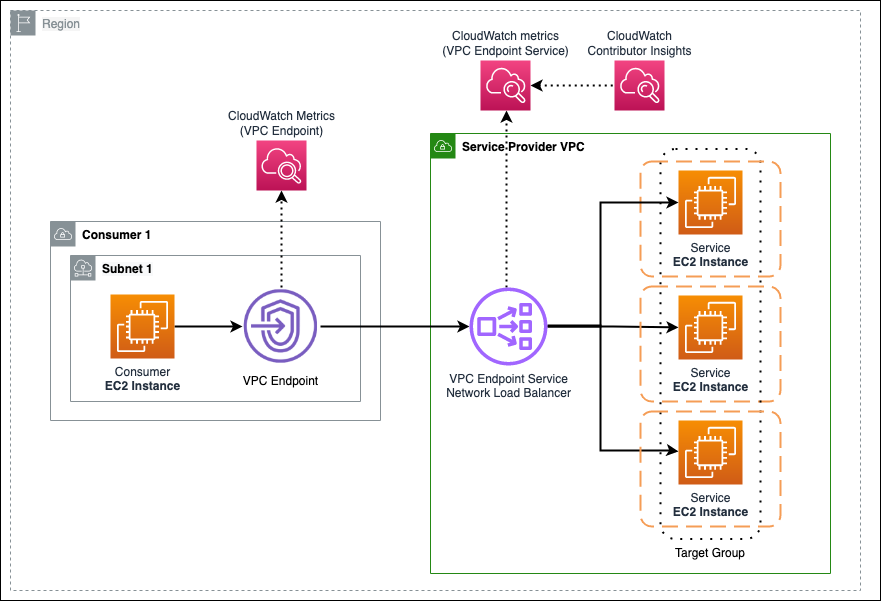
Figure 1: CloudWatch metrics for PrivateLink services and endpoints
VPC Endpoint Service CloudWatch metrics
You can view the following VPC Endpoint Service metrics under the Monitoring tab of each VPC Endpoint Service in the VPC console.
- Navigate to Endpoint Services in the VPC console.
- Choose the VPC Endpoint Service you want to monitor.
- Choose the Monitoring tab.
You can also view these metrics under the AWS/PrivateLinkServices namespace in the CloudWatch console. This namespace contains metrics from all VPC Endpoint Services receiving traffic from VPC Endpoints.
- Navigate to All metrics in the CloudWatch console.
- Choose the AWS/PrivateLinkServices namespace.
- Choose the metric names you want to view.
- Choose the metrics you want to graph. In the Metrics pane, you can also search based on the metrics, dimensions, or resource id.
| Metric Name | Description |
| ActiveConnections | Number of concurrently active flows to the PrivateLink service from PrivateLink endpoints. |
| NewConnections | Number of new flows to the PrivateLink service from the PrivateLink endpoints. |
| BytesProcessed | Bytes exchanged between the PrivateLink service and PrivateLink endpoints. |
| RstPacketsSent | Number of RST Packets sent by the PrivateLink service. |
| EndpointsCount | Number of endpoint-connections to the Endpoint Service. |
The metrics in the preceding table can be filtered by the following dimensions. The filters are useful for narrowing down search results, like when one or more VPC Endpoint Service(s) has one or more VPC Endpoint(s).
| Filter Dimensions | Description |
| Service Id | PrivateLink service Id |
| VPC Endpoint Id | PrivateLink endpoint Id |
| Az | Availability Zone Id |
| Load Balancer Arn | NLB or GWLB ARN |
Example: Monitoring active connections
This example explains how you can use PrivateLink service metrics to inform your investigation of unexpected spikes in ActiveConnections.
Service consumers define how the service can receive traffic because they each select the subnets and security groups of their VPC Endpoints. Some service providers have faced challenges where a consumer created a public route to the Endpoint Service. When found and exploited, this results in an increased rate of traffic sent to the VPC Endpoint Service. This could cause service degradation or an outage across all the service’s consumers. With CloudWatch metrics at the VPC Endpoint level granularity, service providers can recognize the bad actor, reject its VPC Endpoint, then re-accept once the issue is fixed.
This example demonstrates a use case for monitoring active connections to your VPC Endpoint Service, and alarming when there is atypical consumer VPC Endpoint behavior spotted. The service provider uses CloudWatch Contributor Insights to identify the consumer with a spike in active connections, based on the VPC Endpoint Id filtering dimension, and can reject the endpoint connection on the service.
The services covered in this example are highlighted in Figure 2: CloudWatch metrics for PrivateLink services. In this example, the VPC Endpoints of each consumer are connected to a service provider’s VPC Endpoint Service. The VPC Endpoint Service is emitting metrics to CloudWatch metrics. One consumer makes more connections than usual. A CloudWatch alarm based on the CloudWatch metrics shows unusual activity.
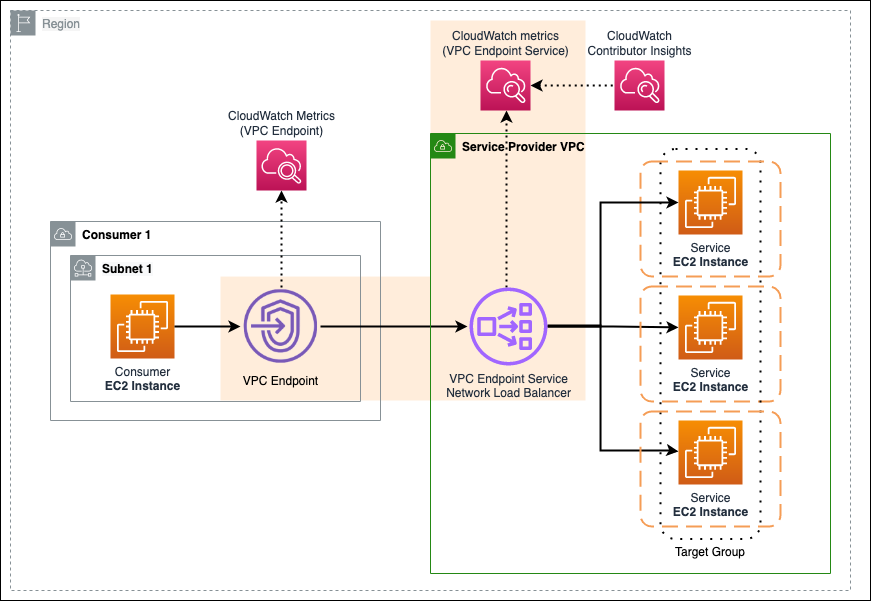
Figure 2: CloudWatch metrics for PrivateLink services
The example scenario expects each consumer will send data with a predictable pattern. To monitor this, CloudWatch alarm with Anomaly Detection is created for the service provider’s VPC Endpoint Service, based on the ActiveConnections metric. The alarm alerts and sends a notification if the consumer VPC’s connections exceed the typical pattern or expected behavior based on the Anomaly Detection band. For more information on creating CloudWatch alarms with Anomaly Detection, a detailed example is provided in the blog post, How to set up CloudWatch Anomaly Detection to set dynamic alarms, automate actions, and drive online sales.
- After the alarm has been created for the service provider’s VPC Endpoint Service, the alarm for ActiveConnections is in an OK state. This is shown in the following screenshot (figure 3).

Figure 3
- If the ActiveConnections metric exceeds the Anomaly Detection band for the configured threshold, the Alarm goes into an In alarm state, and publishes a message to a Simple Notification Service (SNS) topic, to notify service provider contacts. This is shown in the following screenshot (figure 4).

Figure 4
- Service provider contacts responding to the alarm can find the alarm’s graph indicates the ActiveConnections metrics for the VPC Endpoint Service. This is shown in the following screenshot (figure 5).
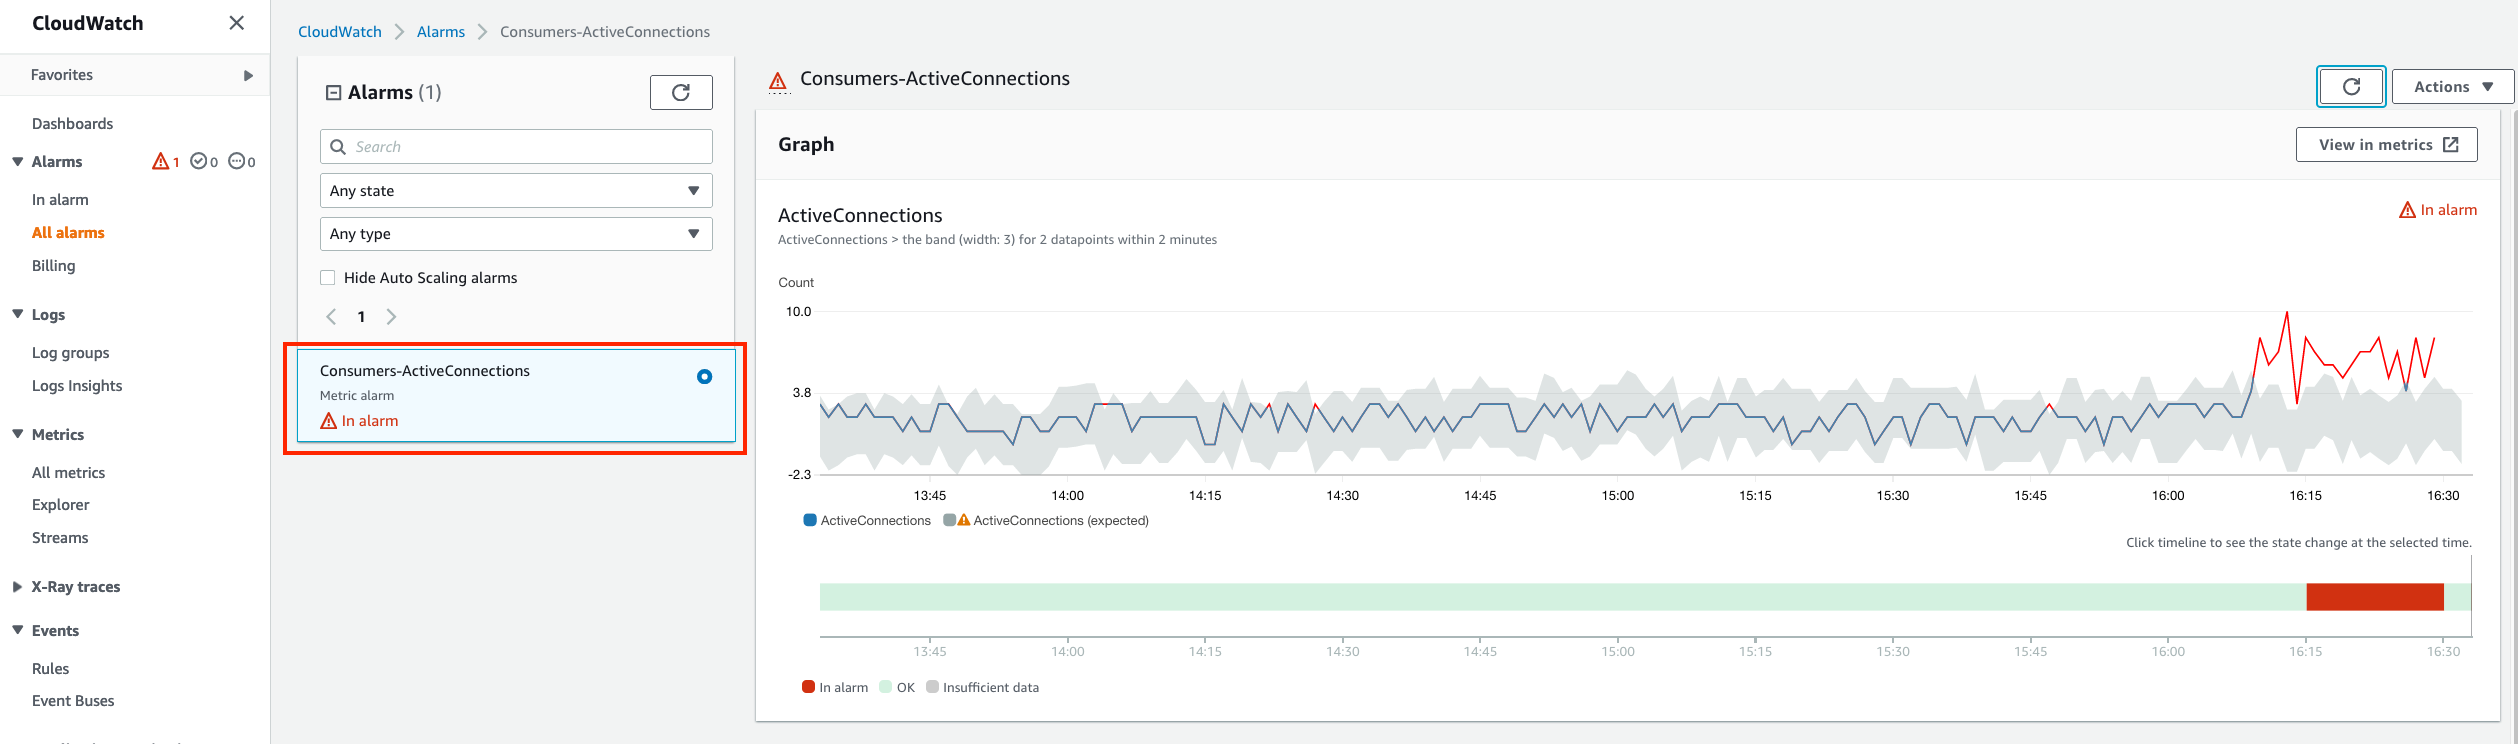
Figure 5
Service providers whose VPC Endpoint Services are consumed by many consumers can create Contributor Insights rules to show the top VPC Endpoints for each metric. CloudWatch Contributor Insights uses data from VPC Endpoint Services’ CloudWatch metrics to present one view of the most active VPC Endpoints, and is shown in Figure 6: CloudWatch Contributor Insights for PrivateLink services. When you enable this feature, you are charged per-rule per-month evaluating up to 50,000 endpoints. For more information on AWS PrivateLink Contributor Insights pricing, refer to Amazon CloudWatch pricing. Following the same example, Contributor Insights can determine which VPC Endpoint has a spike in active connections.
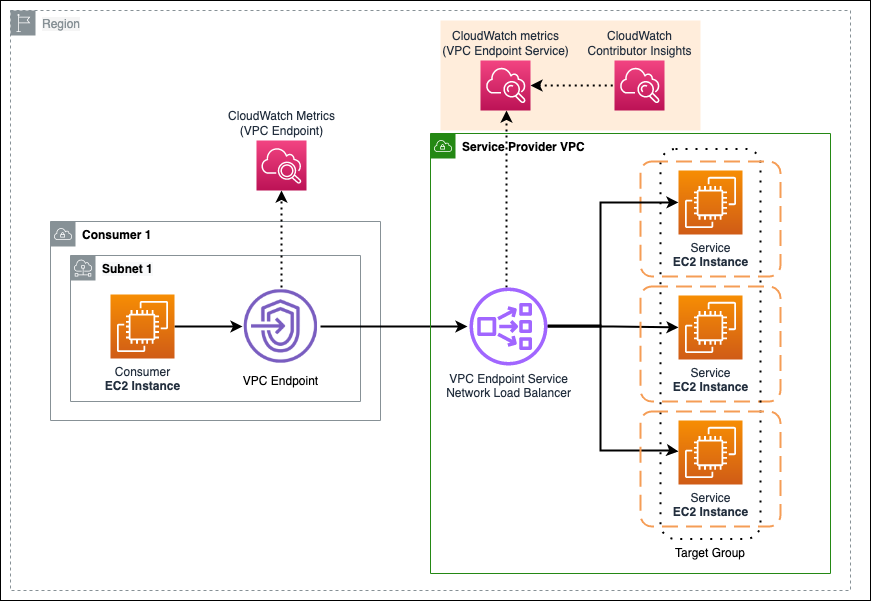
Figure 6: CloudWatch Contributor Insights for PrivateLink services
To enable Contributor Insights, follow these steps.
- Navigate to Endpoint Services in the VPC console.
- Choose the VPC Endpoint Service you want to monitor.
- Choose the Contributor Insights tab.
- Choose Enable all and confirm.
- Under the Contributor Insights tab of your VPC Endpoint Service, you can view the top contributors for each metric.
- For the ability to toggle between the top 10, 25, 50, or 100 contributors, navigate to Contributor Insights in the CloudWatch console.
In this example, the ActiveConnections metric is spiking, and the top contributor needs to be identified. To do this, follow these steps.
- Navigate to Endpoint Services in the VPC console.
- Choose the VPC Endpoint Service you want insight into.
- Choose the Contributor Insights tab.
- Choose the VpcEndpointService-ActiveConnectionsByEndpointId rule and view the VPC Endpoint Service’s graphed metrics from all three consumers’ VPC Endpoints. In this example, VPC Endpoint Id vpce-0f38 is responsible for the spike in active connections. This is shown in the following screenshot (figure 7).

Figure 7
- The service provider can investigate the active connection spike, and optionally reject this consumer’s VPC Endpoint, from the Endpoint connections. This is shown in the following screenshot (figure 8).
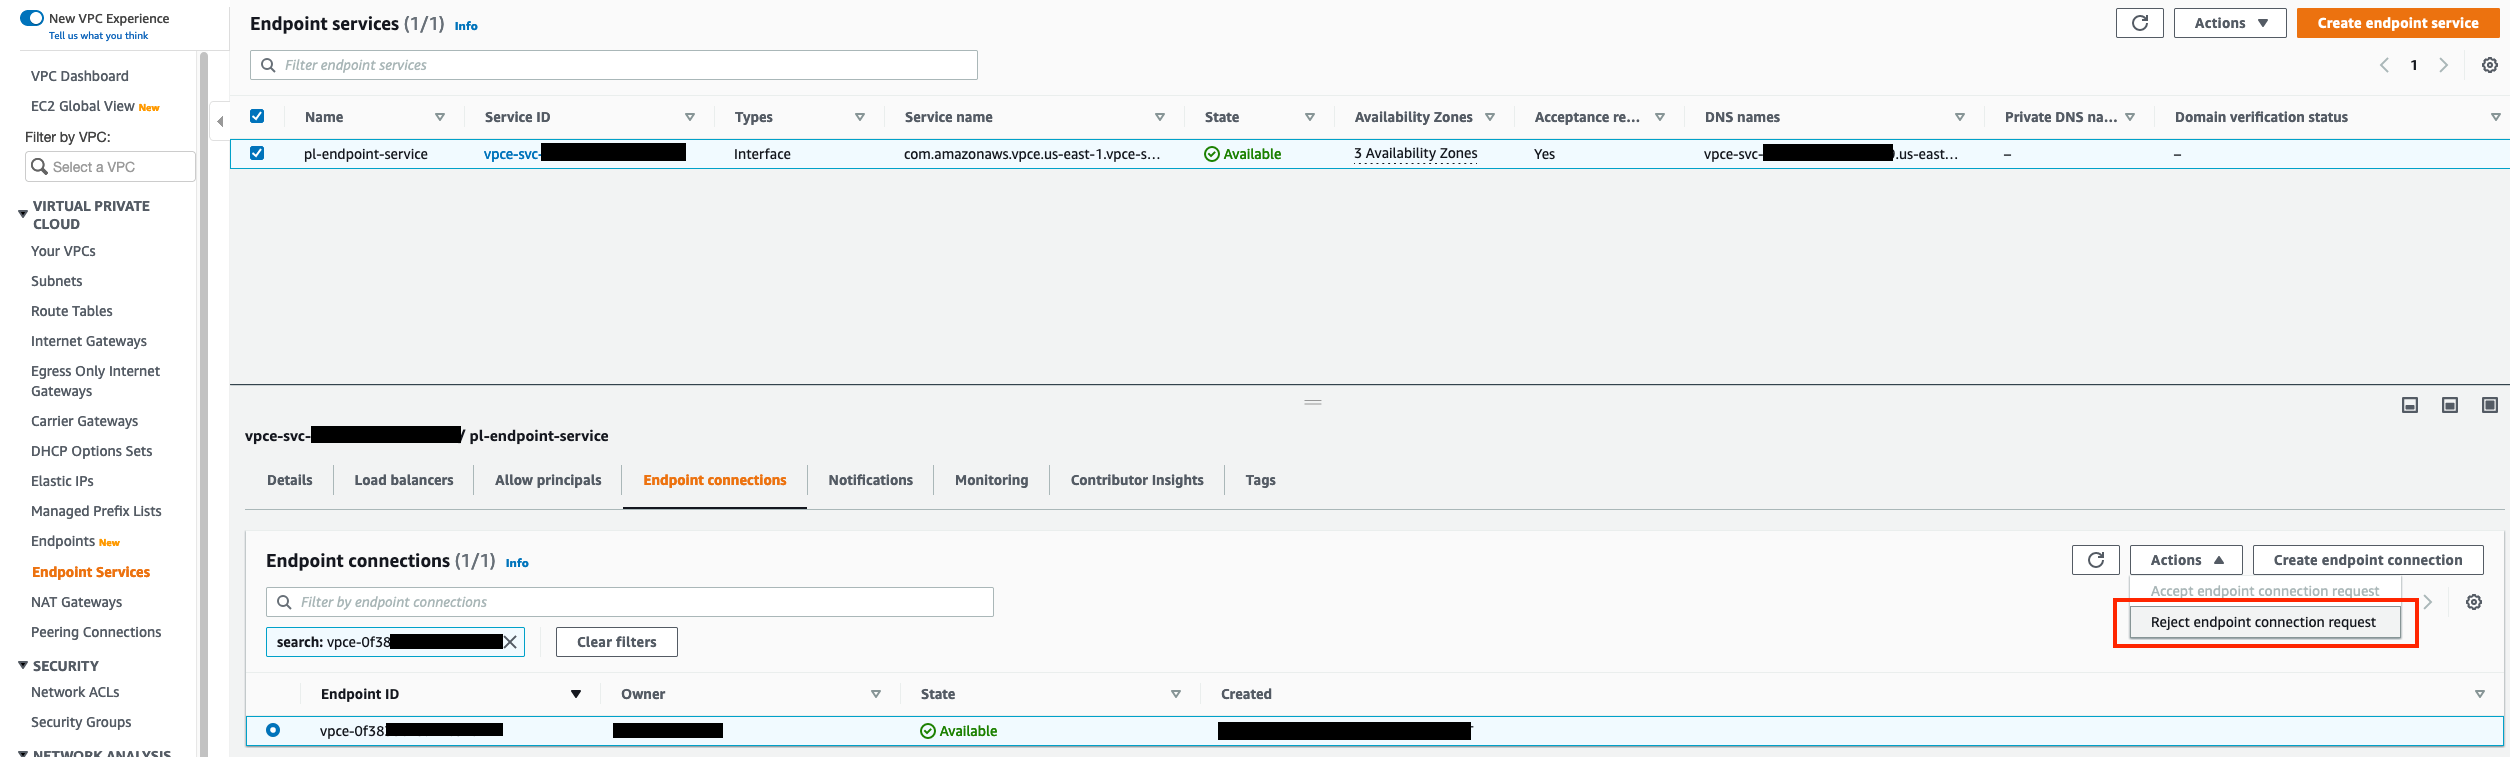
Figure 8
VPC Endpoint CloudWatch metrics
You can view the following VPC Endpoint metrics under the Monitoring tab of each VPC Endpoint in the VPC console.
- Navigate to Endpoints in the VPC console.
- Choose the VPC Endpoint you want to monitor.
- Choose the Monitoring tab.
You can also view these metrics under the AWS/PrivateLinkEndpoints namespace in the CloudWatch console. This namespace contains metrics from all Interface endpoints and GWLB endpoints receiving traffic.
- Navigate to All metrics in the CloudWatch console.
- Choose the AWS/PrivateLinkEndpoints namespace.
- Choose the metric names you want to view.
- Choose the metrics you want to graph. In the Metrics pane, you can also search based on the metrics, dimensions, or resource id.
| Metric Name | Description |
| ActiveConnections | Number of concurrently active flows through the PrivateLink endpoint. |
| NewConnections | Number of new flows established through the PrivateLink endpoints. |
| BytesProcessed | Aggregated number of bytes exchanged (in both directions) between the endpoint and the PrivateLink service. This is the number of bytes the consumer is billed for. |
| PacketsDropped | Aggregated number of packets dropped by the endpoint during ingress and egress. |
| RstPacketsReceived | Number of RST Packets received from the service. |
You can filter the metrics in the preceding table on the following dimensions. The filters are useful for narrowing down search results in scenarios, like when one or more VPC Endpoint(s) in one or more VPC(s).
| Filter Dimensions | Description |
| Endpoint Type | Interface or GWLB |
| VPC Id | VPC Endpoint’s VPC Id |
| Service Name | PrivateLink service Name |
| VPC Endpoint Id | PrivateLink endpoint Id |
| Subnet Id | Subnet Id |
Example: Identifying unused VPC Endpoints
This example explains how you can use PrivateLink endpoint metrics to identify unused VPC Endpoints which you can investigate cleaning up.
AWS recommends customers achieve segmentation of resources by organizing workloads across multiple AWS accounts. Customers often accomplish this through automation at the time of a new project’s conception. If you are spinning up the VPCs in new AWS accounts for a new project, it is likely you are deploying a standard set of VPC Endpoints, or choosing what you think you will need based on specifications determined by the project’s unique needs.
With this approach, customers need a means to monitor usage of VPC Endpoints within their AWS account and clean up resources which are not being used. Until today, customers had to monitor traffic to the VPC Endpoints’ Elastic Network Interfaces within VPC flow logs, which is time-consuming and requires additional overhead. Amazon CloudWatch metrics for AWS PrivateLink can help customers clean up unnecessary resources and ensure the workload can only access services administrators intended for the workload to use.
The services covered in this example are highlighted in Figure 9: CloudWatch metrics for PrivateLink endpoints. In this example, end users and services with access to this VPC can access some services using VPC Endpoints. The VPC Endpoints are emitting metrics to CloudWatch when they receive traffic. The VPC has many VPC Endpoints, and usage data can show whether they are being used or if they are not needed.
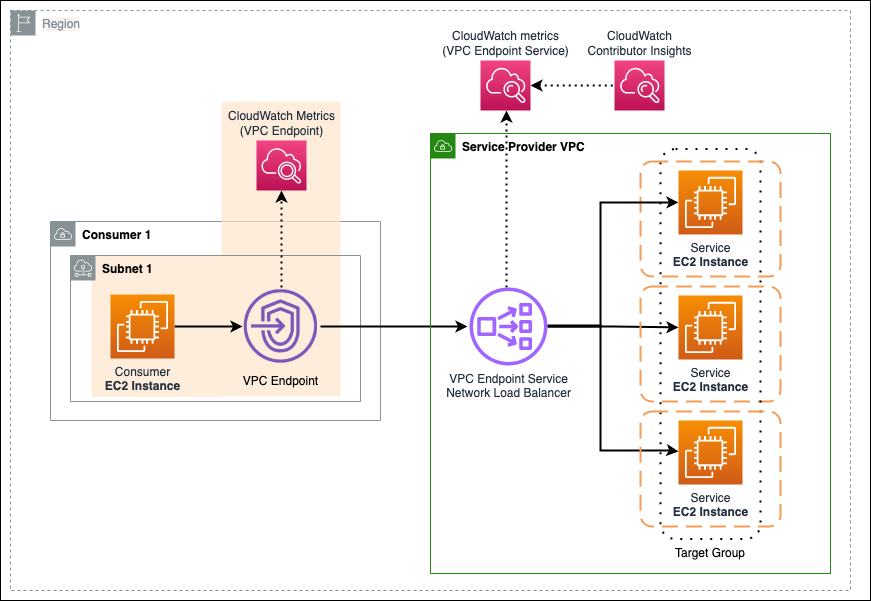
Figure 9: CloudWatch metrics for PrivateLink endpoints
In this example, VPC Endpoint CloudWatch metrics (or lack thereof) identify unused resources. In your environment, you may have hundreds of VPCs with hundreds or thousands of VPC Endpoints.
- Navigate to Endpoints in the VPC console.
- This will provide a list of all VPC Endpoints in this AWS Region. If you are investigating a single VPC, you can filter based on the VPC Id. This provides you a list to cross-reference after looking at the PrivateLinkEndpoints CloudWatch metrics.
- Next, navigate to All metrics in the CloudWatch console.
- Choose the AWS/PrivateLinkEndpoints namespace.
- Choose Endpoint Type, Service Name, VPC Endpoint Id, VPC Id.
- Choose a time-based filter, and view the ActiveConnections metric to find the VPC Endpoints with usage during this period. If you are investigating a single VPC, you can filter by VPC Id.
In this example, the graph of a VPC’s ActiveConnections over a one-week duration shows two VPC Endpoints have had connections. The VPC Endpoint vpce-03fa consistently had one connection, and the VPC Endpoint vpce-09e0 had a spiky number of short-lived connections. This is shown in the following screenshot (figure 10).

Figure 10
In this example, our VPC has VPC Endpoints other than the two graphed endpoints which are not present in CloudWatch, meaning they have had no connections since PrivateLink began producing CloudWatch metrics. Investigation with this VPC’s users confirms the unused VPC Endpoints are not needed, can be removed, and once removed will no longer incur a cost.
We can periodically check for unused VPC Endpoints. If they are not present in CloudWatch, or if they are present in CloudWatch but have had no connections in the past week, the endpoints may be candidates for deletion.
Note: Ensure you are mindful when removing endpoints, as a misconfiguration could cause an outage for your end users and services.
Conclusion
AWS PrivateLink metrics and filters are now available in Amazon CloudWatch, and can help you make more data driven decisions. This blog provided a feature overview, described customer use cases, provided detail on the metrics and filtering dimensions, and explained how AWS PrivateLink metrics are used in two common scenarios. You can get started with PrivateLink CloudWatch metrics for your VPC Endpoints and VPC Endpoint Services in the AWS management console. To learn more about AWS PrivateLink, please refer to the Amazon Virtual Private Cloud AWS PrivateLink guide.

Ken Howard
Kenneth “Ken” Howard is a Solutions Architect at AWS based out of Pittsburgh, Pennsylvania. He is passionate about solving complex business problems through gold-standard architectures and processes. In his spare time, you can find Ken spending time with his wife, daughter, and pack of dogs, while singing along to some good ol’ Reba McEntire.

Raju Rangan
Raju Rangan is a Senior Solutions Architect with AWS based out of New York. Raju joined AWS in 2019 and works with intergovernmental organizations to design and develop architectures on AWS, and support their journey on the cloud.

Blayze Stefaniak
Blayze Stefaniak is a Senior Solutions Architect for the Technical Strategist Program supporting Executive Customer Programs in AWS Marketing. He has experience working across industries including healthcare, automotive, and public sector. He is passionate about breaking down complex situations into something practical and actionable. In his spare time, you can find Blayze listening to Star Wars audiobooks, trying to make his dogs laugh, and probably talking on mute.