AWS Cloud Operations Blog
How to set up CloudWatch Anomaly Detection to set dynamic alarms, automate actions, and drive online sales
In this post, I introduce you to Anomaly Detection in Amazon CloudWatch. I provide a step-by-step tutorial on how to create Anomaly Detection alarms that are dynamic, so you can automate actions such as placing items on sale if retail orders drop below an expected baseline.
Why Anomaly Detection in Amazon CloudWatch?
Amazon CloudWatch is a monitoring and management service that collects operational data as logs, metrics, and events. It gives you a unified view of AWS resources, applications, and services that run on AWS and on-premises servers. You can use CloudWatch to set alarms, visualize logs and metrics side by side, and take automated actions. This helps you troubleshoot issues and discover insights to optimize your applications and ensure they are running smoothly.
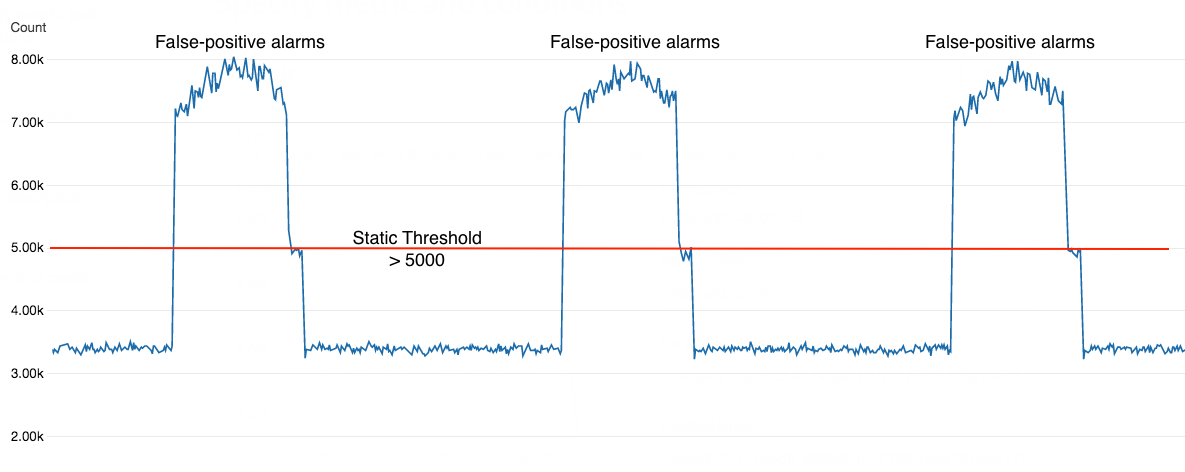
You can set up alarms for a metric by selecting a threshold value in which to invoke a set of actions. Setting a fixed threshold value is known as a static threshold, which may meet your needs. Applications that exhibit organic growth or seasonal behavior, such as peak traffic during the day that tapers off at night, are difficult to monitor using static thresholds. If the threshold is too broad, it may not detect unusual behavior. In this situation, most people resort to creating tighter and tighter thresholds, and end up with a large number of false-positive alarms over time.
Anomaly detection is a technique that identifies data points, events, or observations that do not conform to a typical pattern or expected behavior. In contrast to static alarms, Anomaly Detection alarms produce a “confidence band” which represents the normal range of values for the metric. You can set up an alarm based on this normal pattern such as “Outside the band”, “Greater than the band” or “Lower than the band”. The alarm is based on a prediction value which continues to adapt to your system. You no longer have to manually adjust your static alarms to reduce false positives or reset their threshold values as your metric data changes. This is very helpful when you lack the time and resources to closely learn each metric and manage each threshold.

CloudWatch Anomaly Detection feature applies machine learning to the metric data it collects. It continuously analyzes your system, learns the normal baseline of your applications, and surfaces anomalies in their behavior. With CloudWatch Anomaly Detection, you can set up an alarm that can adapt to metric trends as well as the dynamic nature of system and application behavior such as time-of-day utilization peaks without requiring user intervention.
CloudWatch Anomaly Detection provides the following capabilities:
- Learn and model the expected behavior of a metric based on prior data.
- Calculate expected values and and generates the Anomaly Detection band. This is based on a lower and an upper band metric generated by the model. Metric values that fall outside the predicted confidence band are considered anomalies.
- Enable you to create alarms based on the Anomaly Detection band and remediate detected anomalies.
- AWS API support (CLI and SDKs).
- AWS CloudFormation support.
Tutorial
Now let’s look at how you can use CloudWatch Anomaly Detection to learn the purchasing behaviors of an online sales item. I will demonstrate how you can create “one-time” alarms with thresholds that will continue to work based on the dynamic nature of the sales item gaining or losing popularity. These alarms will be used to increase an item’s visibility and even place the item on sale if total number of orders drops below an expected baseline. Inversely, as sales increase above our expected baseline, we will use an alarm to return the price of the item to its original retail price. The power of using anomaly detection in this way is that you only need to set the alarms and thresholds one time even though the data for the metric you are collecting changes dynamically.
Getting started
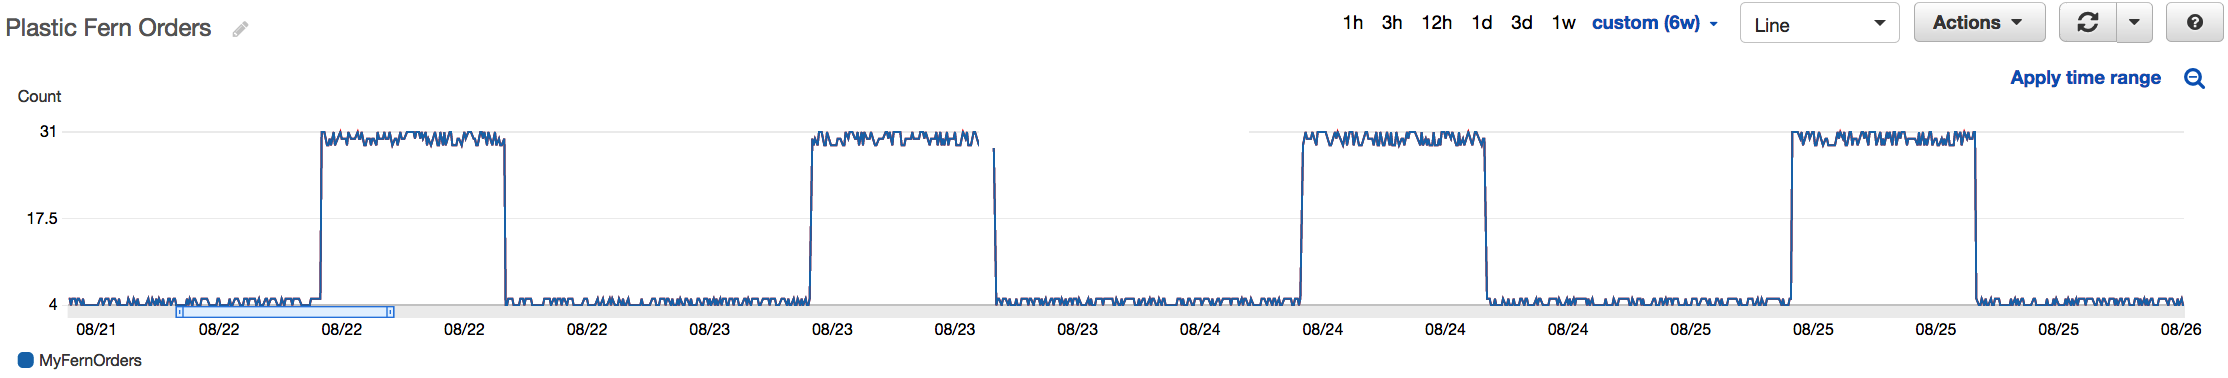
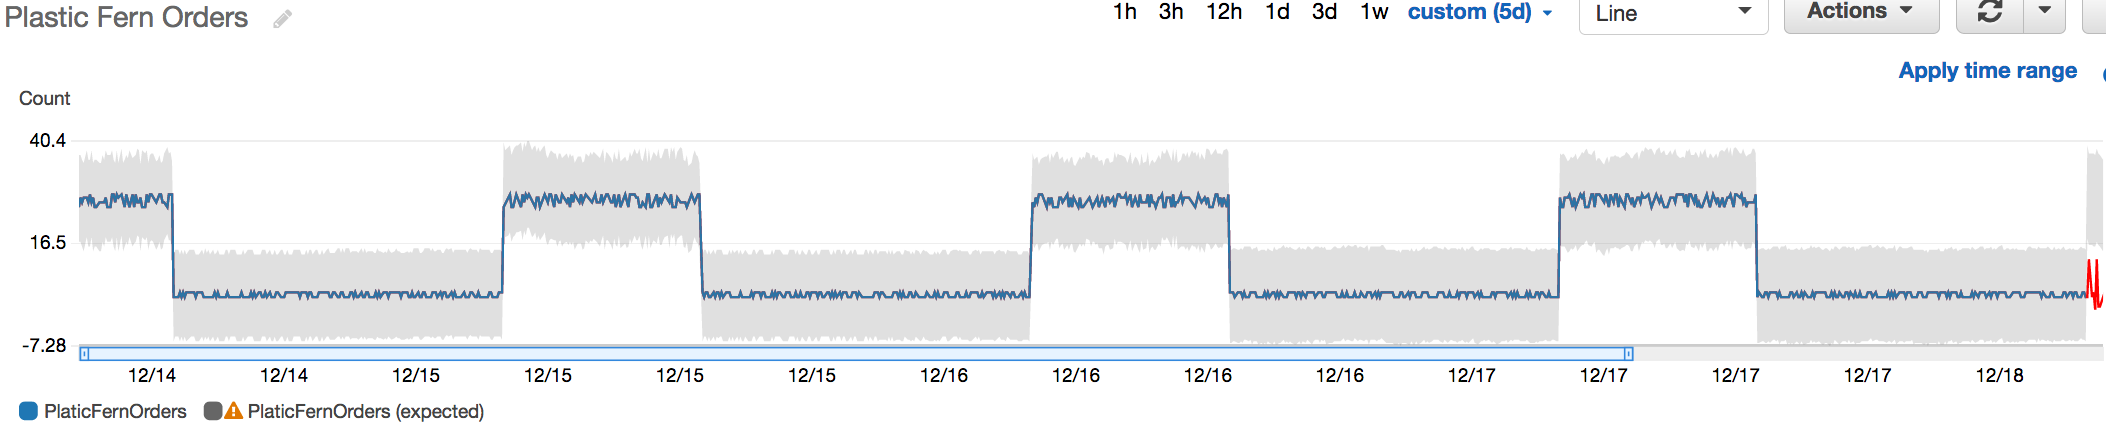
In the Amazon CloudWatch console, select Metrics, choose your metric, and select the “Graphed metrics” tab. In this example, we are looking at the the total number of “Plastic Fern Orders” that happen in a 5 minute period. These lovely plastic green ferns are selling like hot cakes at an average count of ~29 units every 5 minutes between 9AM and 5PM daily.
To enable Anomaly Detection on the metric you select the “anomaly detection” icon of your graphed metric as seen below.

Anomaly Detection uses up to two weeks of historical data for training. For the best result, at least three days of data is recommended. The model learns from your “normal” data, so it can only be as good as as the data provided. When you create the model, you have option to exclude the “abnormal” time ranges from the training data. You can also exclude a known event such as performance testing in advance. For more information on how it works and supported patterns, see the documentation on using CloudWatch Anomaly Detection.
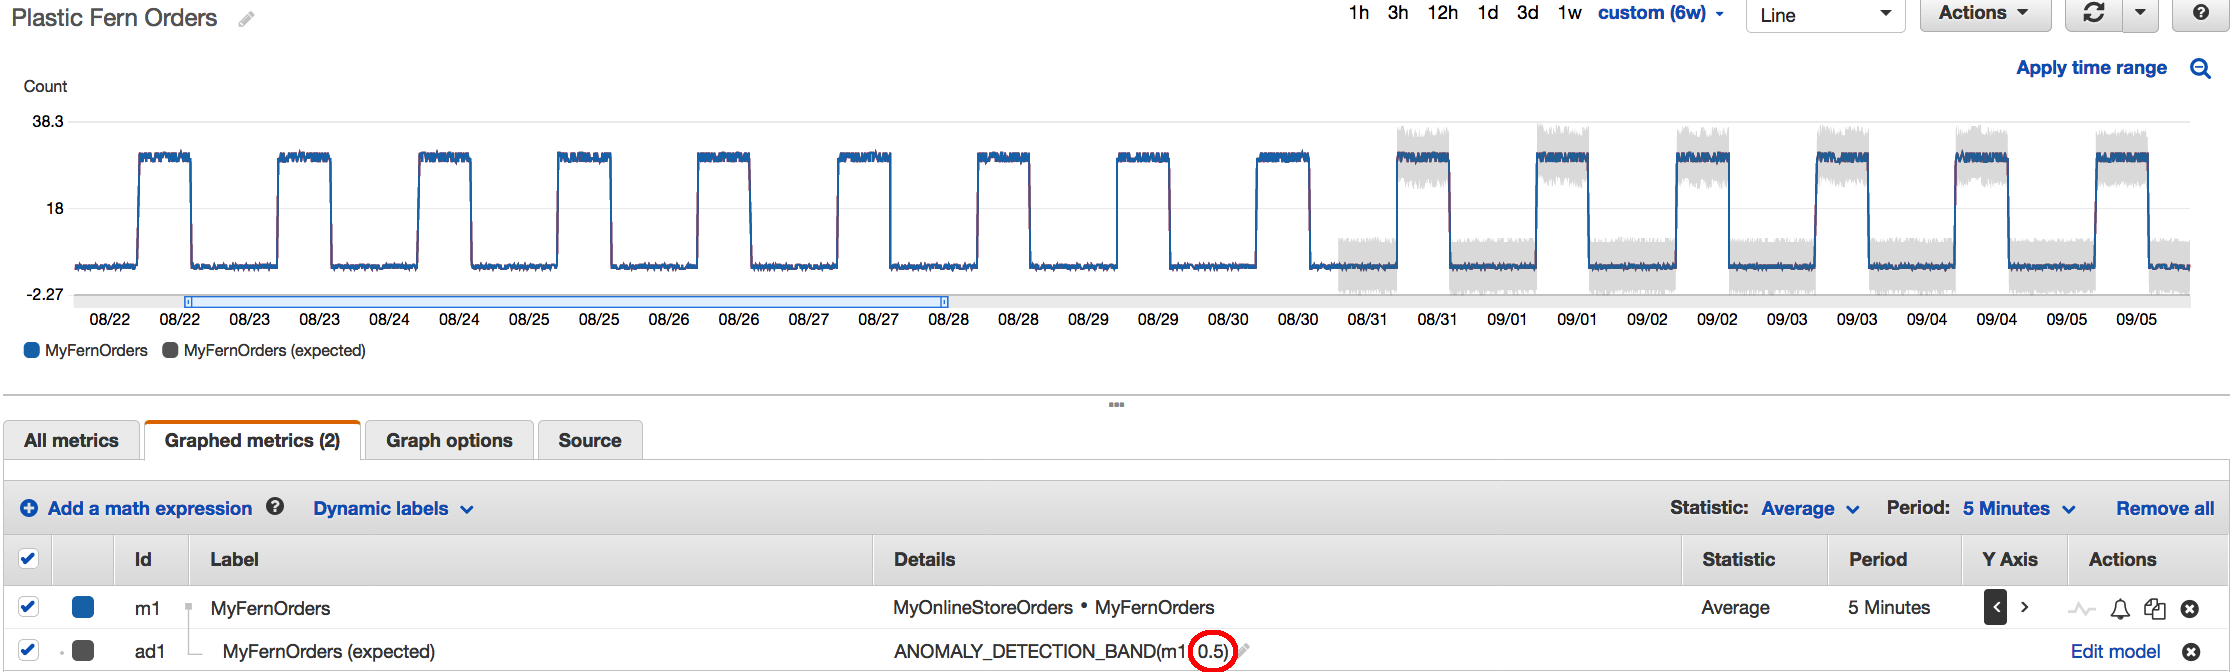
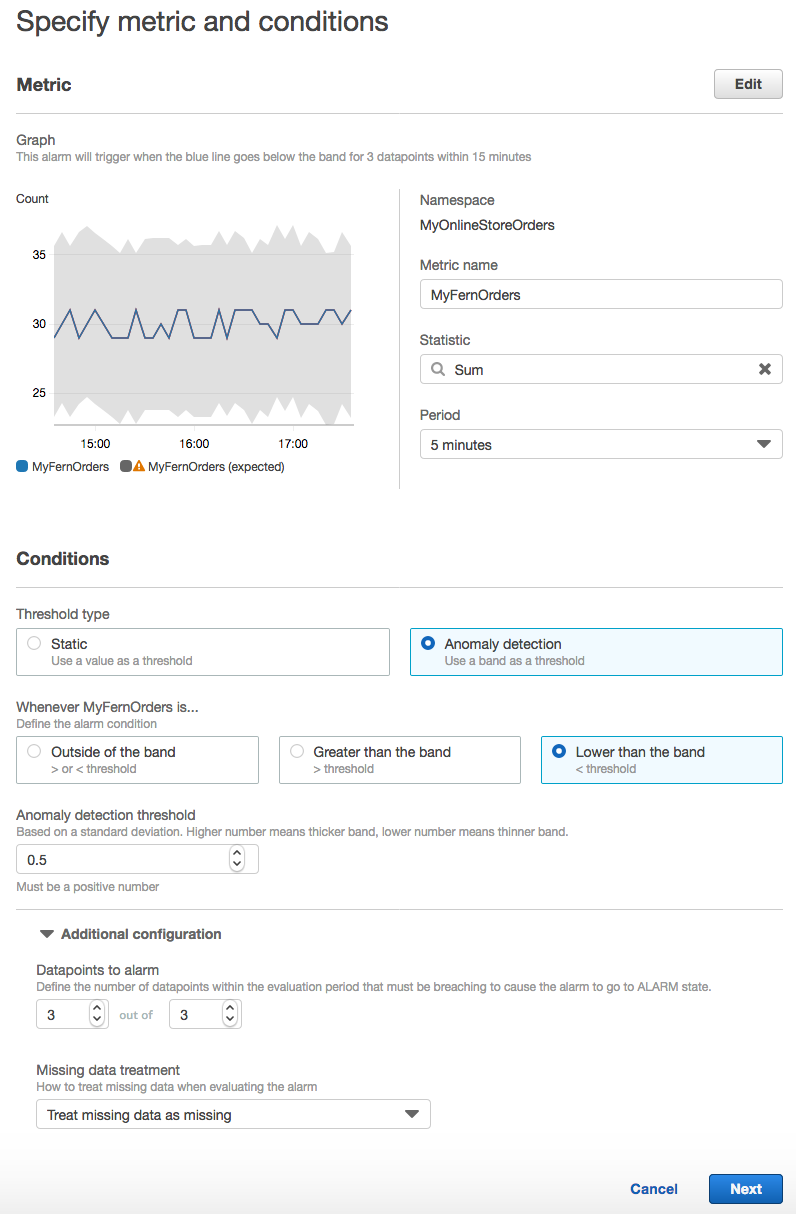
After you enable anomaly detection, the service will produce confidence bands based on your data. The Anomaly Detection confidence band represents a range of acceptable values between a high and a low value for any given data point based on the model that learns your data’s behavior. You can specify an anomaly detection threshold that CloudWatch will use with the model to determine the “normal” range of values for the metric. A larger number produces a thicker band increasing the range of expected behavior. In the figure below, I have chosen 0.5 which decreases the range of expected behavior creating a narrower confidence band for greater precision.
For this example, we will monitor the fern orders. We will set it such that if the number of orders drops below the lowest value in the confidence band for three data points within 15 minutes, then we will post an alert to a SNS topic that will invoke a AWS Lambda function to update the fern item within the DynamoDB table, making it one of the top 10 products on the online store homepage as well as discount the retail price in an effort to increase orders for the item.
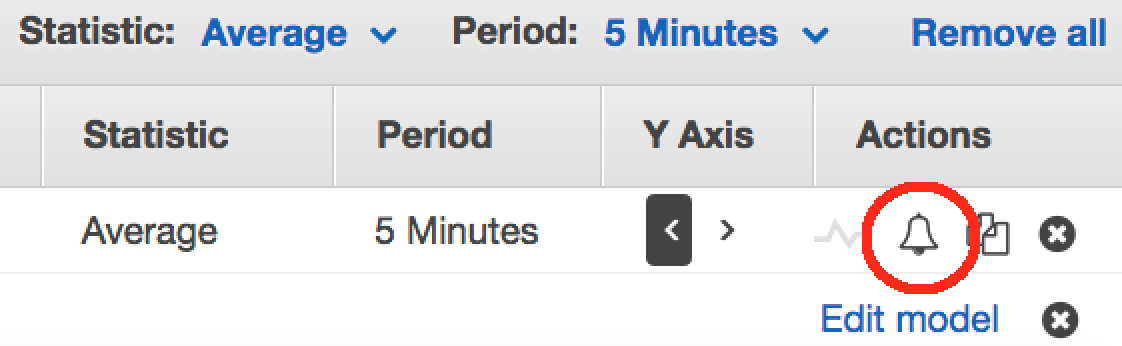
While viewing your metric with anomaly detection enabled in CloudWatch, select the bell icon to configure an alarm.
Here I have chosen the MyFernOrders metric and have chosen “Anomaly Detection” and “Lower than the band” with a period of 5 minutes, and set the “Datapoints to alarm” to a value of 3 out of 3.
We will now configure the alarm to send a notification to a predefined SNS topic that a Lambda function is subscribed to.

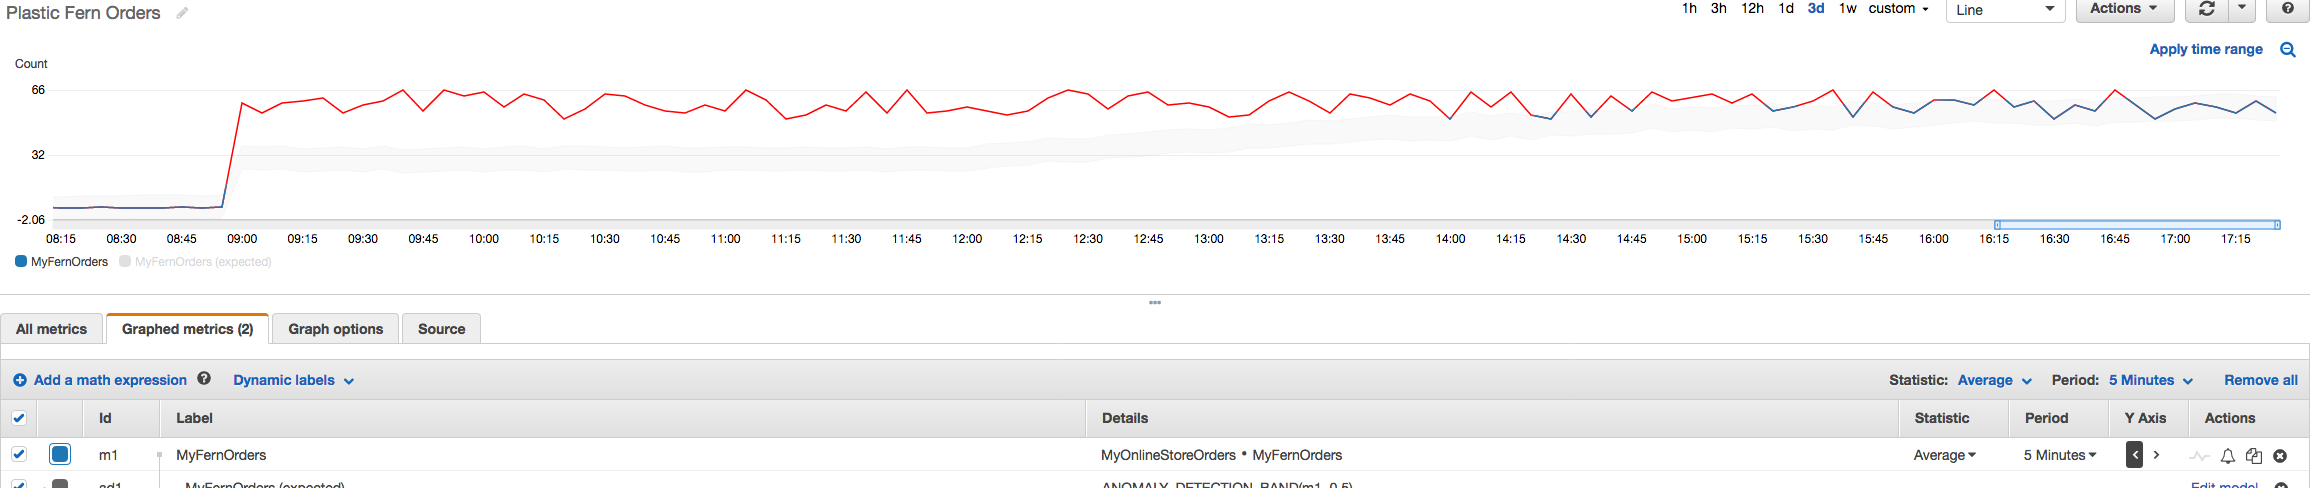
We can see in the graph below that as the start of the business day begins at 9AM UTC, sales orders have dropped with an average order count of 15 ferns every 5 minutes, which is below the confidence band determined from our historical metrics collection. Also note, the model will continue to learn from the change in incoming data and the confidence band starts to decrease toward the incoming orders as these become the new norm.
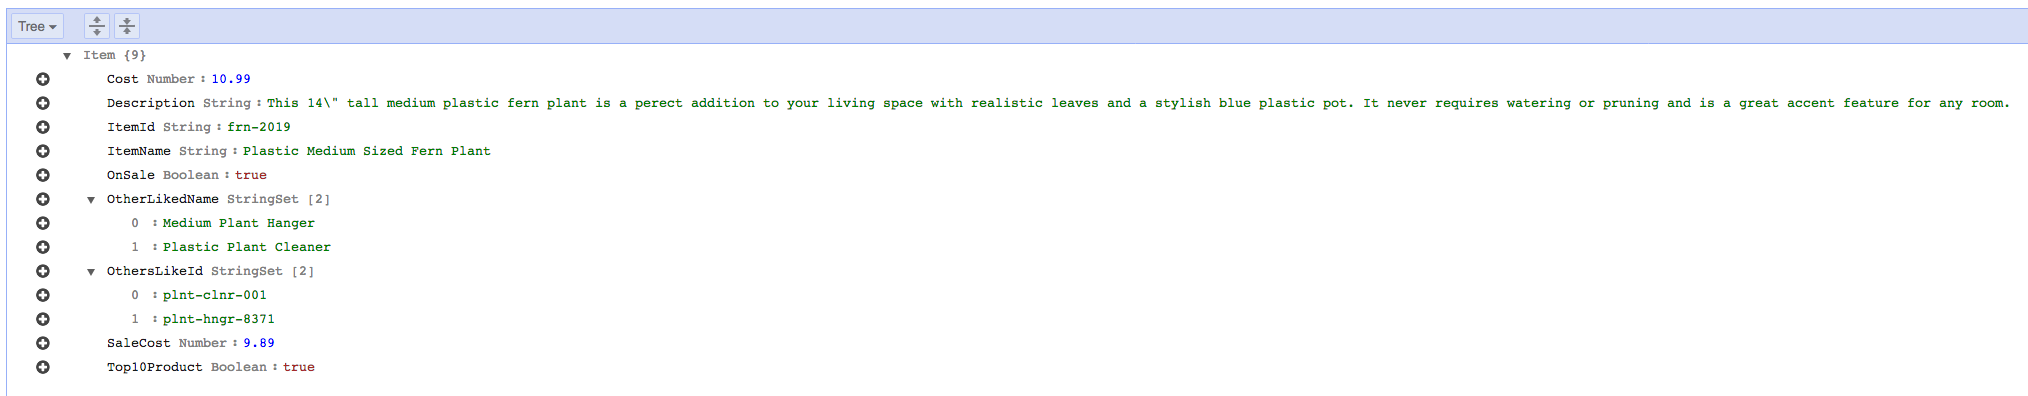
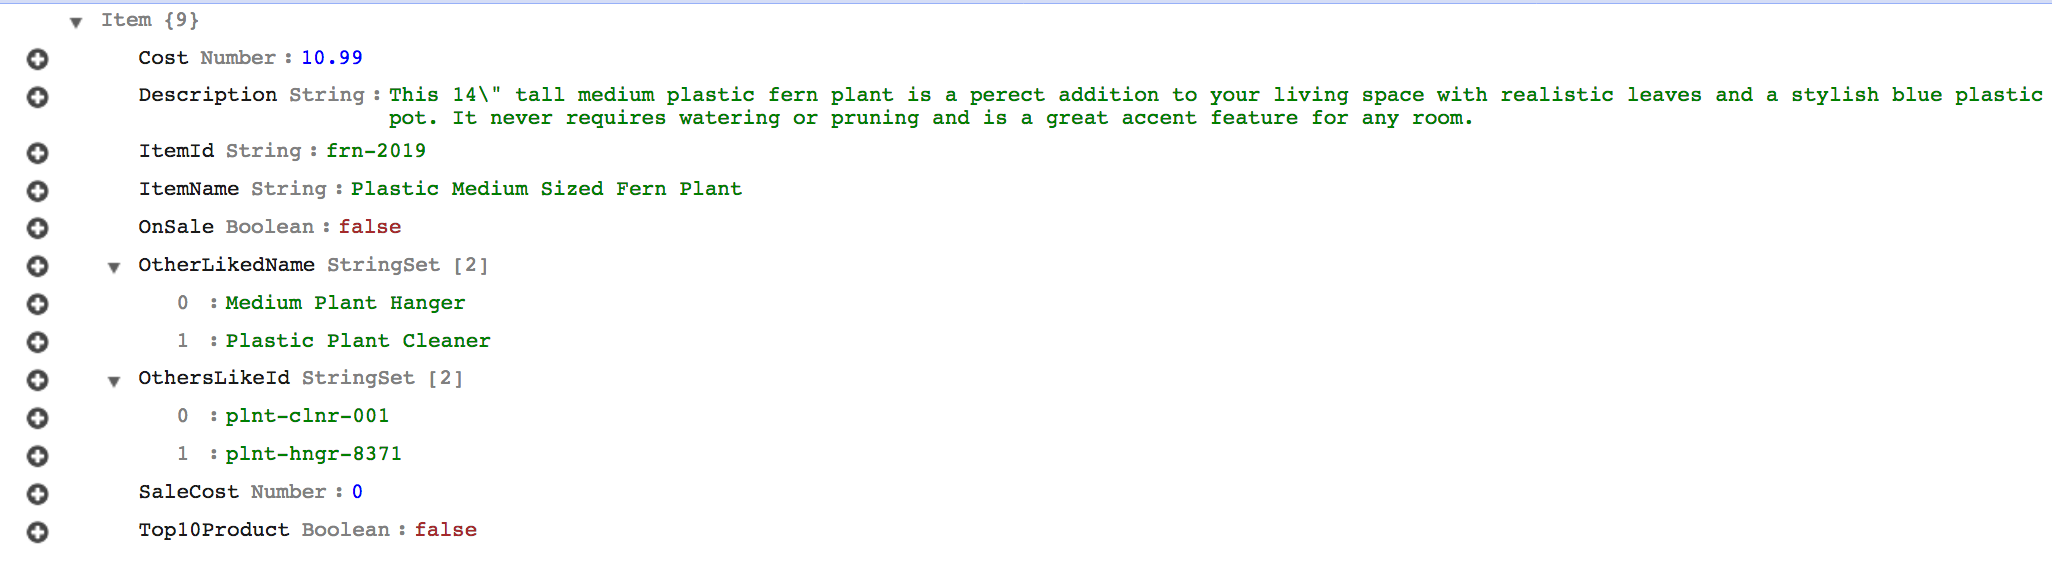
When the alarm is triggered it invokes our Lambda function. The Lambda function updates the fern item in the DynamoDB table setting the “Top10Product” flag to true; as seen in the figure below. This flag could be used to allow the item to be displayed on both the online store’s home page and side bar ads on your favorite social media sites and mobile applications. It also discounts the item price by 10% to attract more online sales. You can see the changes to the fern entry in DynamoDB here.
Now that the item is more visible to buyers and on sale for a discounted price. In viewing the figure below from the CloudWatch metric, you can see that the item’s popularity with shoppers has grown as the orders have continued to increase above the confidence band.
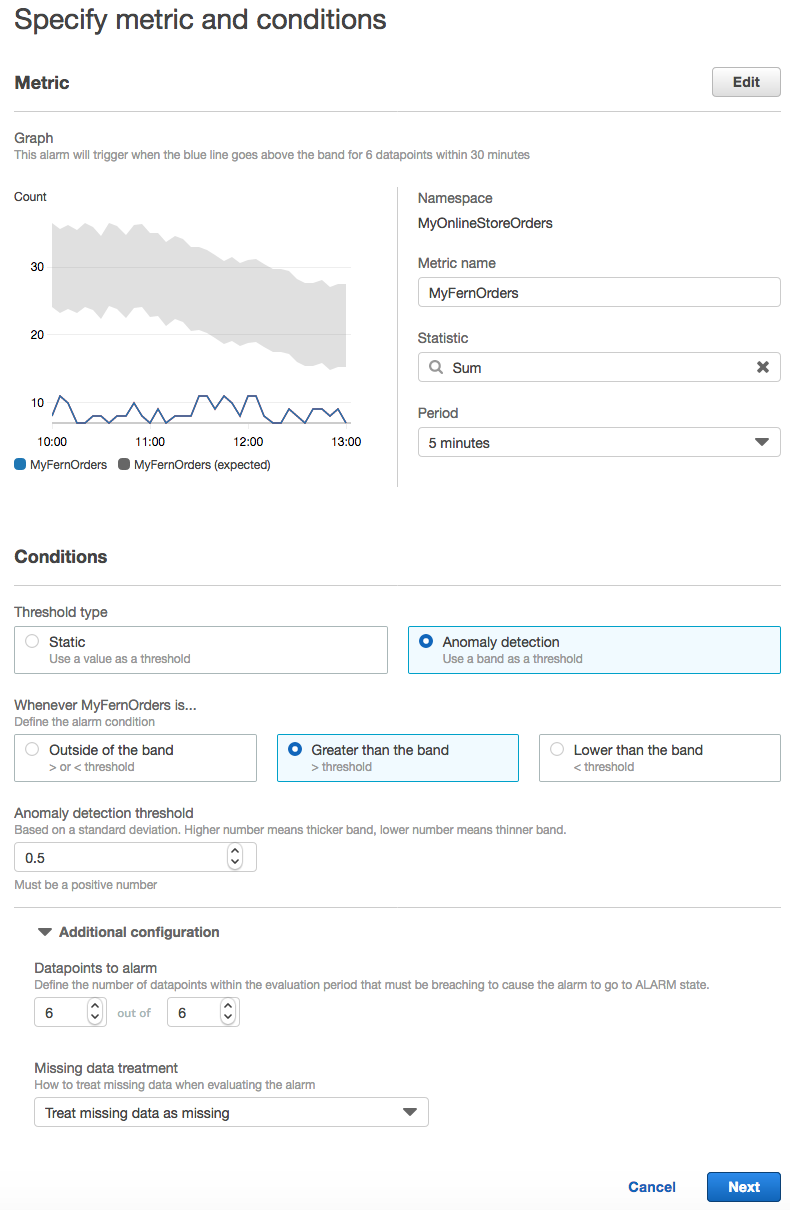
Finally, we should take the item “off sale” and remove it from the 10 product page once we find an anomaly above the confidence band. We can configure another alarm for the same metric and use Anomaly Detection, but change both the period and number of data points to alarm on. We set the period to 5 minutes and the data points to 6, which will alarm if orders counts above threshold for 6 consecutive data points over 30 minutes. Using “Greater than the band” allows us to trap a continuous and large increase in the amount of orders above the confidence band.
Just as before, the alarm is configured to send a notification via SNS where a Lambda function will be invoked to update the item in the DynamoDB table. This removes the item from being on sale and also removes it from the 10 products selection, in hopes that order counts maintain.
Summary and next steps
In this tutorial, we enabled Anomaly Detection for a metric on plastic fern orders from our online store. We then set an alarm that identifies orders that are below the confidence band. This is determined by the Anomaly Detection model, which has learned expected behavior from historical fern order data.
The alarm triggers a Lambda function that changes the data about the fern product, helping drive more orders by increasing the item’s visibility as well as reduced the sale price of the item. We then created another alarm that watches the order counts and if they rise above the confidence band for a determined amount of time, a Lambda function then updates the DynamoDB table reducing the items visibility and returns the item to its original sale price. As the data changes and alarms are triggered, the model will continue to learn and apply the alarms based on the confidence band. This allows you to focus only on addressing behaviors outside of expected behavior. You no longer have to set and adjust alarm thresholds to yield the results you want from unexpected fluctuations in your incoming data.
To learn more about CloudWatch Anomaly Detection, see the documentation. Please contact anomalydetectionfeedback@amazon.com for any feedback, questions, or if you would like to be informed when updates are available.
About the Author

|
|
Siri
 rat Kongdee is a Sr. Solutions Architect at Amazon Web Services. She loves working with customers and helping them remove roadblocks from their cloud journey. She enjoys traveling (whether for work or not) as much as she enjoys hanging out with her pug in front of the TV. rat Kongdee is a Sr. Solutions Architect at Amazon Web Services. She loves working with customers and helping them remove roadblocks from their cloud journey. She enjoys traveling (whether for work or not) as much as she enjoys hanging out with her pug in front of the TV.
|