AWS Open Source Blog
Argo CD Application Controller Scalability Testing on Amazon EKS
As more customers adopt Kubernetes and GitOps for their delivery of containerized applications, we at AWS are witnessing growing interest in understanding and operating GitOps platforms at scale. Argo CD is a popular Cloud Native Computing Foundation (CNCF) application delivery tool that runs on Kubernetes. Customers often inquire about the number of applications and clusters that Argo CD can manage, associated resource requirements for the Argo CD controllers, and configuration knobs that can be tuned to help users get the best out of their Argo CD deployments on Amazon Elastic Kubernetes Service (Amazon EKS).
In an effort to help our customers better utilize their Argo CD deployments, we have started working with the Argo CD open source community to better understand and address the scalability requirements of Argo CD. Our work includes co-founding the special interest group (SIG) for scalability in the open source Argo community with Akuity, Intuit, and Red Hat, as well as running large scale scalability tests to push the limits of Argo CD. In this blog post, we build on the previous work in the industry and present our findings with several experiments of deploying 10,000 Argo CD applications to 1, 10, and 97 remote clusters. We discuss our observed scalability bottlenecks, modifications that we had to make, and improvements we saw in our efforts to scale Argo CD on any Kubernetes cluster, including Amazon EKS.
Background
As discussed earlier, Argo CD is an open source delivery tool from the CNCF that enables users to apply GitOps principles to their application deployments. In our previous blog posts, we have extensively discussed GitOps principles and utilization of CNCF tools such as Argo CD, Flux, and Spinnaker ([1], [2], [3]) to spin up applications. However, for the purpose of discussing scalability details for Argo CD, we will briefly review the internals of Argo CD and the roles its different components play in application and infrastructure delivery, prior to discussing how to best scale them.
Argo CD has three main components: the repository server, the application controller, and the API server. The three resources are depicted in Figure 1.
- The repo server connects to the git source, clones the repository, and extracts application manifests prior to deployment.
- The application controller is in charge of actively reconciling the actual state of the world (i.e. what is deployed to the target Kubernetes clusters) with the desired state of the world (i.e. the manifests pulled by the repo server from the git repository)
- The API server is the bridge between the end user and the internals of Argo CD, presenting the variation between the actual and the desired states of the world, allowing users to observe the health of the deployments, and enabling users to re-trigger custom synchronizations.
Also, as shown in Figure 1, each of the primary components of Argo CD emits Prometheus metrics. These metrics can be observed while tuning certain configuration knobs to improve the load that each Argo CD component can handle. This includes modifying the number of concurrent processes operating on the request queues, number of controller instances, reconciliation frequency, and client qps limits.
Scalability of an Argo CD deployment is a function of how all of these configuration options are tweaked in harmony. The goal of this tuning is to ensure that the Argo CD application controller can manage the maximum number of requests in a given period of time. In the following section, we discuss the specific measurements we took with changing each and every one of these parameters and the impacts we noticed when scaling Argo CD on Amazon EKS.
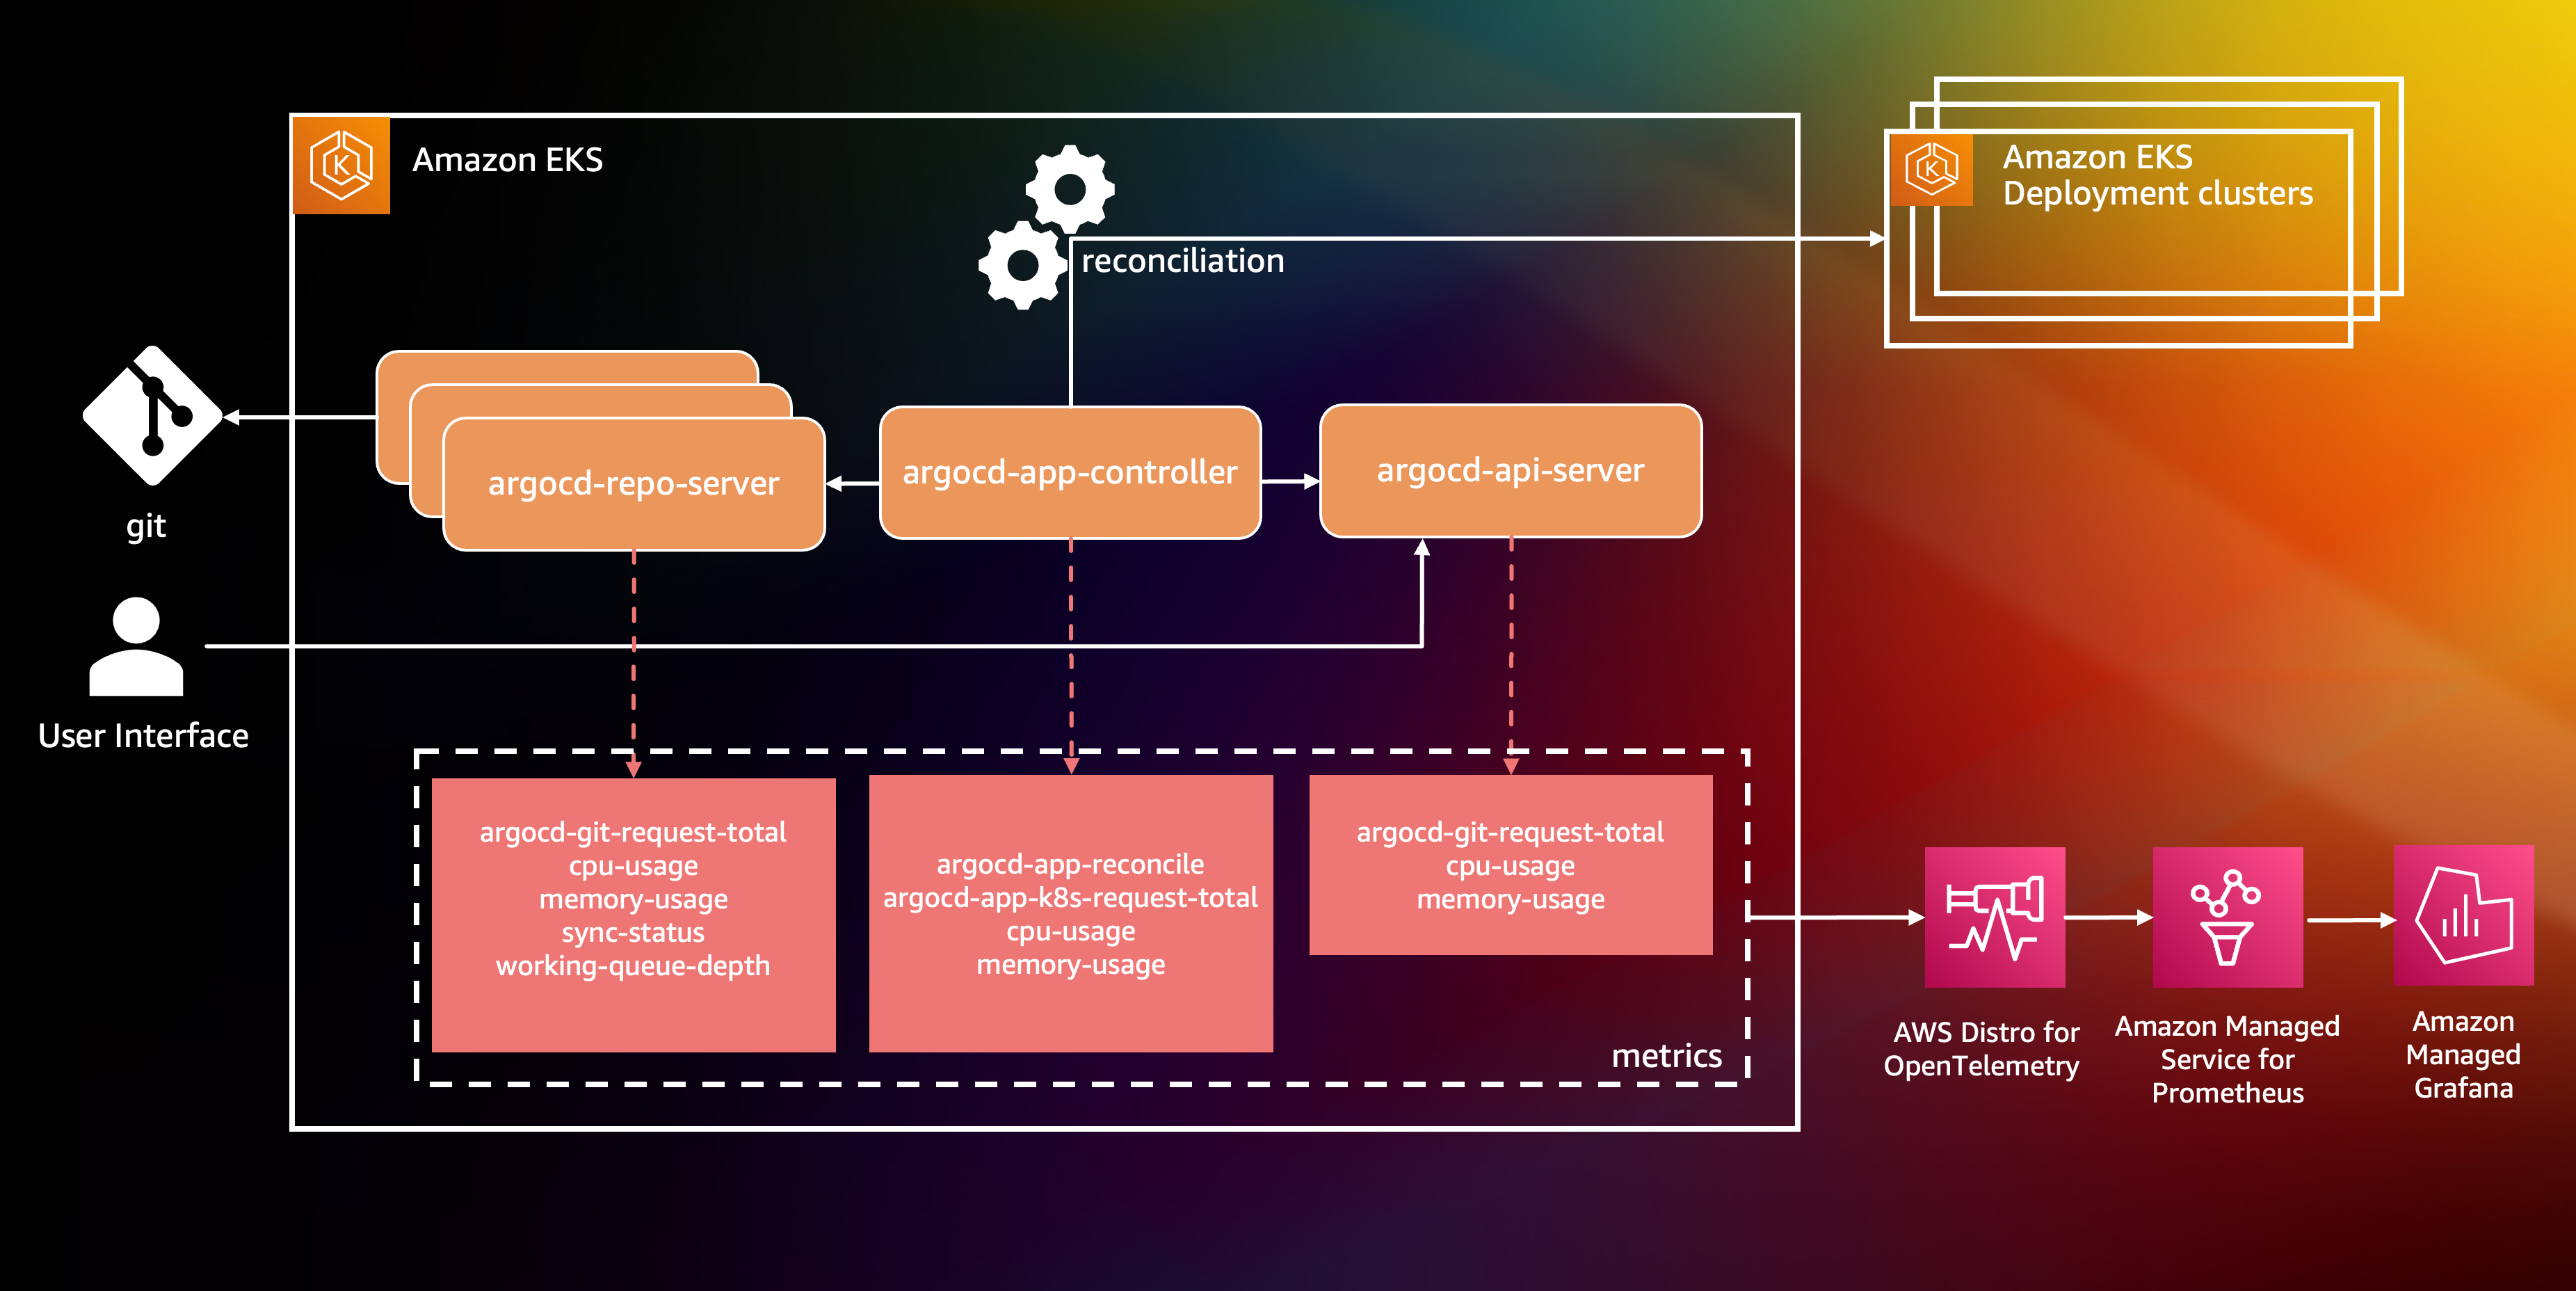
Figure 1: Argo CD has three main components: the repository server, the application controller, and the API server.
Test Parameters
There are several settings in Argo CD that can be used to improve the scalability and performance of Argo CD on any Kubernetes cluster. In addition to these settings, the types of applications and your cluster topology play a role in how Argo CD scales. We want to experiment with each of these parameters to see how it might affect Argo CD performance as we add applications and clusters.
Test Application
The application consists of a 2 KB configmap stored as a plain manifest on a single git repo on GitHub. We utilize a single git repo for two reasons: to isolate our experiments on just the application controller and to be able to trigger a sync across all the applications at once. While most deployments of Argo CD would be managing multiple applications from multiple repos, we felt that testing with multiple repos would generate unnecessary load on the repo server which is outside the scope of this testing.
Application Controller Settings
Here are the settings that are primarily utilized for scaling the Argo CD application controller:
- status/operations processors: Argo CD utilizes two queues to perform reconciliation (status) and application syncing (operations). The number of processors to service those queues are controlled with the status and operations processor settings. These two settings can be changed in the
argocd-cmd-params-cmConfigMap:
controller.operation.processors
controller.status.processors - client QPS/burst QPS settings: These settings control when the Argo CD application controller’s k8s client starts to throttle requests to the k8s API server. The client QPS setting is for limiting sustained QPS for the k8s client while burst QPS is for allowing a burst request rate in excess of the client QPS for a short period of time. There are two environment variables that control these settings:
ARGOCD_K8S_CLIENT_QPSandARGOCD_K8S_CLIENT_BURST. - sharding: Argo CD application controllers can be sharded by the number of managed application clusters. Multiple application controller replicas would each manage a subset of the application clusters managed by Argo CD. There are two ways to shard in Argo CD:
- automatic sharding: this method shards clusters automatically by creating the shards based on the hash of the application cluster ids. To configure this you need to change the number of replicas of the application controller and set the following environment variable to the number of shards:
ARGOCD_CONTROLLER_REPLICAS. - manual sharding: this method shards clusters manually. To configure this you will need to change the number of replicas of the application controller and set an environment variable to the shard number of each replica:
ARGOCD_CONTROLLER_SHARD. In addition to this, you will need to manually set the field “shard” in the managed cluster secret to the shard number a cluster would be a part of.
reconciliation timeout: Controls how often the application controller checks the consistency of the upstream git repos and the downstream resources. This setting can be changed in the Argo CD-cm ConfigMap: timeout.reconciliation.
- automatic sharding: this method shards clusters automatically by creating the shards based on the hash of the application cluster ids. To configure this you need to change the number of replicas of the application controller and set the following environment variable to the number of shards:
Key Metrics
We chose a set of key metrics for the scalability testing because we wanted to measure the two primary functions of the Argo CD application controller: syncing and reconciliation. Syncing can be measured by the sync time, while reconciliation can be measured by whether the reconciliation queue can be cleared out in a given reconciliation cycle.
- Sync time: When a git change is committed, Argo CD takes some time to see the change depending on which application is being processed in the reconciliation (status) queue. The sync time measures when the first application is resynced to when all of the applications are resynced.
- Reconciliation queue clear out: Whether or not the Argo CD application controller can finish reconciling the upstream git repos with the downstream application resources in a given reconcliation cycle. If the Argo CD application controller is unable to finish reconciliating all applications in a given cycle, you risk starting a new cycle before the old one has finished.
- CPU Usage: How much CPU is utilized by the Argo CD application controller. While we don’t call out this metric in the experiments, CPU utilization is important to indicate whether our settings are having an affect on the Argo CD application controller. Higher CPU utilization indicates that the application controller is scaling with the different settings that we change.
Environment
We ran the experiments in an AWS environment utilizing Amazon EKS clusters. No resource quotas were utilized on the Argo CD components because we wanted to ensure the key metrics were not bound by CPU/Memory but based on the Argo CD application controller settings. For Argo CD components, only a single repo-server and api-server were utilized. For the Argo CD cluster, we provisioned a M5.4xlarge Amazon Elastic Compute Cloud (Amazon EC2) instance. We wanted to ensure that in general, there would not be any resource constraints. For the application clusters we provisioned a M5.large Amazon EC2 instance. The type of instance for the application clusters are less important as our applications would not require any resources. Monitoring and metrics for Argo CD were provided by Prometheus/Grafana.
Experiments
We conducted a total of six different experiments. The first experiment focused on changing the reconciliation timeout to help with reconciliation queue clear out. The second experiment focused on changing the status/operation Processors. The third experiment focused on changing the client QPS/burst QPS settings. The fourth experiment focused on increasing the number of application clusters to 10. The fifth experiment focused on sharding the application controller. The last experiment was increasing the number of application clusters to 97.

Experiment 1: Baseline
The purpose of this experiment was to take a baseline measurement of the sync status, workqueue depth, and CPU metrics and to observe how the metrics react when we change the reconciliation timeout from 3 mins to 6 mins.

With the default settings, it takes 53 minutes to sync 10,000 apps. We utilize a Grafana dashboard to collect the key metrics.
The first graph, Sync Status, shows the number of Synced and OutofSync applications. As the number of OutofSync applications increase, we note that as the starting time at the 8:36 mark. When the number of OutofSync applications goes to zero, we note that as the ending time at the 9:19 mark.
The second graph, Workqueue Depth, shows two metrics: app_operation_processing_queue, which is the queue for performing syncs on applications, and the app_reconciliation_queue which is the queue for performing reconciliations on applications. As the sync starts, the app_operation_processing_queue starts to increase. The app_reconciliation_queue will show reconcile activity corresponding to periods determined by the reconciliation timeout.
The last graph, shows CPU Utilization of the ArgoCD application controller. Utilization corresponds to how many sync operations or reconciliation operations are currently being performed. This is determined by how many applications Argo CD is managing.
After the 10,000 applications are synced, in the second pane titled Workqueue Depth, we can observe a straight line at the 10K mark on the y-axis that indicates the reconciliation queue never clears out within the default 3 minute reconciliation timeout.

When we increased the reconciliation timeout from the default 3 minutes to 6 minutes (360s seconds) in the argocd-cm ConfigMap, we observed that the reconciliation queue cleared out as indicated by the lines dropping from 10K to 0 on the chart.
A sample manifest of the argocd-cm ConfigMap is shown here:

With a large number of applications, you should look at increasing your reconciliation timeout to ensure Argo CD is able to service the reconciliation queue in a timely manner.
Experiment 2: Status/Operation Processor Settings

It is indicated in the Argo CD documentation that changing the --operation-processors and --status-processors from the default setting of 10/20 status/operation processors are some of the first settings that you should change when scaling Argo CD. However, based on the experiments that we performed, we did not find any difference when changing these settings. Both sync times and reconciliation queue clear out remained the same with the different processor settings.
To change the status/operation processors, you can modify the ConfigMap like this:
Here are graphs showing different status/operation processor settings and their corresponding sync time. The first graph shows that with 25/50 status/operation processors, it takes 41 mins to sync all the applications. The second graph shows with 50/100 status/operation processors, it takes 40 mins to sync. The last graph shows with 100/200 status/operation processors, it takes 41 mins to sync.

It is possible that the artificial nature of our workload is the reason that we did not find any difference in the various status/operation processor settings. It is still recommended that you examine these settings first when scaling your Argo CD workload.
Note: As we increased our status and operation processors, there were several of these messages in the Argo CD application controller logs:
I0509 04:16:10.222604       1 request.go:601] Waited for 1.015113686s due to
client-side throttling, not priority and fairness, request:
This indicates that the k8s client is throttling requests which leads us to our next experiment, increasing the client QPS/burst QPS of the k8s client.
Experiment 3: Client QPS Settings

The client QPS/burst QPS had a significant impact on Argo CD performance. When changing the client QPS/burst QPS to 100/200, sync times dropped from 42 mins to 17 mins. The reconciliation queue also cleared out with the default 3 min reconciliation timeout. Increasing the client QPS/burst QPS settings to 150/300 and 200/400 showed additional improvements to sync times of 12 mins and 11 mins respectively. Note that these settings affect how fast Argo CD calls the k8s API server. Monitoring the k8s API server should be performed while changing these settings.
To modify the client QPS/burst QPS, you can modify the environment variables like this:
Here are graphs showing different client QPS/burst QPS and their corresponding sync time. The first graph shows with 100/200 client QPS/burst QPS, it takes 17 mins to sync. The second graph shows with 150/300 client QPS/burst QPS, it takes 12 mins to sync. The last graph shows with 200/400 client QPS/burst QPS, it takes 11 mins to sync.

We reran our experiments with the status/operation processors utilizing the increased k8s client QPS limits and did not see a difference with the various processor settings. It is possible that these settings do have an affect on scalability but because of the artificial nature of our applications, we are not seeing a difference in results. We will need to revisit these experiments with real world applications.
Here are graphs showing QPS limits of 200/400 with different status/operation processors settings (we used in Experiment #2) and their corresponding sync time. The first graph shows with 25/50 status/operation processors, it takes 10 mins to sync. The second graph shows with 50/100 status/operation processors, it takes 10 mins to sync. The last graph shows with 100/200 status/operation processors, it takes 11 mins to sync.

Experiment 4: Multiple Application Clusters

With this experiment, we wanted to test how increasing the number of application clusters affects Argo CD without sharding the application controller. It took around 45 mins to sync all 10,000 applications. The sync duration is slightly faster than the single cluster/single shard measured at 53 min in Experiment #1. The graph here shows that the OutofSync applications start to increase at the 13:49 mark and goes to zero at the 14:34 mark indicating a sync time of 45 mins.

Experiment 5: Application Controller Sharding

The Argo CD application controller was broken into 10 shards and showed significant improvements in sync times and reconciliation queue clear out. Sync times dropped from 43 mins to 8 mins 30 secs and the reconciliation queue cleared out even with the 3 min reconciliation timeout. What we noticed is that not all of the application controller shards are loaded equally. Some shards have higher CPU utilization than the others. Because of how Argo CD automatically assigns shards, it is possible for some of the application controllers to have more clusters to manage than others.
To shard the application controller, you can modify the environment variables like this:
This graph shows the OutOfSync applications start increasing at the 14:47:00 mark and goes to zero at the 14:55:30 mark indicating a sync time of 8 mins and 30 secs.

Experiment 6: More Application Clusters and Sharding

With this experiment, we increased the number of application clusters to 97 with 104 applications per cluster. The reason we used 97 clusters with 104 applications per cluster is because we were unable to create 100 app clusters due to cluster limits in our account. Sync times were identical to the previous experiment showing that increasing the number of app clusters does not have any performance advantages unless you shard the application controller.
This graph shows the OutOfSync applications starts rising at 20:05:30 and goes to zero at 20:13:30 indicating a sync time of 8 mins.

Conclusion
In this blog post we discussed our early efforts in scaling Argo CD to support 10,000 applications deployed across as many as 97 Kubernetes clusters. Our findings show that the existing mechanisms for sharding of the application controller and increasing client and burst QPS settings can help with better scaling Argo CD. However, while we have managed to test Argo CD with 97 application clusters, for the next set of experiments we plan to push the number of application clusters to a much larger set and evaluate and improve sharding mechanisms in Argo CD even further. Stay tuned for the report on our next round of experiments and reach out on the CNCF #argo-sig-scalability Slack channel to get help optimizing for your use-cases and scenarios.
Resources:
1. Multi-Cluster GitOps using Amazon EKS, Flux, and Crossplane: https://aws.amazon.com/blogs/containers/part-1-build-multi-cluster-gitops-using-amazon-eks-flux-cd-and-crossplane/
2. GitOps model for provisioning and bootstrapping Amazon EKS clusters using Crossplane and Argo CD: https://aws.amazon.com/blogs/containers/gitops-model-for-provisioning-and-bootstrapping-amazon-eks-clusters-using-crossplane-and-argo-cd/
3. Declarative provisioning of AWS resources with Spinnaker and Crossplane: https://aws.amazon.com/blogs/opensource/declarative-provisioning-of-aws-resources-with-spinnaker-and-crossplane/