AWS Open Source Blog
Integrating the OpenTelemetry JavaScript SDK with AWS X-Ray
In this blog post, AWS intern Cong Zou shares his experience contributing to a large open source project—OpenTelemetry—for the first time. OpenTelemetry provides a single set of APIs, libraries, agents, and collector services to capture distributed traces and metrics from applications. Users can analyze these traces and metrics using Prometheus, Jaeger, and other observability tools.
In software, observability typically refers to telemetry produced by services. It is often divided into three major verticals:
- Tracing, or distributed tracing, provides insight into the full life cycles, known as traces, of requests to the system. This allows us to pinpoint failures and performance issues.
- Metrics provide quantitative information about processes running inside the system, including counters, gauges, and histograms.
- Logging provides insight into application-specific messages emitted by processes.
AWS X-Ray is a popular observability tool that collects tracing data about requests that an application serves. It provides tools for a user to view, filter, and gain insights that help identify issues and opportunities for optimization. Users can use an X-Ray client to communicate with the AWS X-Ray service. For any traced transaction, the user can see detailed information beyond the request and response. AWS X-Ray also shows calls that their application makes to downstream AWS resources, microservices, databases, and HTTP web APIs.
To start the project, I first read through the OpenTelemetry specification documentation to understand its observability requirements. The task was to verify existing test infrastructure for AWS X-Ray and then add enhancements for gaps. I spent weeks diving deep into the OpenTelemetry and AWS X-Ray code. This initial research helped me develop a deeper understanding of how to implement AWS X-Ray auto-instrumentation for the OpenTelemetry JS-SDK project.
Why do we need to integrate OpenTelemetry JS-SDK with AWS X-Ray?
Currently, the OpenTelemetry Collector supports AWS X-Ray. This process bridges the OpenTelemetry format with various backends. In theory, any user of an OpenTelemetry language SDK can instrument their application to be traced by AWS X-Ray. These application traces then appear on the AWS X-Ray console.
Language-specific work must be done in an SDK to properly support AWS X-Ray. This is due to various proprietary aspects of the X-Ray backend. We implemented these AWS X-Ray proprietary features for all the supported OpenTelemetry languages to make it easier for a user to use OpenTelemetry with X-Ray.
Project details
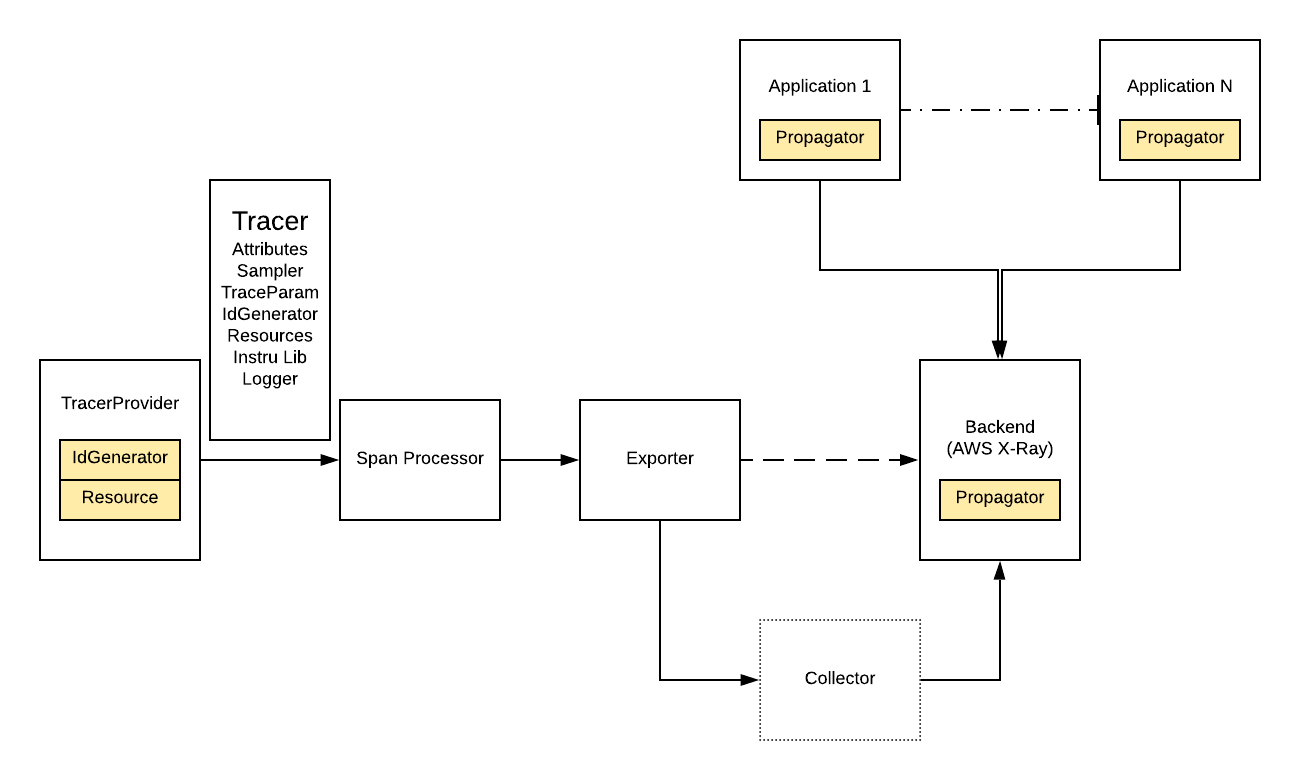
To instrument an application using JS SDK and the X-Ray backend, we must build a pipeline consisting of the following components:
TracerProvider is the stateful object that holds configurations used to generate Tracer. TracerProvider provides a way to set/register and access a global default TracerProvider.
TracerConfig can adjust the configuration of TracerProvider. TracerConfig can configure many subcomponents, including: Sampler; TraceParams, which defines the number of attributes, links, and events; IdGenerator, which is used to generate traceId and spanId; Resource; InstrumentationLibrary; and Logger.
Tracer is responsible for creating spans. Trace data consists of single or multiple spans. Note that tracers usually should not be responsible for configuration. This should be the responsibility of the TracerProvider.
Span Processor is an interface that supports hooks for span start and end method invocations. Span processors are invoked only when IsRecording is true. Built-in span processors are responsible for the batching and conversion of spans to exportable representations, and for passing batches to exporters. Span processors can be registered directly on the SDK TracerProvider and are invoked in the same order in which they are registered.
Span Exporter defines the interface that protocol-specific exporters must implement so they can be plugged into the OpenTelemetry SDK and send telemetry data. The protocol exporter acts as a simple telemetry data encoder and transmitter. In our case, we are using the OpenTelemetry Protocol exporter (OTLP) to transmit our tracing data to the collector.
Collector is a set of components that collects traces, metrics, and other telemetry data from processes instrumented by OpenTelemetry or other tracing libraries (Jaeger, Prometheus, etc.). The Collector can do aggregation, smart sampling, and export traces and metrics to one or more monitoring/tracing backends. The Collector allows further processing of collected telemetry, such as adding additional attributes or scrubbing personal information. In our case, we used a Docker image to take advantage of Collector.
To conclude, the dataflow is as follows:
- The user first configures TracerProvider to provide an instrumented Tracer.
- Tracer generates tracing data to be processed by Span Processor.
- Then OTLP exporter exports processed tracing data to Collector.
- Finally the Collector is used to export tracing data to AWS X-Ray service.
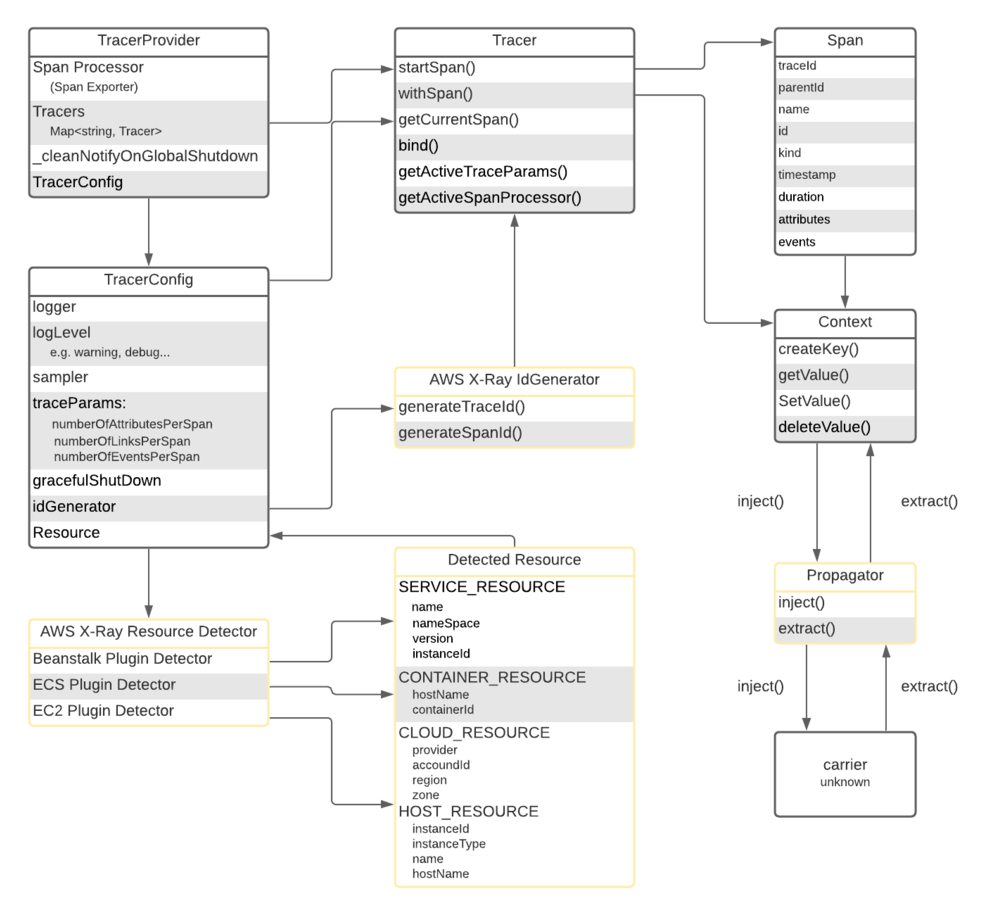
To integrate OpenTelemetry JS-SDK with AWS X-Ray, we designed and implemented three components: IdGenerator, Propagator, and Resource Detectors. Each corresponds to the components with the yellow background in the first diagram and components with the yellow framework in the second diagram.
The second diagram demonstrates the way our vendor-specific components interact with OpenTelemetry components:
IdGenerator is responsible for generating trace ID and span ID of tracing data. By default, OpenTelemetry JS-SDK uses RandomIdGenerator, which randomly generates 16-byte trace ID and 8-byte span ID formatted as lowercase hex. The first four bytes of trace ID of AWS X-Ray are supposed to encode from the start time of tracing data. This is different from the default trace ID. It is why AWS X-Ray IdGenerator is mandatory for instrumenting the dataflow to transmit tracing data to AWS X-Ray console. AWS X-Ray decodes the first four bytes of the trace ID string back to time and rejects the expired tracing data started before 30 days. If we use the default trace ID, AWS X-Ray rejects most of the valid tracing data. Note that after instrumenting IdGenerator in TracerProvider, the provided Tracer automatically uses the given IdGenerator to generate trace ID and span ID for tracing data.
The Propagator in OpenTelemetry serializes and deserializes values of cross-cutting concern, such as SpanContext and CorrelationContext. Cross-cutting concerns send their state to the next process using propagators. These are defined as objects used to read and write context data to and from messages exchanged by the applications. Different propagator types define the restrictions imposed by a specific transport and bound to a data type. For our AWS X-Ray Propagator, we also define two methods: inject() and extract(). When calling inject(), we first get the spanContext from context. Then, we construct an AWS X-Ray Format tracing header using the content of spanContext. Finally, we inject the built tracing header into carrier.
In reverse, extract() first extracts an AWS X-Ray Format tracing header from carrier and decomposes the tracing header into traceId, spanId, and traceFlags. It then builds a spanContext using the decomposed data and sets the spanContext into context.
Note that the data type of the carrier here is unknown because it can vary from protocol to protocol. In HTTP protocol, for instance, the carrier is a request header.
Resource Detectors capture information about the entity for which telemetry is recorded. The primary purpose of resources as a first-class concept in the SDK is the decoupling of discovery of resource information from exporters. This allows for independent development and customization for users who need to integrate with closed source environments.
In our project, we designed and implemented three resource detectors:
- Beanstalk Plugin Detector: Detecting SERVICE_RESOURCE from Beanstalk plugin.
- ECS Plugin Detector: Detecting CONTAINER_RESOURCE from ECS plugin.
- EC2 Plugin Detector: Detecting CLOUD_RESOURCE and HOST_RESOURCE from EC2 plugin.
Outcomes and lessons learned
This is the first time I worked on an open source project of this scale. It is also my first time working as an SDE intern. During my internship, the most important thing I learned was that the tasks of a software engineer are not limited to coding. In practice, the majority of work includes making assumptions, communicating with other engineers, collecting feedback, designing, and then coding. Even after the first round of coding, there is a need to review feedback from other engineers.
Furthermore, when designing or implementing, issues or blockers can arise. An excellent engineer ought to file issues or ask questions as soon as possible to keep their project on the right path.
In summary, working with the OpenTelemetry community and AWS taught me a lot. I not only learned technical knowledge, such as coding style and language-specific features, but also how to collaborate with other engineers. This internship is valuable for my career development and represents a precious experience in my life.
References:
- Get started with OpenTelemetry
- See the OpenTelemetry specification documentation
- Learn more about the OpenTelemetry JS-SDK
- Read the AWS X-Ray documentation

Cong Zou
Cong Zou is a student at Northwestern University, currently working as a software engineer intern at AWS. His professional interests include observability and machine learning.
The content and opinions in this post are those of the third-party author and AWS is not responsible for the content or accuracy of this post.