AWS News Blog
New Amazon QuickSight API Capabilities to Accelerate Your BI Transformation

|
Regular readers of this blog, and AWS customers alike, know the benefits of infrastructure as code (IaC). It allows you to describe your infrastructure using a programming language to consistently deploy your infrastructure to multiple environments or AWS Regions. Other benefits are the possibility to version-control your infrastructure using the same development tools and workflow you use to manage your application source code. IaC also offers the ability to programmatically validate part of the infrastructure before it is deployed.
Today, we are expanding the capabilities of QuickSight APIs to allow programmatic creation and management of dashboards, analysis, and templates. These capabilities allow BI teams to manage their BI assets as code, similar to IaC. It brings greater agility to BI teams, and it allows them to accelerate BI migrations from legacy products through programmatic migration options.
Business intelligence and IT operations (BIOps) are inspired by best practices learned over decades from DevOps. BIOps enable faster innovation for your customers, bringing them data insights quickly. Dashboards are usually developed and deployed manually due to the UI-driven nature of BI authoring. This presents a challenge for BIOps, as changes to dashboards during deployments might not be fully validated, leading to errors and downtime when changes are inadvertently moved to production. The new QuickSight APIs enable you to programmatically create and modify your QuickSight analyses and dashboards, enable version control on these assets in your code repository, and help to accelerate your migration to the AWS Cloud.
Programmatic creation and management of analysis, templates, and dashboards also helps you to migrate assets from older BI solutions. Among all of the data and analytics workloads moving to the cloud, business intelligence tends to be among the last pieces to be migrated from the legacy, on-premises solutions. BI teams often have thousands of custom reports and dashboards, built over decades, that are tedious to migrate. Migrating these reports is time-consuming as BI teams need to spend months of work migrating each of these assets manually one by one.
Terminology
With this launch, QuickSight adds a new describe set of APIs. We are also updating existing create, update, and list API verbs. Altogether, these new and updated APIs allow you to work with the data model of analyses, templates, and dashboards for fine grain control via APIs.
- A QuickSight analysis is the easy-to-use workspace for creating data visualizations, which are graphical representations of your data. Each analysis contains a collection of visualizations that you arrange and customize.
- A QuickSight dashboard lets you share interactive visualizations or static reports from an analysis with other users.
- A QuickSight template is an entity that encapsulates the metadata required to create an analysis or a dashboard. It abstracts the dataset associated with the analysis by replacing it with placeholders.
The new APIs (DescribeAnalysisDefinition, DescribeTemplateDefinition, DescribeDashboardDefinition) now allow developers to manage all supported charts and visual components.
Let’s See It in Action
Let’s imagine I want to programmatically create a QuickSight analysis.
Programmatically creating a new business intelligence analysis is a three-step process: create the data source that provides data for analyses, create a dataset based on the data source, and create the QuickSight analysis.
The first step when using QuickSight programmatically or through the user interface is to define your data sources. Data sources define the properties of the databases that have the data you want to analyze. Creating and managing data sources programmatically is not new. You can refer to the QuickSight API Operations to Control Data Sources page.
The second step is to create the dataset to link one or multiple data sources. Again, programmatically managing datasets is not new.
When using the new describe API, analysis, dashboards, and templates are defined as JSON objects fully modeled in the AWS SDK. In this demo, I am using the AWS Command Line Interface (AWS CLI) that uses JSON objects. When you use Java or another AWS SDK, you can programmatically manipulate all elements.
The easiest way to get started to programmatically create a new analysis or dashboard is to start with the definition of an existing one that you created in the console.
The third step is to create the analysis. I first call the describe-analysis-definition API to describe an existing analysis. I receive a JSON file that is the full response of the API call. I can inspect and modify the Definition in the describe-analysis-definition response to create a new analysis.
aws quicksight describe-analysis-definition      \
        --aws-account-id 0123456789              \
        --analysis-id linechart-kpi-donut-pivot
> ./AWS\ Blog\ Sample\ Code/linechart-kpi-donut-pivot.json
Note: This JSON file cannot be used directly without several modifications as input to the create API.
When I am ready to create a new analysis, I generate a JSON file using the --generate-cli-skeleton argument. Then, I copy the original or modified Definition object from my earlier call to describe-analysis-definition into create-sales-analysis.json.
aws quicksight create-analysis \
      --generate-cli-skeleton > create-sales-analysis.json

aws quicksight create-analysis  \
      --cli-input-json file://./AWS\ Blog\ Sample\ Code/create-sales-analysis.json
The Definition field shares the same shape across dashboards, templates, and analyses, so the Definition used to create our analysis can also be re-used to create a new dashboard if desired with the create-dashboard API.
aws quicksight create-dashboard \
      --generate-cli-skeleton > create-dashboard.json
I can then modify create-dashboard.json to include the Definition from my create-sales-analysis.json file, as well as update other parameters, then make a call to create-dashboard.
aws quicksight create-dashboard \
       --cli-input-json file://./AWS\ Blog\ Sample\ Code/create-dashboard.json
Here is an extract of the JSON file I used.

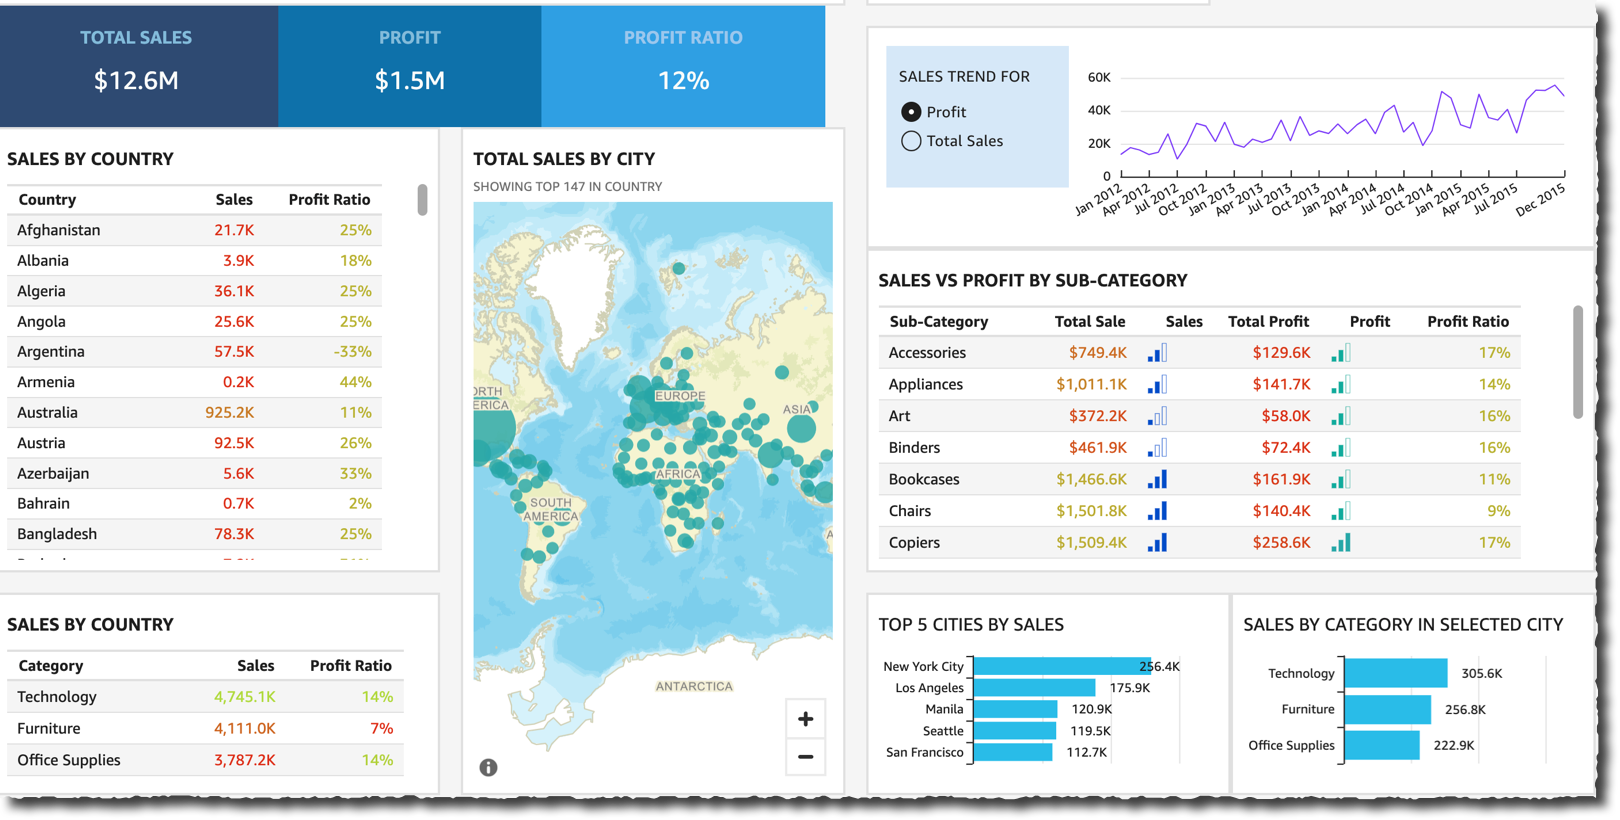
Obviously, developing a dashboard using the API is an iterative process. Here is the result after several iterations.
I can apply the same technique to programmatically migrate assets from older BI solutions.
Pricing and Availability
The new API allows you to define your business intelligence dashboard as programmable objects. It will speed up migration from older BI tools. QuickSight’s API documentation page has all the details.
The API is available at no additional charge to all QuickSight Enterprise Edition customers in all AWS Regions where QuickSight is available. AWS CloudFormation support for the newly supported data models on these APIs is coming soon.
Go build your first dashboard programmatically today!
— seb