Containers
Sending Envoy metrics from AWS App Mesh to Amazon CloudWatch
NOTICE: October 04, 2024 – This post no longer reflects the best guidance for configuring a service mesh with Amazon ECS and Amazon EKS, and its examples no longer work as shown. For workloads running on Amazon ECS, please refer to newer content on Amazon ECS Service Connect, and for workloads running on Amazon EKS, please refer to Amazon VPC Lattice.
——–
With AWS customers adopting AWS App Mesh with Amazon ECS and Amazon EKS, we have seen them with the following request on multiple occasions. This post will demonstrate the mechanism of getting metrics from Envoy to CloudWatch.
“We have adopted AWS App Mesh as a service mesh solution for application-level networking for our micro services running within our our ECS and EKS Clusters. We would want to know if it’s possible to send metrics collected by Envoy Sidecar of App Mesh to Amazon CloudWatch. We would like to benefit from various metrics like TLS, Ingress, Egress, Cluster Manager from Envoy Sidecar of App Mesh on Amazon CloudWatch Console. We also want a mechanism to create innovative CloudWatch Dashboards to explore the metrics and gain more insights. Is there a way to achieve this and what are the list of details steps to be followed?”
Introduction:
With customers adopting AWS App Mesh as their service mesh solution for application-level networking, they need to ingest and aggregate metrics from App Mesh and send the metrics to CloudWatch for monitoring and alerting. With a working AWS App Mesh service mesh for our microservice running on an ECS or EKS cluster, let’s ingest and aggregate metrics from App Mesh to CloudWatch to see the status with application-level networking for our workloads.
AWS App Mesh injects the Envoy sidecar to run along side the application container within an ECS task or within an EKS pod. The Envoy sidecar collects quite a lot of metrics and by deploying a CloudWatch Agent inside an ECS task or an EKS pod, we can send all the metrics collected from the Envoy sidecar in App Mesh to CloudWatch. This will help us with monitoring, alerting, and creating CloudWatch dashboards.
- Envoy container configurations required to forward metrics on an ECS task or on an EKS pod.
- CloudWatch agent container installation on the ECS task or EKS pod.
- Configuring CloudWatch dashboards with App Mesh/Envoy Stats.
Architecture overview:
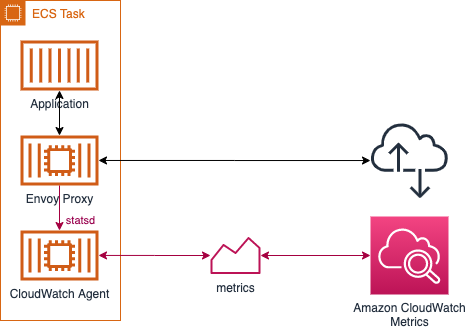
The above diagram shows the architecture of an existing ECS task, which has the application container and Envoy sidecar container deployed by App Mesh. With this, the Envoy container on the ECS task collects metrics from the application container. The Envoy container will be configured to send the collected metrics to localhost:8125. We will be deploying a new CloudWatch agent to the ECS task, which will be listening on localhost:8125. The CloudWatch agent will be sending all the collected metrics to Amazon CloudWatch for a console view.
Demo:
Step 0: Prerequisites:
- AWS App Mesh running on an ECS or EKS cluster.
Note: we don’t need to have any configurations at the App Mesh level to get started with this solution implementation.
Step 1: ECS Envoy container configurations :
- The first step is to add the environment variable
ENABLE_ENVOY_DOG_STATSD(with value of1) to the Envoy container in your task definition. This will set upstatsdforwarding to localhost:8125. - We also recommend adding
ENABLE_ENVOY_STATS_TAGS=1, which adds tags for the mesh and virtual node to the metrics.
Note: that if you are using EKS, the same step can be applied to an Envoy sidecar container on an EKS pod.
Step 2: ECS CloudWatch agent container deployment :
- With the Envoy sidecar already set up to forward metrics to localhost:8125, we would need a CloudWatch agent listening on localhost:8125. For this Demo we are naming the CloudWatch Namespace as
AppMeshExample/gateway-envoy/StatsD - Add a new CloudWatch agent to your task definition to listen on the localhost:8125 with the following options:
- Name:
cw-agent - Image:
amazon/cloudwatch-agent:latest - Essential:
true - Container Port:
8125 (udp) - Environment variables:
- Name:
CW_CONFIG_CONTENT - Value:
{ "metrics": { "namespace":"AppMeshExample/gateway-envoy/StatsD", "metrics_collected": { "statsd": { "metrics_aggregation_interval": 0}}}}
- Name:
- Name:
- The above environment variable values work fine if you use the AWS Management Console to add the CloudWatch agent to your task definition. If you are updating your CloudFormation template to add the CloudWatch Agent container Definition, please follow the below code snippet :
                - Name:  cw-agent
                  Image: amazon/cloudwatch-agent:latest
                  Essential: true
                  User: '1337'
                  PortMappings:
                    - ContainerPort: 8125
                      Protocol: udp
                      HostPort: 8125
                  Environment:
                      - Name: CW_CONFIG_CONTENT
Value: "{ \"metrics\": { \"namespace\":\"AppMeshExample/gateway-envoy/StatsD\", \"metrics_collected\": { \"statsd\": { \"metrics_aggregation_interval\": 0}}}}"- Your task definition is now updated to deploy the CloudWatch agent container to your ECS task. You should now add the
CloudWatchAgentServerPolicyto your ECS task role in IAM console. - The final step to send metrics to CloudWatch is to update the ECS service or create a new ECS service, which points to the ECS task with the above updated ECS task definitions.
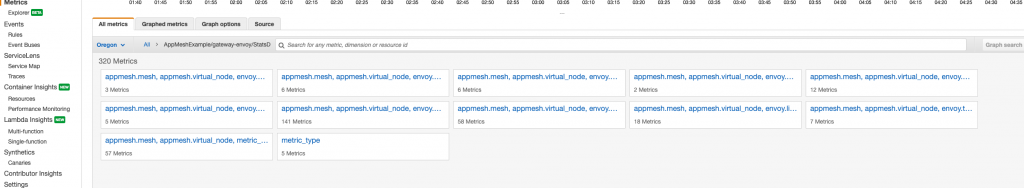
- Navigate to “Metrics” in CloudWatch. All the collected metrics will show up in the namespace
AppMeshExample/gateway-envoy/StatsD, which can be modified in the above environment variableCW_CONFIG_CONTENT.
Note: This is also supported for EKS clusters by adding the environment variables to the envoy container, the cw-agent container to the pod/deployment spec, and using an IAM role with the CloudWatchAgentServerPolicy policy to the EKS IAM role.
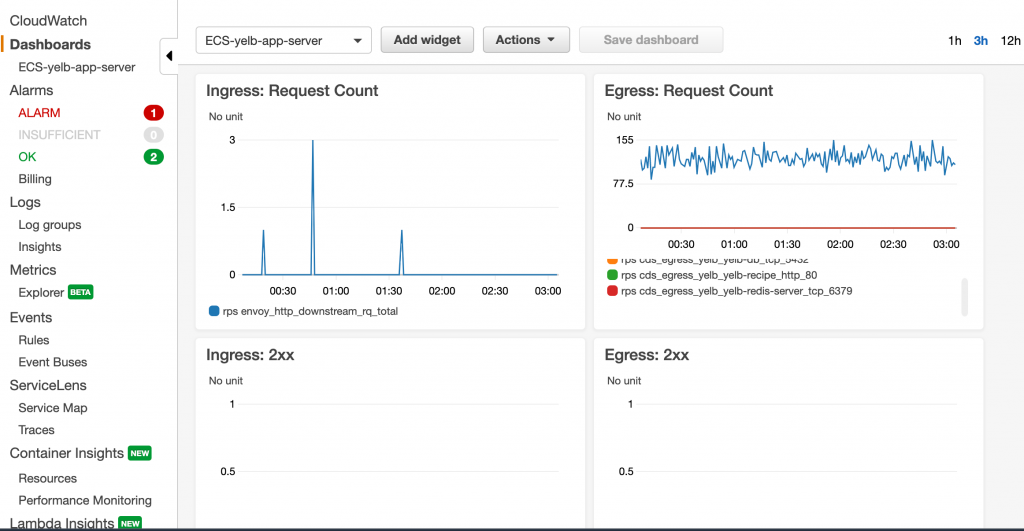
Step 3: Set up the CloudWatch dashboard
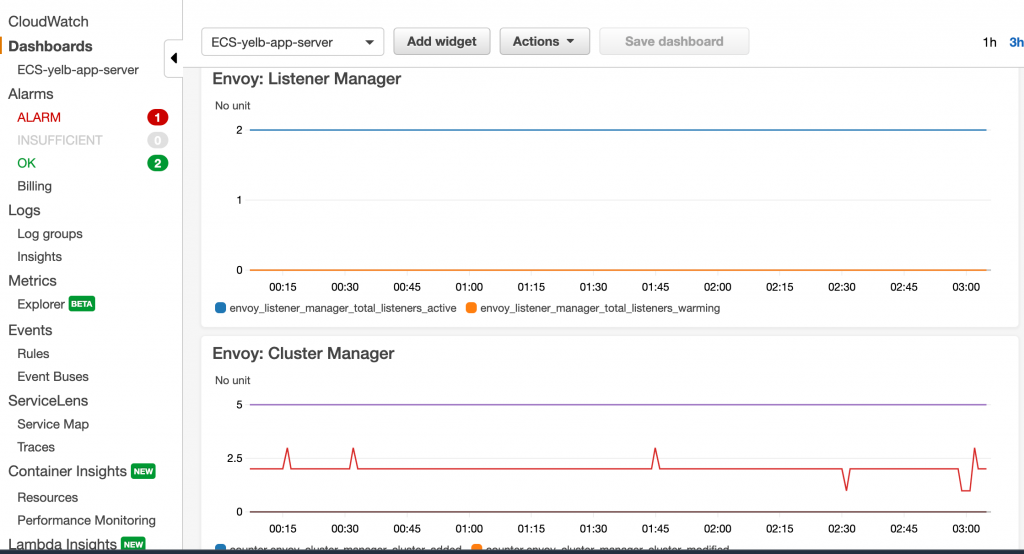
- You can create the above CloudWatch dashboard with you App Mesh/Envoy Stats using the scripts from our github repo. Follow the following commands to clone the repo:
git clone https://github.com/aws/aws-app-mesh-examples.git
cd aws-app-mesh-examples/blogs/envoy-cw-dashboards- Please update the following in the
deploy-dash.shscript.
CLOUDWATCH_NAMESPACE="AppMeshExample/gateway-envoy/StatsD"
MESH_NAME="<Name of your AppMesh>"
VIRTUAL_NODE_NAME="<Name of your Virtual Node"- Run the dashboard script
deploy-dash.sh, which deploys a CloudFormation template to create the CloudWatch dashboard as shown below
Conclusion
From the above demo, you can see the mechanism to send collected metrics to CloudWatch using an Envoy sidecar with App Mesh for container workloads. I hope you can use this to improve your application’s monitoring and alerting of container workloads. Let us know what you think of this feature, review our roadmaps, and suggest new features on the AWS App Mesh Roadmap and the AWS Containers Roadmap, hosted on GitHub.
Next Steps
You can deep dive into various metrics like Ingress, Egress, TLS, and start exploring the data to gain more insights on application-level networking for our workloads.