AWS Cloud Operations & Migrations Blog
Monitor Java apps running on Tomcat server with Amazon CloudWatch Application Signals (Preview)
Traditionally, Java web applications are packaged into Web Application Resource (WAR) files, which can be deployed on any Servlet/JSP container like Tomcat server. These applications often operate within distributed environments, involving multiple interconnected components such as databases, external APIs, and caching layers. Monitoring the performance and health of Java web applications can be challenging due to the complex interactions between different components. This complexity can significantly escalate your Mean Time to Resolution (MTTR).
In this blog post, we will demonstrate how to auto-instrument Java web applications deployed via WAR packages and running on Tomcat server using Amazon CloudWatch Application Signals. Enabling Application Signals automatically instruments the application using AWS Distro for OpenTelemetry (ADOT) Java Auto-Instrumentation Agent to collect metrics and traces from your applications without making any code changes. You can leverage key metrics such as call volume, availability, latency, faults, and errors to quickly see and triage current operational health of your application services and verify whether they are meeting the long term performance and business goals.
Solution Overview
Here’s a detailed technical overview of the solution:
- We will deploy a Spring PetClinic application packaged as a WAR file onto an Amazon EC2 instance running Tomcat server.
- As part of enabling Application Signals, we will use environment variables within the Tomcat server to configure ADOT Java auto-instrumentation agent to instrument the application to emit metrics and traces.
- The ADOT Java Auto-Instrumentation agent can be attached to any Java 8+ application to gather telemetry data from a diverse set of libraries and frameworks. The agent will automatically transform code at startup to collect tracing data. By default it uses the OTLP exporter and is configured to send data to a OpenTelemetry collector at http://localhost:4317 for both metrics and traces.
- We will configure CloudWatch agent to collect metrics and traces for Application Signals. Additionally, we will configure the agent to send Tomcat
ServerandAccesslogs in order to further enhance the application observability. - Application signals then auto discovers your services and dependencies and provides application topology visualization to understand the state of your application.
 Figure 1: Solution Architecture
Prerequisites
To follow along with this blog post, you need to setup an existing Amazon EC2 instance using Amazon Linux 2 AMI in a public subnet. Ensure the instance meets the following requirements:
- Make sure the EC2 instance has internet connectivity and you are able to connect (using SSH or EC2 Instance Connect or AWS Systems Manger Session Manager) to the instance.
- Create an IAM role with
CloudWatchAgentServerPolicyandAWSXrayWriteOnlyAccesspolicies and attach it to your EC2 instance. See Create IAM roles and users for use with CloudWatch agent. - Configure the EC2 security group to allow inbound traffic over TCP 8080 from client Public IP address as this required to access the sample application.
Environment Setup
Connect to your EC2 instance and run the below commands to clone the GitHub repo to setup and install the required dependencies. Update the TOMCAT_VER and MAVEN_VER variables value with the latest version available. For latest version available, you can check Apache Tomcat 10 download page and Apache Maven download page.
sudo yum install git -y
git clone https://github.com/aws-samples/amazon-cloudwatch-application-signals-java-tomcat-monitoring
cd amazon-cloudwatch-application-signals-java-tomcat-monitoring
sudo chmod +x get_requirements.sh
TOMCAT_VER=<provide latest tomcat version>
MAVEN_VER=<provide latest maven version>
sudo ./get_requirements.sh $TOMCAT_VER $MAVEN_VER
Running the above script automates the setup of a Java web application environment by installing the following:
- Apache Tomcat and Maven
- CloudWatch agent and ADOT Java Auto-Instrumentation agent
- Builds the Spring PetClinic application packaged as a WAR from application repository and moves it to Tomcat’s server
/webappsdirectory.
Solution Walkthrough
Enable Application Signals in your account
Follow the instructions in Step 1: Enable Application Signals in your account.
Configure the CloudWatch agent
- Connect to your EC2 instance and run below command to create configuration file for CloudWatch agent.
sudo nano /opt/aws/amazon-cloudwatch-agent/bin/app-signals-config.json - Copy and Paste the below CloudWatch agent configuration content in the previously created file and save it. This will configure the agent to send metrics, logs and traces from the application.
{ "traces": { "traces_collected": { "app_signals": {} } }, "logs": { "metrics_collected": { "app_signals": {} }, "logs_collected": { "files": { "collect_list": [{ "file_path": "/opt/tomcat/logs/**.log", "log_group_name": "Tomcat-Server-Logs", "retention_in_days": 1 }, { "file_path": "/opt/tomcat/logs/**.txt", "log_group_name": "Tomcat-Access-logs", "retention_in_days": 1 }] } } } } - Run the command shown below to start the CloudWatch agent with the configuration file created in the previous step.
sudo /opt/aws/amazon-cloudwatch-agent/bin/amazon-cloudwatch-agent-ctl -a fetch-config -m ec2 -s -c file:/opt/aws/amazon-cloudwatch-agent/bin/app-signals-config.json
Instrument Spring PetClinic application and start Tomcat server
- Create a file named
setenv.shin the Tomcat’sbindirectory. This file allows us to set environment variables that will be applied when starting the Tomcat server.sudo nano /opt/tomcat/bin/setenv.sh - Paste the following content into the
setenv.shfile and save it.export CATALINA_OPTS="$CATALINA_OPTS -javaagent:/opt/aws/aws-opentelemetry-agent.jar" export OTEL_JAVAAGENT_DEBUG=false export OTEL_METRICS_EXPORTER=none export OTEL_SMP_ENABLED=true export OTEL_AWS_SMP_EXPORTER_ENDPOINT=http://localhost:4315 export OTEL_EXPORTER_OTLP_TRACES_ENDPOINT=http://localhost:4315 export OTEL_RESOURCE_ATTRIBUTES=aws.hostedin.environment=EC2,service.name=petclinicEnvironment variables explanation:
- When instrumenting an app that runs on a Java application server with a Java agent, you must add the
javaagentpath to the JVM arguments. For Tomcat server, we are providing with the path of the folder location where we have saved the ADOT Java agent underCATALINA_OPTSenvironment variable. More information can be found on opentelemetry’s document. - (optional) You can set the
OTEL_JAVAAGENT_DEBUGenvironment variable totrueto see debug logs. Note that these logs are quite verbose. Here we have set it tofalse. - All other environment variables used above are for additional information for Application Signals and more details can be found about them in Application Signals document.
- When instrumenting an app that runs on a Java application server with a Java agent, you must add the
- Start Tomcat server by running the below command.
sudo /opt/tomcat/bin/startup.sh - Once Tomcat server is running, you can explore the Spring PetClinic application by navigating to the following URL and generate some traffic.
http://<public-ip-of-ec2>:8080/petclinic
Visualizing Spring PetClinic application using Application Signals
Navigate to the CloudWatch console and choose Services under the Application Signals section in the left navigation pane. It may take 2-3 minutes before CloudWatch Application Signals starts to discover the application.
Services Dashboard
As shown in the Figure 2, we can see the Services page consists of operational health metrics for PetClinic service along with the list of the services that have been enabled for Application Signals. Below the Services table, you can view top operations and dependencies across all services by call volume, faults, and latency.
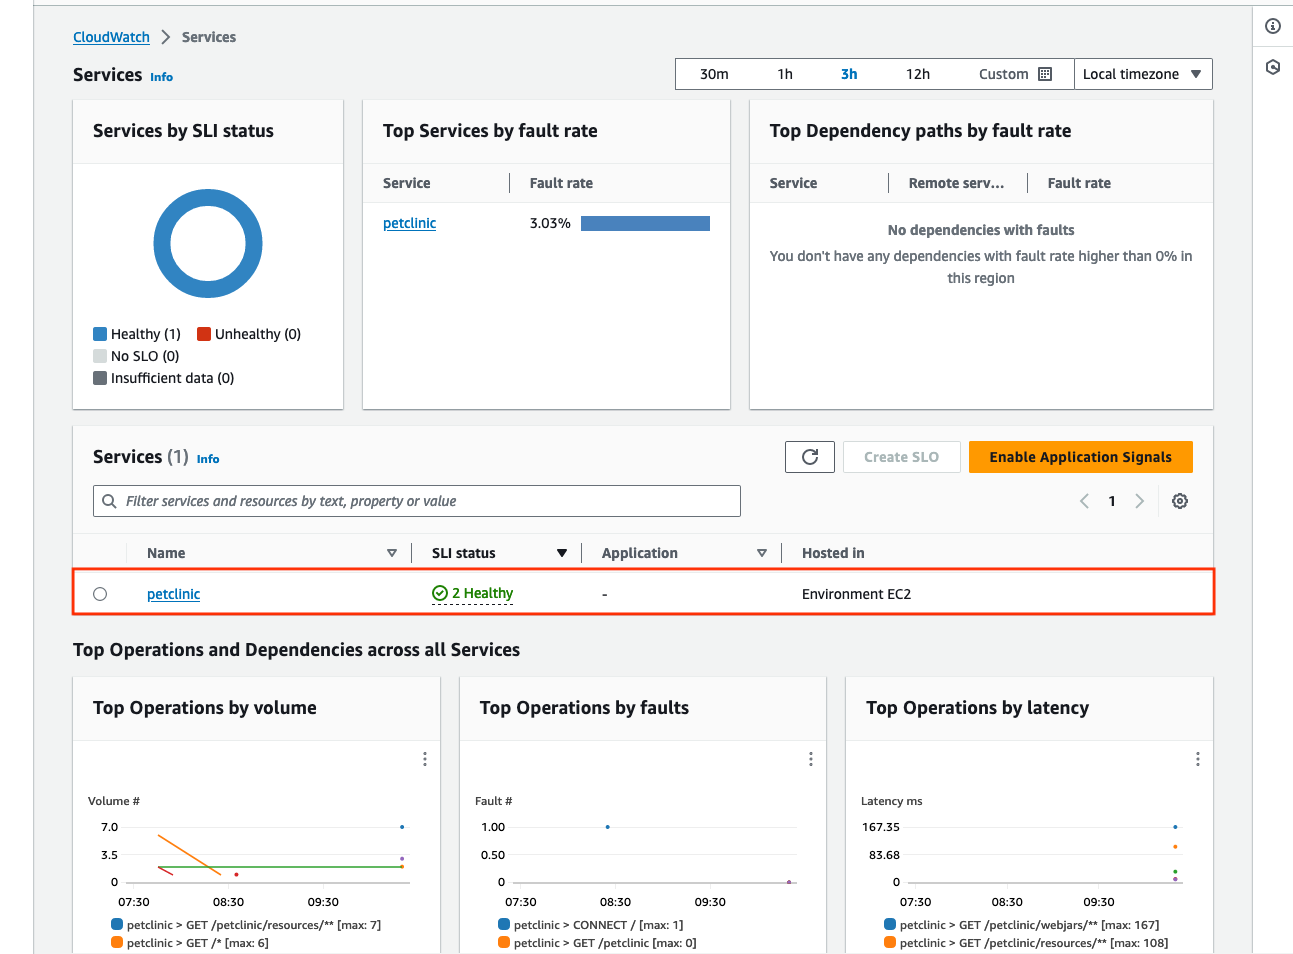
Figure 2: Services Dashboard
Detailed Service Information and Dependencies
The Service detail page displays an overview of your services, operations, dependencies, canaries, and client requests for a single service that has been enabled for Application Signals. To view this page, open the CloudWatch console, choose Services under the Application Signals section in the left navigation pane, and choose the name of any service from the Services table or the Top services or dependency tables.
As shown in Figure 3, the Service Overview page summarizes the components that make up your service, and highlights key performance metrics to help you identify issues that require troubleshooting.
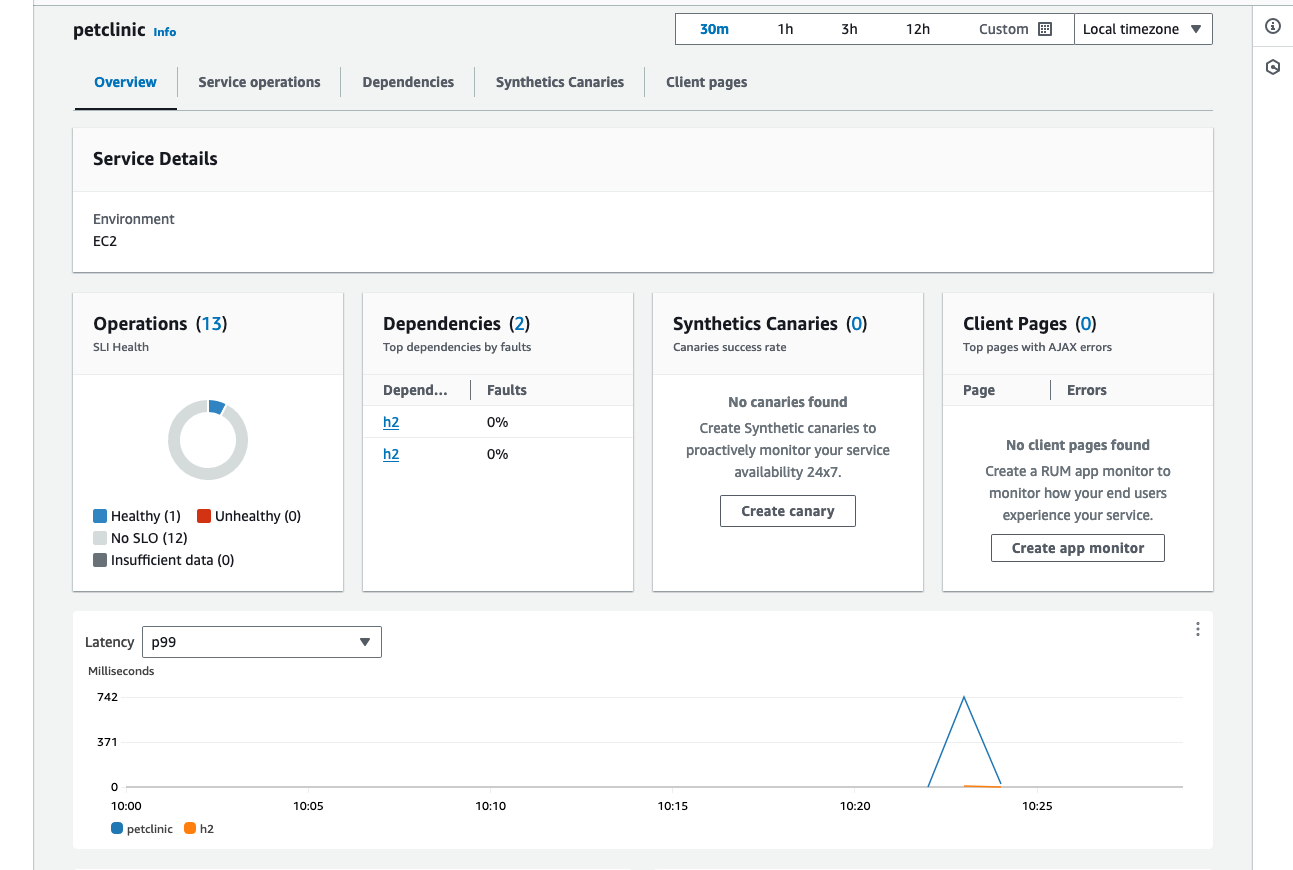
Figure 3: Services Overview
Choose the Service operations tab to display the Service operations table, and a set of metrics for the selected operation. The table contains a list of operations discovered by Application Signals. This list includes service level indicator (SLI) status, number of dependencies, and metrics for latency, volume, faults, errors, and availability, as shown in the Figure 4.
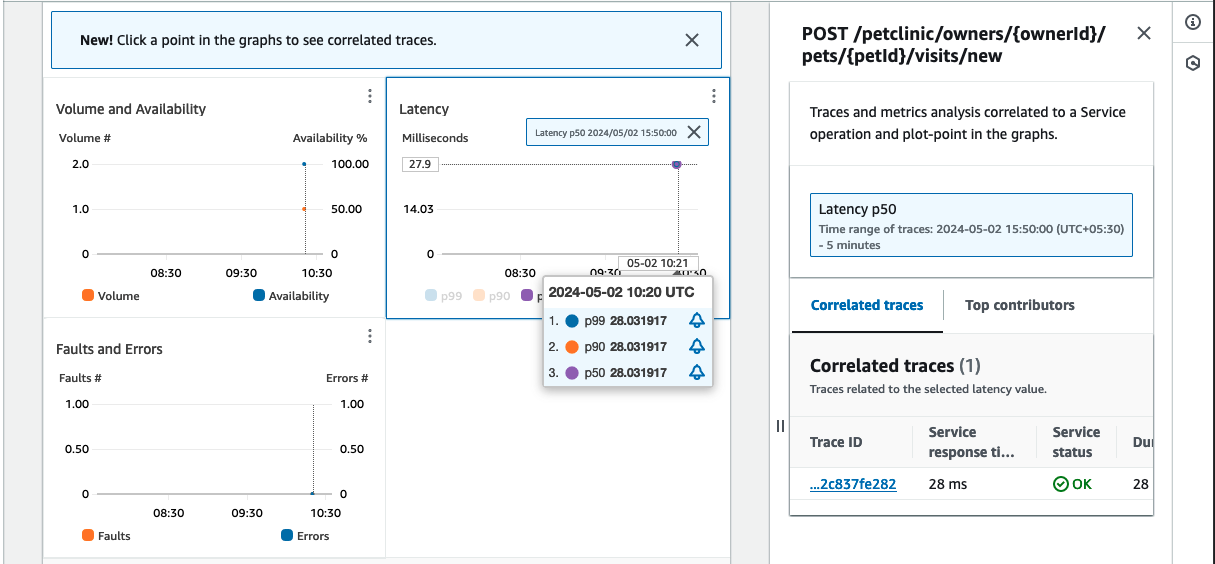
Figure 4: View your Service operations
Application Signals correlates service operation metrics with AWS X-Ray traces, making it easier to troubleshoot operational health issues. Select a point on the metric graph to open a diagnostic drawer that shows correlated traces for the selected point in the graph. Choose a trace ID from the Correlated traces table to open the X-Ray Trace details page for the chosen trace.
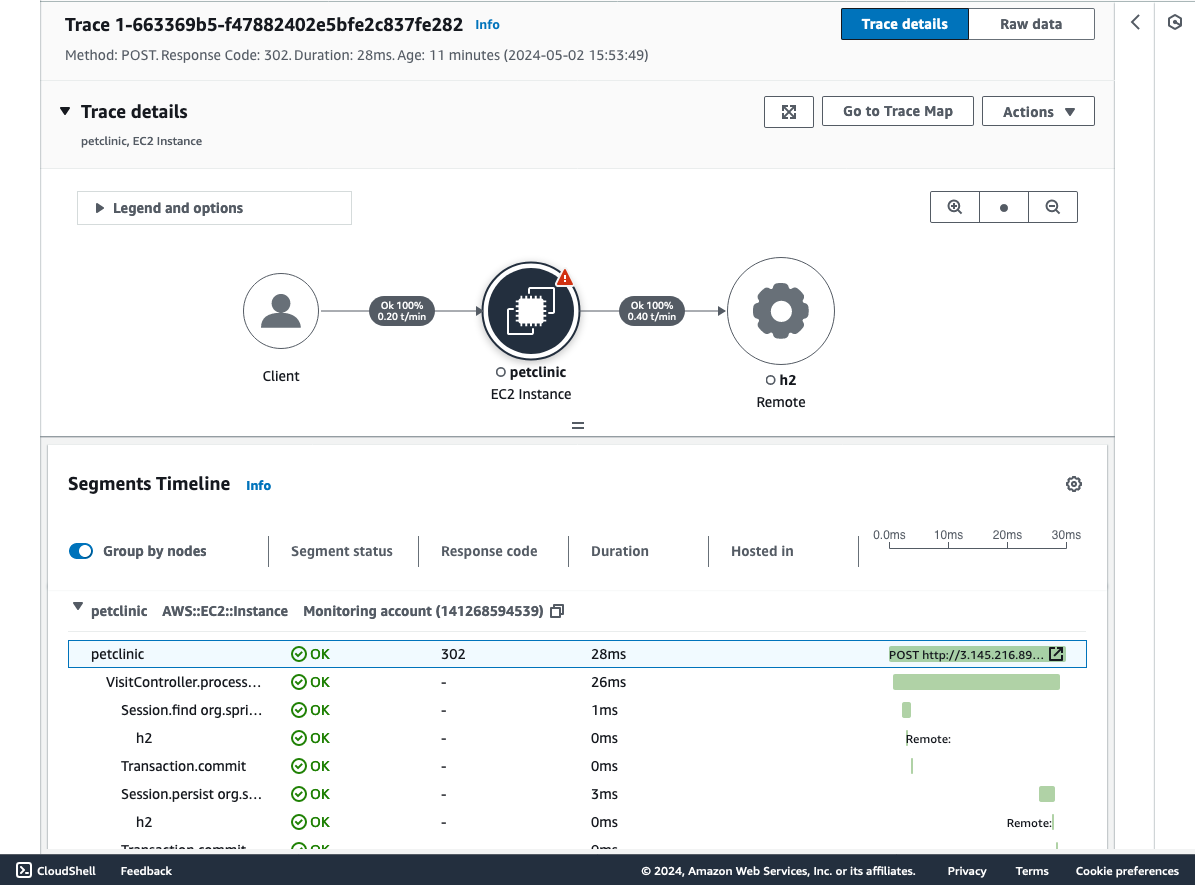
Figure 5: Visualize traces correlated with Service operation metrics
With few clicks you find the correlated trace and also understand the root cause of the issue without having to manually query traces separately.
Service level objectives (SLOs)
You can use Application Signals to create service level objectives for the services for your critical business operations. By creating SLOs on these services, you will be able to track them on the SLO dashboard, giving you an at-a-glance view of your most important operations.
Follow the Create an SLO steps to create SLOs for PetClinic application.
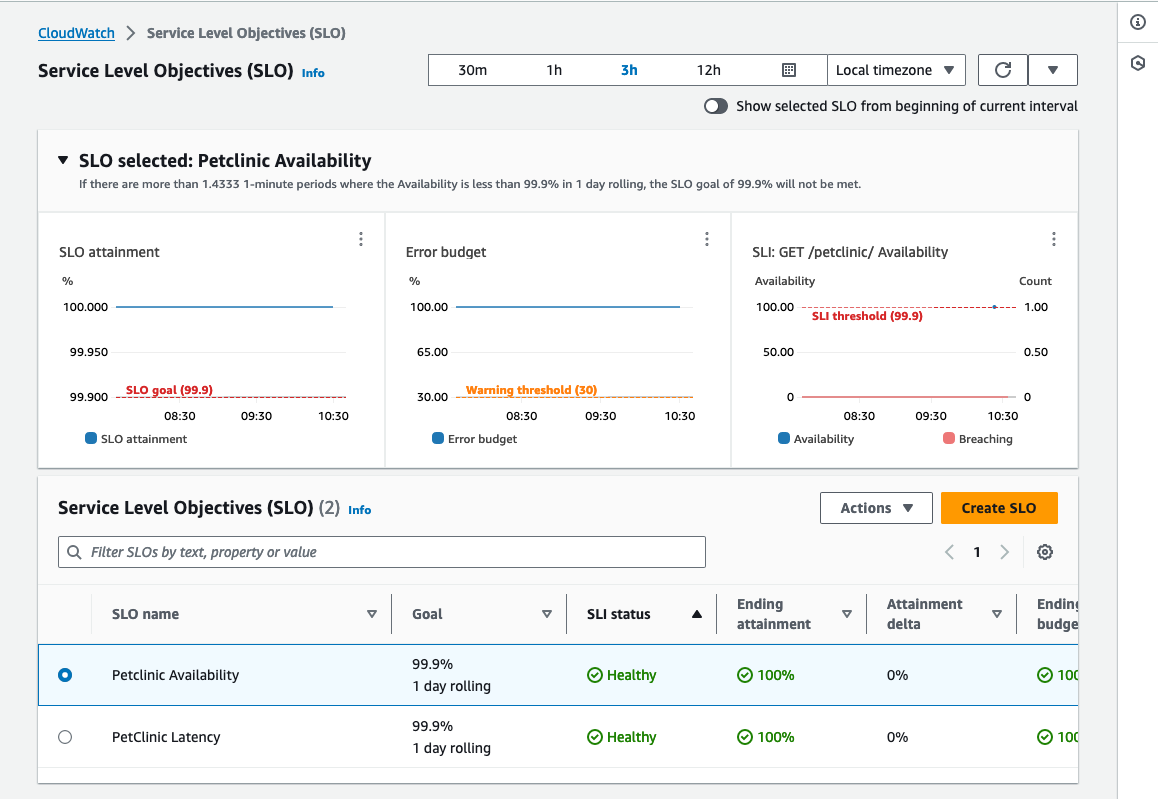
Figure 6: Create and visualize Service Level Objectives (SLOs)
Visualizing Tomcat access and server logs
The Tomcat access and server logs are being pushed to Log groups using CloudWatch agent. To view these logs navigate to CloudWatch console and choose Log groups under Logs section on the left navigation pane. Filter the Log groups using tomcat prefix as shown in Figure 7.
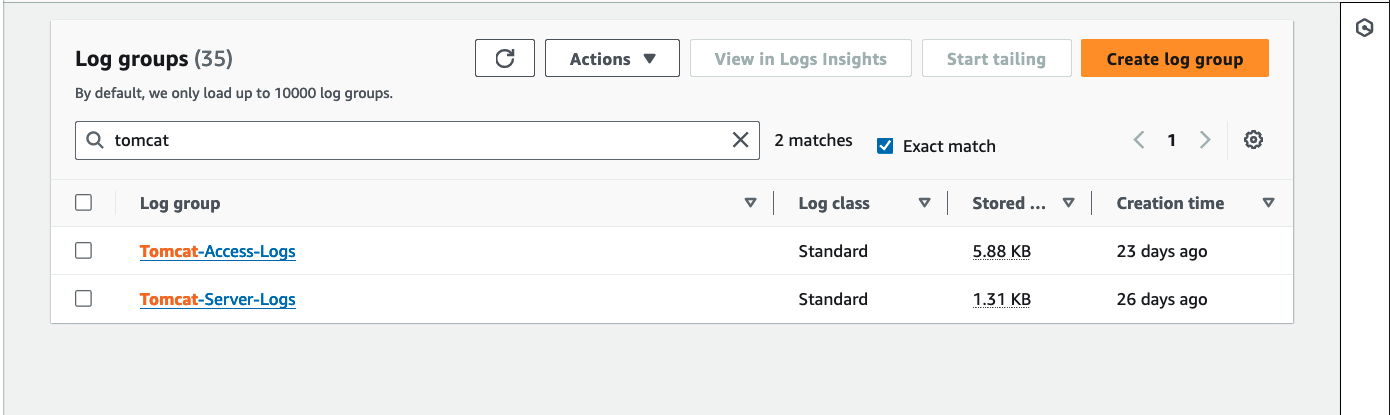
Figure 7: Tomcat Access and Server Log groups
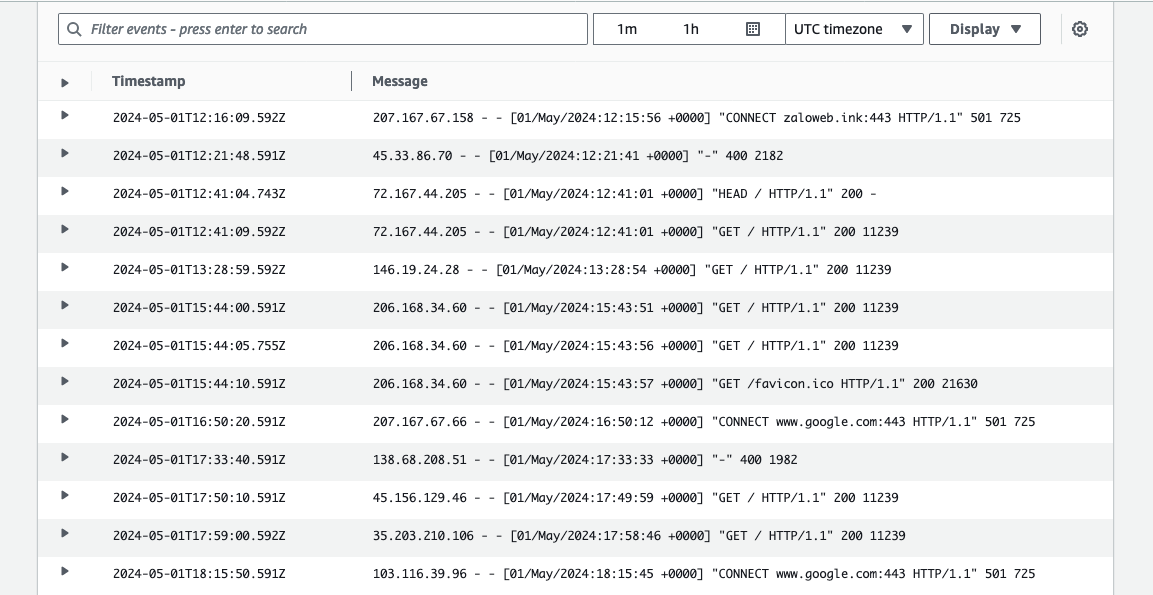
Figure 8: Visualize Tomcat Access log events
From here, you can try out the following features to gain valuable insights from your Tomcat logs:
- Query and analyse your logs using CloudWatch Logs Insights
- Use metric filters to monitor log events by creating metrics
- Use Live Tail to view and debug logs in near real time
Cleaning up
Clean up the following resources in order to stop incurring future charges:
Conclusion
In this blog post, you learned how to use CloudWatch Application Signals (Preview) to automatically instrument Java web applications packed as WAR file running on Tomcat server. Application Signals helps you to easily see the performance of applications on AWS, spot anomalies, and identify the root cause of application issues without needing to manually instrument the applications.
By harnessing these insights, your team can proactively identify and address performance bottlenecks, thereby enhancing the reliability and overall end-user experience of their applications. Implement Application Signals in your environment.
Please refer to the CloudWatch Application Signals documentation to explore more information or check out the CloudWatch Applications Signals use case in the One Observability Workshop for hands-on experience.