AWS Partner Network (APN) Blog
Why Next-Generation MSPs Need Next-Generation Monitoring
 We wrote a couple of months ago about how ISVs are rapidly evolving their capabilities and products to meet the growing needs of next generation Managed Service Providers (MSPs), and we heard from Cloud Health Technologies about how they are Enabling Next-Generation MSPs with cloud management tools that span the breadth of customer engagements from Plan & Design to Build & Migrate to Run & Operate and to Optimize. Today we are sharing a guest post from APN Advanced Technology and SaaS Partner, Datadog, as they address the shift from traditional to next gen monitoring and how these capabilities elevate the level of value that an MSP can deliver to their customers.
Let’s hear from Emily Chang, Technical Author at Datadog.
Why Next-Generation MSPs Need Next-Generation Monitoring
To stay competitive in today’s ever-changing IT landscape, managed service providers (MSPs) need to demonstrate that they can consistently deliver high-performance solutions for their customers. Rising to that challenge is nearly impossible without the help of a comprehensive monitoring platform that provides insights into customers’ complex environments.
Many next-generation MSPs team with Datadog to gain insights into their customers’ cloud-based infrastructure and applications. In this article, we’ll highlight a few of the ways that MSPs use Datadog’s monitoring and alerting capabilities to proactively manage their customers’ increasingly dynamic and elastic workloads with
- Full visibility into rapidly scaling infrastructure and applications.
- Alerting that automatically detects abnormal changes.
- Analysis of historical data to gain insights and develop new solutions.
- Continuous compliance in an era of infrastructure-as-code.
Full visibility into rapidly scaling infrastructure and applications
As companies continuously test and deploy new features and applications, MSPs need to be prepared to monitor just about any type of environment and technology at a moment’s notice. Whether their customers are running containers, VMs, bare-metal servers, or all of the above, Datadog provides visibility into all of these components in one place.
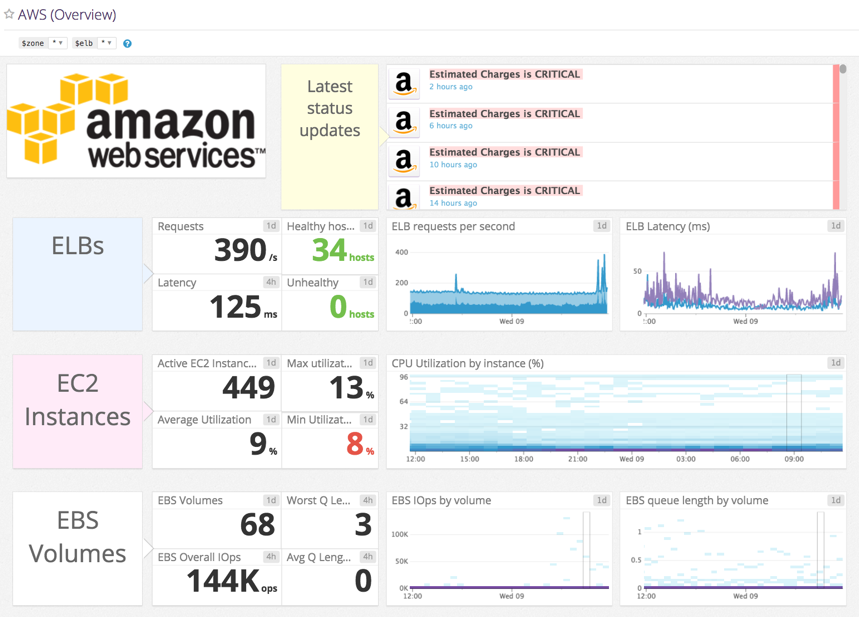
Datadog’s integration for Amazon Web Services (AWS) automatically collects default and custom Amazon CloudWatch metrics from dozens of AWS services, including Amazon Elastic Compute Cloud (Amazon EC2), Elastic Load Balancing, and Amazon Relational Database Service (Amazon RDS). In total, Datadog offers more than 200 turn-key integrations with popular infrastructure technologies. Many integrations include default dashboards that display key health and performance metrics, such as the AWS overview dashboard shown below.
MSPs need the ability to monitor every dimension of their customers’ modern applications—as well as their underlying infrastructure. As customers continuously deploy new features and applications in the cloud, MSPs can consult a global overview of the infrastructure with Datadog, and then drill down into application-level issues with Application Performance Monitoring (APM), without needing to switch contexts. Datadog APM traces individual requests across common libraries and frameworks, and enables users to identify and investigate bottlenecks and errors by digging into interactive flame graphs like this one:
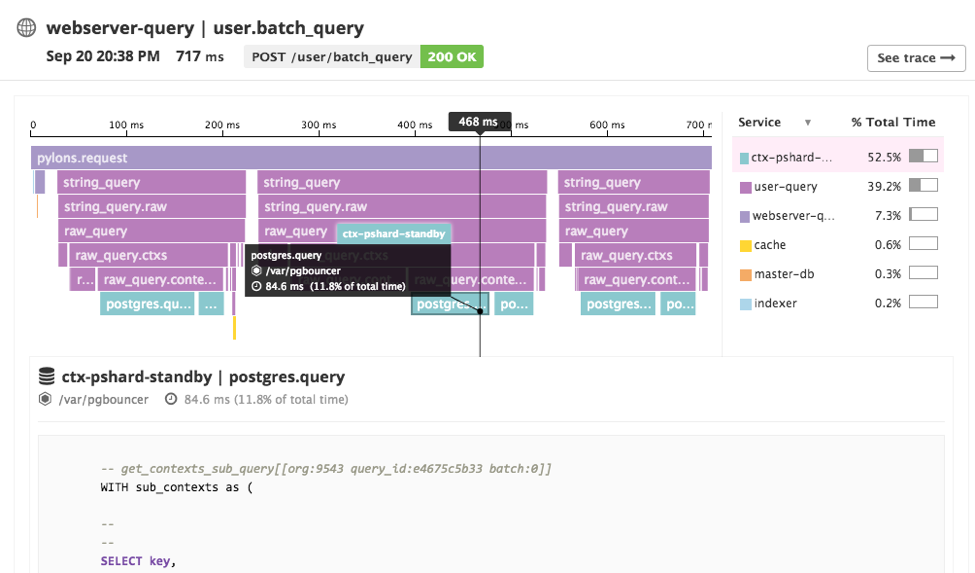
Infrastructure-aware APM gives MSPs full-stack observability for their customers’ applications, which is critical for troubleshooting bottlenecks in complex environments.
Alerting that automatically detects abnormal changes
Because today’s dynamic cloud environments are constantly in a state of flux, MSPs can benefit immensely from sophisticated alerts that can distinguish abnormal deviations from normal, everyday fluctuations. As customers’ infrastructure rapidly scales to accommodate changing workloads, what constitutes a normal/healthy threshold often will need to scale accordingly. Customers may also wish to track critical business metrics, such as transactions processed, which often exhibit normal, user-driven fluctuations that correlate with the time of day or the day of the week.
Both of these scenarios explain why threshold-based alerts, while helpful for many types of metrics, are not ideal solutions for detecting more complex issues with modern-day applications. To accommodate these challenges, next-generation MSPs need a monitoring solution that uses machine learning to automatically detect issues in their customers’ metrics. Datadog’s anomaly detection algorithms are designed to distinguish between normal and abnormal trends in metrics while accounting for directional trends, such as a steady increase in transaction volume over time and seasonal fluctuations.
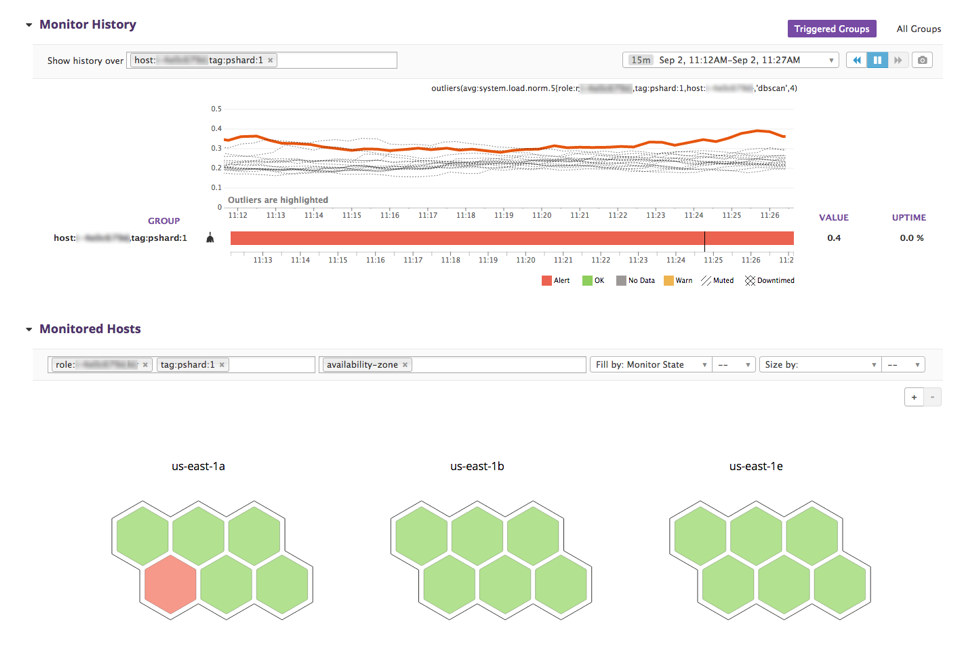
Datadog also uses machine learning for outlier detection—algorithms that determine when a host or group of hosts behaves differently from its peers. This effectively enables MSPs to make sense of how resources are being used within a customer’s infrastructure, even as it rapidly scales to accommodate varying workloads. Whenever an outlier monitor is triggered, MSPs can consult the monitor status page, like the one shown below, to quickly understand when the outlier was detected, and which component(s) of the infrastructure it may impact.
Analyzing historical data to gain insights and develop new solutions
As their customers’ environments scale and grow increasingly complex, MSPs need an effective way to visualize how all of those components change over time. For historical analysis, all data is retained at full granularity for 15 months. This allows MSPs to analyze how their customers’ infrastructure and applications have evolved and develop strategies that help them make strategic decisions going forward. In addition to visualizing AWS services and other common infrastructure technologies in default dashboards, MSPs can create custom visualizations that deliver deeper insights into their metrics. These visualizations include:
- Trend lines: Use regression functions to visualize metric trends
- Change graphs: Display how a metric’s value has changed compared to a point in the past (an hour ago, a week ago, etc.)
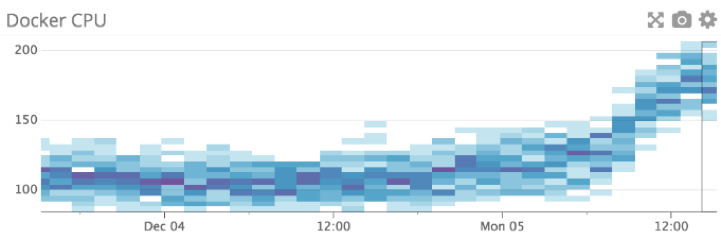
- Heat maps: Use color intensity to identify patterns and deviations across many separate entities. In the example below, a Datadog heat map shows Docker CPU usage steadily trending upward across a large ensemble of containers
Ensuring continuous compliance in an era of infrastructure-as-code
Infrastructure-as-code has revolutionized the way that organizations deploy new assets and manage their existing resources, enabling them to become more agile, continuously deploy new features, and quickly scale resources to respond to changing workloads. However, as these tools are more widely adopted, they also require organizations to monitor their assets more carefully, in order to meet compliance requirements.
Datadog integrates with key infrastructure-as-code tools like Chef, Puppet, and Ansible to provide MSPs with a real-time record of configuration changes to each customer’s infrastructure. Datadog also ingests AWS CloudTrail logs to help MSPs track API calls made across AWS services and aggregates them in the event stream for easy reference. In the example below, you can see that CloudTrail reports any successful and failed logins to the AWS Management Console, as well as any EC2 instances that have been terminated—and who terminated them.
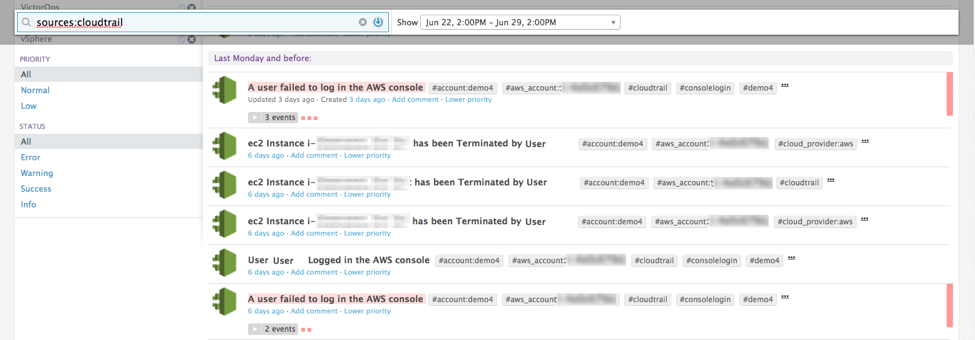
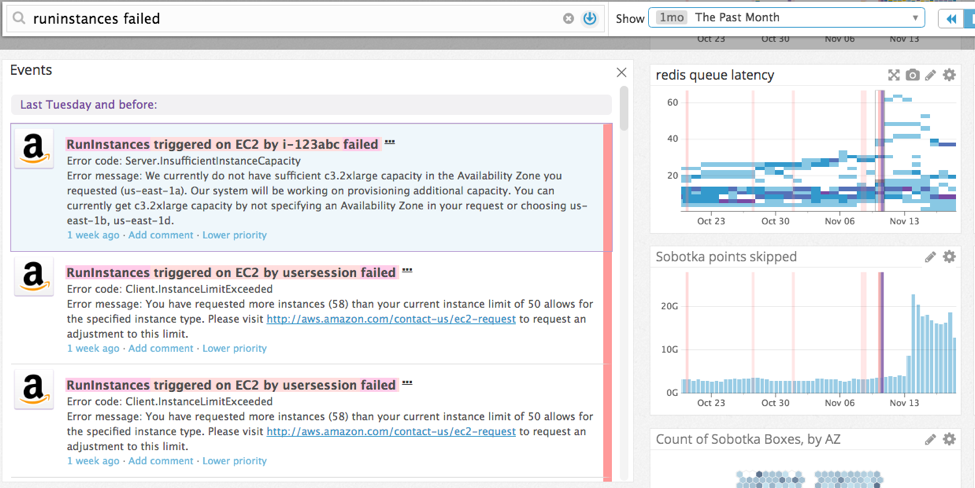
With all of this data readily available, MSPs can track critical changes as they occur in real time and set up monitors to proactively audit and enforce continuous compliance of their customers’ AWS environments. They can also search and filter for specific types of changes in the event stream and then overlay them on dashboards for correlation analysis, as shown below.
Event-based alerts help MSPs automatically detect unexpected changes and/or immediately notify their customers about events that may endanger compliance requirements. These alerts can also be configured to trigger actions in other services through custom webhooks. By making all of this information available in one central location, Datadog prepares MSPs with the data they need to respond quickly to compliance issues.
Next steps for next-generation MSPs
Datadog is pleased to be able to provide monitoring capabilities that help MSPs navigate the challenges of delivering high-performance solutions for dynamic infrastructure and applications. To learn more about how Datadog helps fulfill AWS MSP Partner Program checklist items needed to apply for the AWS Managed Service Program, download our free eBook. You can also view a recording of our recent webinar with AWS and CloudHesive, “What is Means to be a Next-Generation Managed Service Provider” here.