AWS News Blog
IoT Analytics Now Generally Available
Today, I’m pleased to announce that, as of April 24th 2018, the AWS IoT Analytics service is generally available. Customers can use IoT Analytics to clean, process, encrich, store, and analyze their connected device data at scale. AWS IoT Analytics is now available in US East (N. Virginia), US West (Oregon), US East (Ohio), and Europe (Ireland). In November of last year, my colleague Tara Walker wrote an excellent post that walks through some of the features of the AWS IoT Analytics service and Ben Kehoe (an AWS Community Hero and Research Scientist at iRobot) spoke at AWS Re:Invent about replacing iRobot’s existing “rube goldberg machine” for forwarding data into an elasticsearch cluster with AWS IoT Analytics.
Iterating on customer feedback received during the service preview the AWS IoT Analytics team has added a number of new features including the ability to ingest data from external souces using the BatchPutMessage API, the ability to set a data retention policy on stored data, the ability to reprocess existing data, preview pipeline results, and preview messages from channels with the SampleChannelData API.
Let’s cover the core concepts of IoT Analytics and then walk through an example.
AWS IoT Analytics Concepts
AWS IoT Analytics can be broken down into a few simple concepts. For data preparation customers have: Channels, Pipelines, and Data Stores. For analyzing data customers have: Datasets and Notebooks.
Data Preparation
- Channels are the entry point into IoT Analytics and they collect data from an existing IoT Core MQTT topic or from external sources that send messages to the channel using the Ingestion API. Channels are elastically scalable and consume messages in Binary or JSON format. Channels also immutably store raw device data for easily reprocessing using different logic if your needs change.
- Pipelines consume messages from channels and allow you to process messages with steps, called activities, such as filtering on attributes, transforming the content of the message by adding or remvoing fields, invoking lambda functions for complex transformations and adding data from external data sources, or even enriching the messages with data from IoT Core. Pipelines output their data to a Data Store.
- Data Stores are a queryable IoT-optimized data storage solution for the output of your pipelines. Data stores support custom retention periods to optimize costs. When a customer queries a Data Store the result is put into a Dataset.
Data Analytics
- Datasets are similar to a view in a SQL database. Customers create a dataset by running a query against a data store. Data sets can be generated manually or on a recurring schedule.
- Notebooks are Amazon SageMaker hosted Jupyter notebooks that let customers analyze their data with custom code and even build or train ML models on the data. IoT Analytics offers several notebook templates with pre-authored models for common IoT use cases such as Predictive Maintenance, Anomaly Detection, Fleet Segmentation, and Forecasting.
Additionally, you can use IoT analytics as a data source for Amazon QuickSight for easy visualizations of your data. You can find pricing information for each of these services on the AWS IoT Analytics Pricing Page.
IoT Analytics Walkthrough
While this walkthrough uses the console everything shown here is equally easy to do with the CLI. When we first navigate to the console we have a helpful guide telling us to build a channel, pipeline, and a data store:

Our first step is to create a channel. I already have some data into an MQTT channel with IoT core so I’ll select that channel. First we’ll name the channel and select a retention period.

Now, I’ll select my IoT Core topic and grab the data. I can also post messages directly into the channel with the PutMessages APIs.

Now that I have a channel my next step is to create a pipeline. To do this I’ll select “Create a pipeline from this channel” from the “Actions” drop down.

Now, I’ll walk through the pipeline wizard giving my pipeline a name and a source.

I’ll select which of the message attributes the pipeline should expect. This can draw from the channel with the sampling API and guess at which attributes are needed or I could upload a specification in JSON.

Next I define the pipeline activities. If I’m dealing with binary data I need a lambda function to first deserialize the message into JSON so the other filter functions can operate on it. I can create filters, calculate attributes based on other attributes, and I can also enrich the message with metadata from IoT core registry.

For now I just want to filter out some messages and make a small transform with a Lambda function.

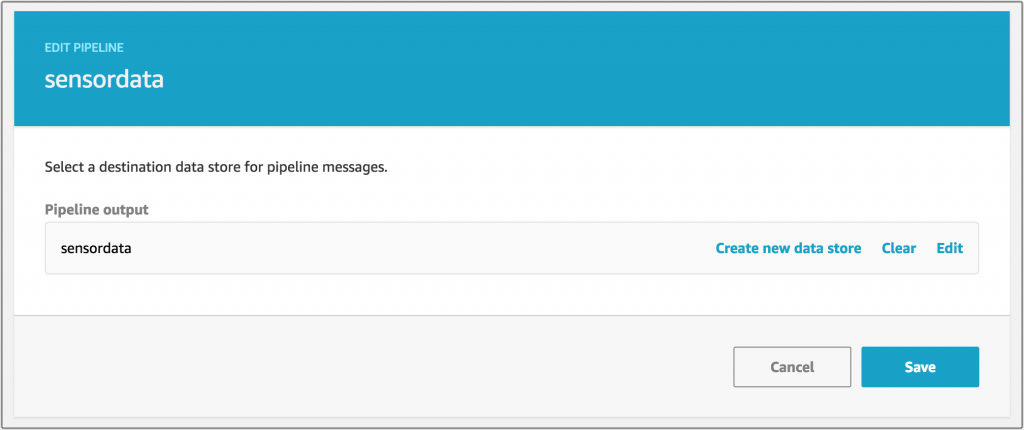
Finally, I choose or create a data store to output the results of my pipeline.
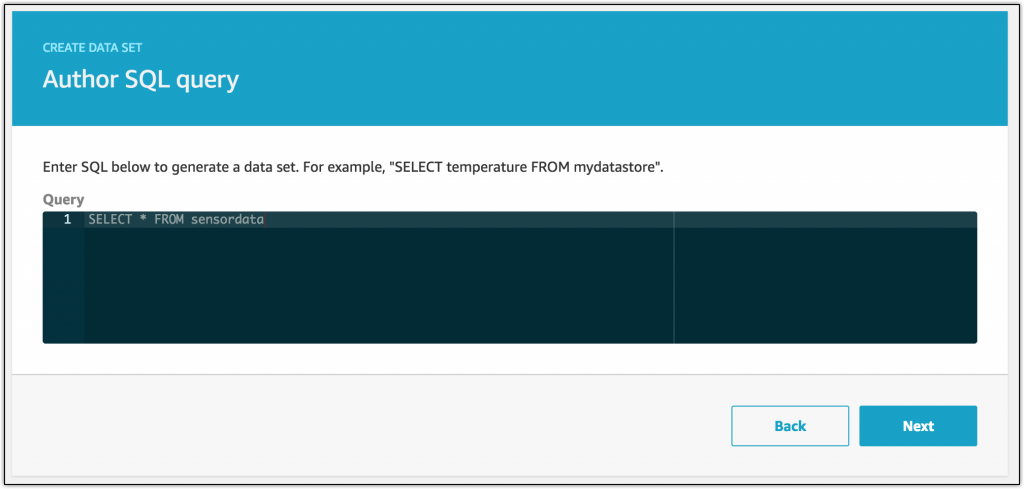
Now that I have a data store, I can create a view of that data by creating a data set.

I’ll just select all the data from the data store for this dataset but I could also select individual attributes as needed.
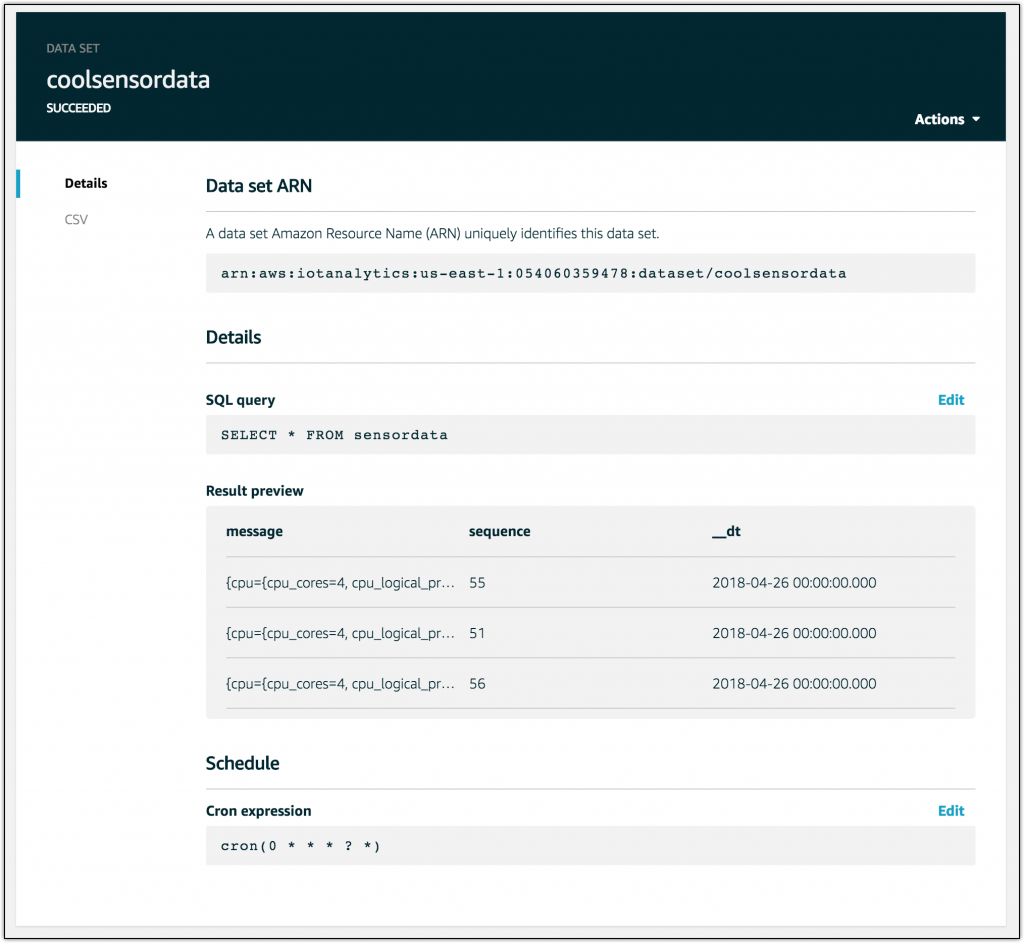
I have a data set! I can adjust the cron expression in the schedule to re-run this as frequently or infrequently as I wish.
If I want to create a model from my data I can create a SageMaker powered Jupyter notebook. There are a few templates that are great starting points like anomaly detection or output forecasting.

Here you can see an example of the anomaly detection notebook.

Finally, if I want to create simple visualizations of my data I can use QuickSight to bring in an IoT Analytics data set.

Let Us Know
I’m excited to see what customers build with AWS IoT Analytics. My colleagues on the IoT teams are eager to hear your feedback about the service so please let us know in the comments or on Twitter what features you want to see.
– Randall