AWS News Blog
New AWS Console Feature – Improved Access to CloudWatch Alarms
We’ve added some features to the AWS Management Console to make it easier for you to create, view, and manage your Amazon CloudWatch Alarms. Here’s a visual overview.
Creating Alarms
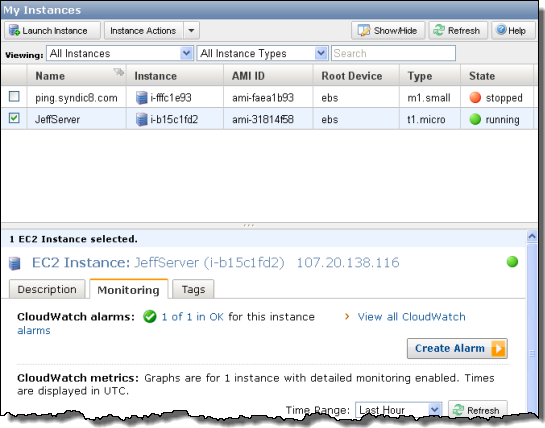
You can now create a new CloudWatch alarm from the Monitoring tab of the selected EC2 instance or EBS volume using the Create Alarm button:
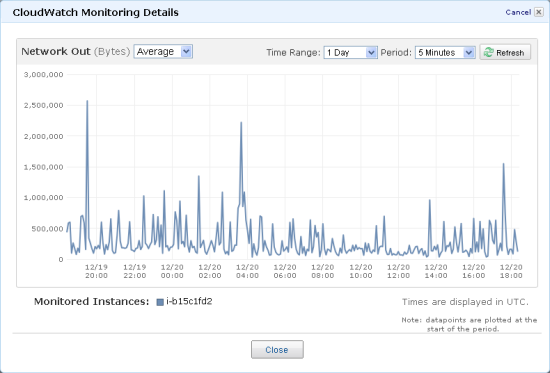
Let’s say I want to know when the Network Out traffic for my JeffServer instance exceeds 1.5 Megabytes within a 5 minute period (this instance hosts personal blogs for me and several members of my family, along with some other random web sites, none of which see a whole lot of traffic). I chose this number after inspecting the detailed graph for this metric on this instance:
A click of the Create Alarm button takes me to the new Create Alarm dialog. I can choose the metric and the time interval, and I can also choose the notification method:
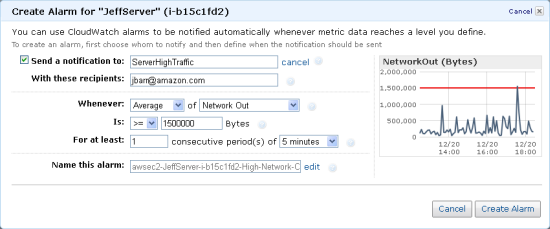
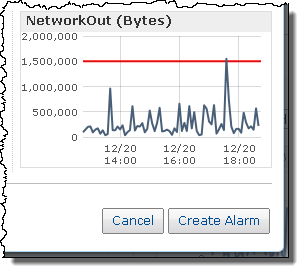
I can choose to send notifications to an existing SNS topic, create a new topic, or to a list of email addresses. If I choose the latter option, CloudWatch will automatically create an SNS topic with a suitable name and subscribe the email addresses to the topic. The dialog displays the alarm threshold using a red line superimposed on the actual metrics data:
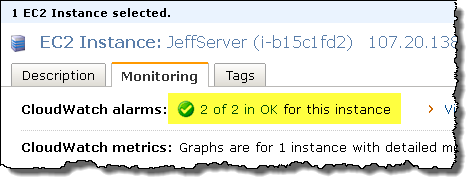
The Monitoring tab now displays a summary of the alarms for the selected instance (highlighting added):
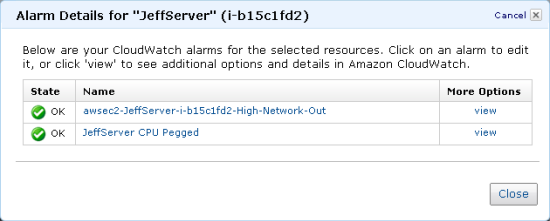
Clicking on the summary displays a list of alarms:
We hope that you enjoy (and make use of) this handy new feature!
— Jeff;