AWS News Blog
New – Upload AWS Cost & Usage Reports to Redshift and QuickSight
Many AWS customers have been asking us for a way to programmatically analyze their Cost and Usage Reports (read New – AWS Cost and Usage Reports for Comprehensive and Customizable Reporting for more info). These customers are often using AWS to run multiple lines of business, making use of a wide variety of services, often spread out across multiple regions. Because we provide very detailed billing and cost information, this is a Big Data problem and one that can be easily addressed using AWS services!
While I was on vacation earlier this month, we launched a new feature that allows you to upload your Cost and Usage reports to Amazon Redshift and Amazon QuickSight. Now that I am caught up, I’d like to tell you about this feature.
Upload to Redshift
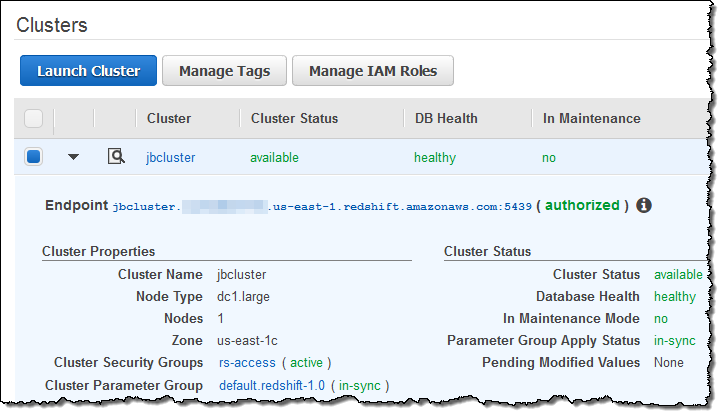
I started by creating a new Redshift cluster (if you already have a running cluster, you need not create another one). Here’s my cluster:
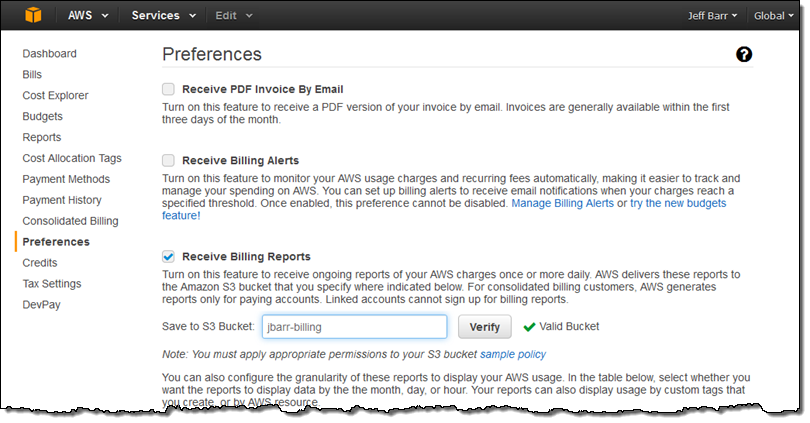
Next, I verified that I had enabled the Billing Reports feature:
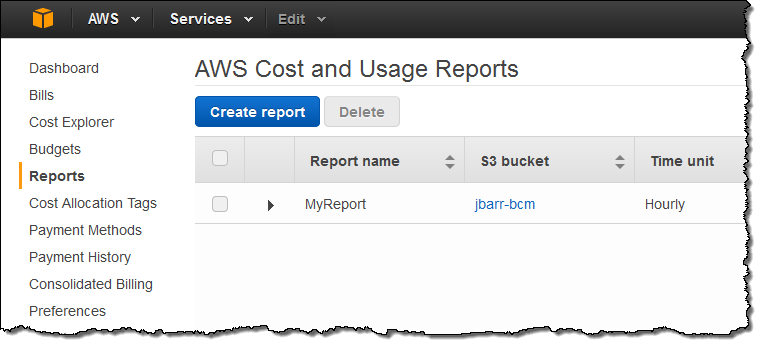
Then I hopped over to the Cost and Billing Reports and clicked on Create report:
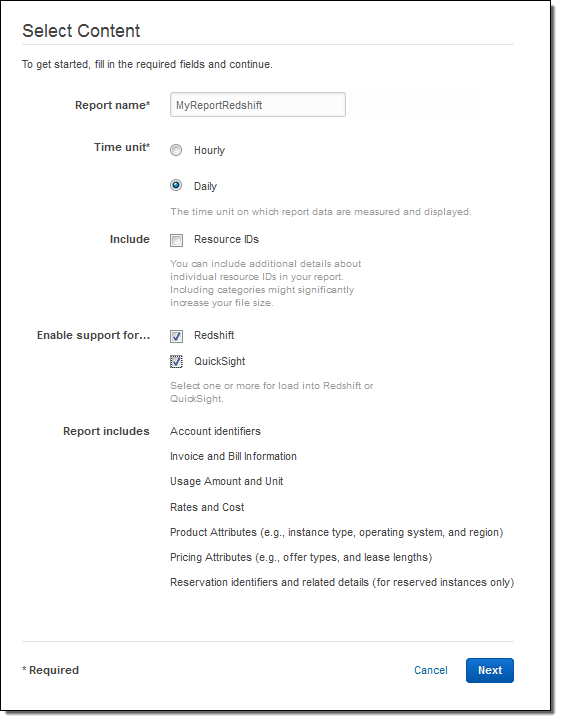
Next, I named my report (MyReportRedshift), made it Hourly, and enabled support for both Redshift and QuickSight:
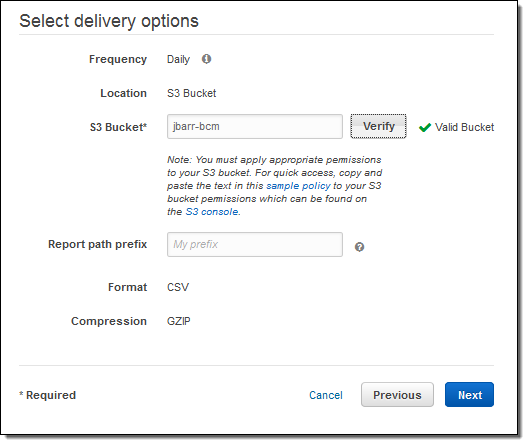
I wrapped things up by selecting my delivery options:
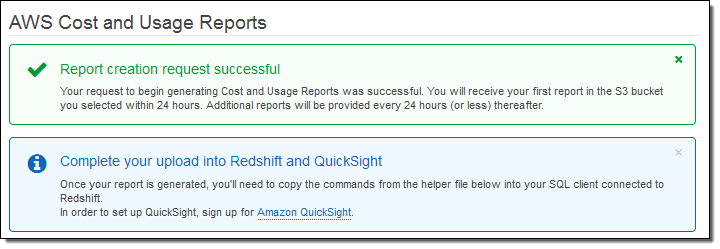
I confirmed my desire to create a report on the next page, and then clicked on Review and Complete. The report was created and I was informed that the first report would arrive in the bucket within 24 hours:
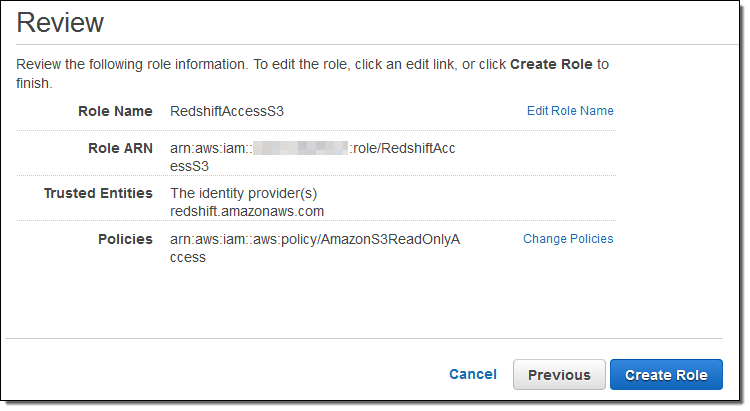
While I was waiting I installed PostgreSQL on my EC2 instance (sudo yum install postgresql94) and verified that I was signed up for the Amazon QuickSight preview. Also, following the directions in Create an IAM Role, I made a read-only IAM role and captured its ARN:
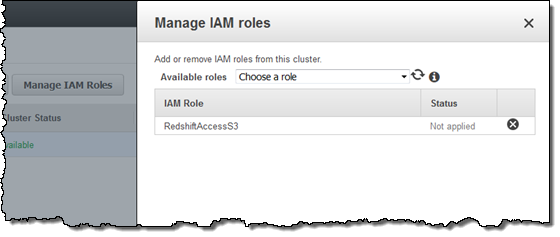
Back in the Redshift console, I clicked on Manage IAM Roles and associated the ARN with my Redshift cluster:
The next day, I verified that the files were arriving in my bucket as expected, and then returned to the console in order to retrieve a helper file so that I could access Redshift:
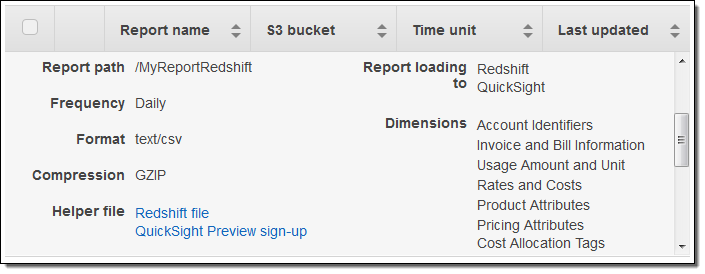
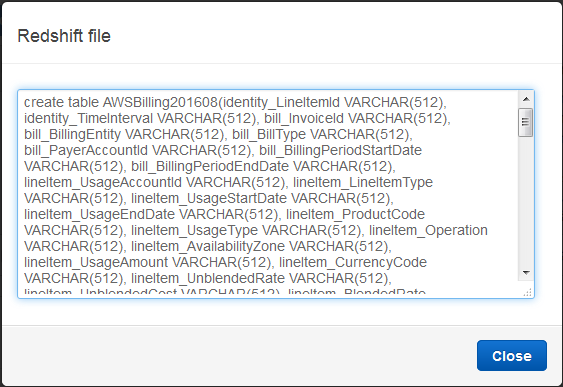
I clicked on Redshift file and then copied the SQL command:
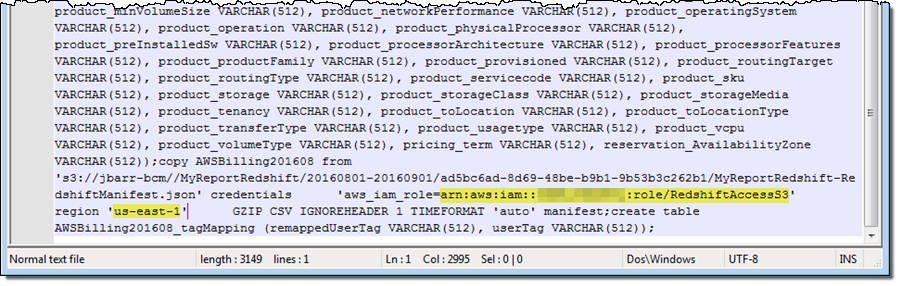
I inserted the ARN and the S3 region name into the SQL (I had to add quotes around the region name in order to make the query work as expected):
And then I connected to Redshift using psql (I can use any visual or CLI-based SQL client):
$ psql -h jbcluster.XYZ.us-east-1.redshift.amazonaws.com \
  -U root -p 5439 -d dev
Then I ran the SQL command. It created a pair of tables and imported the billing data from S3.
Querying Data in Redshift
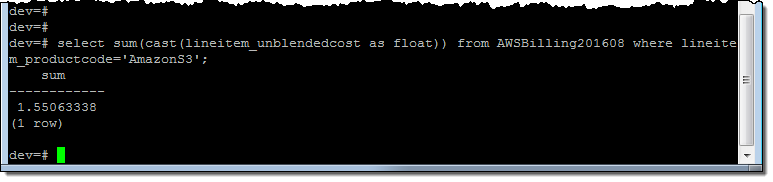
Using some queries supplied by my colleagues as a starting point, I summed up my S3 usage for the month:
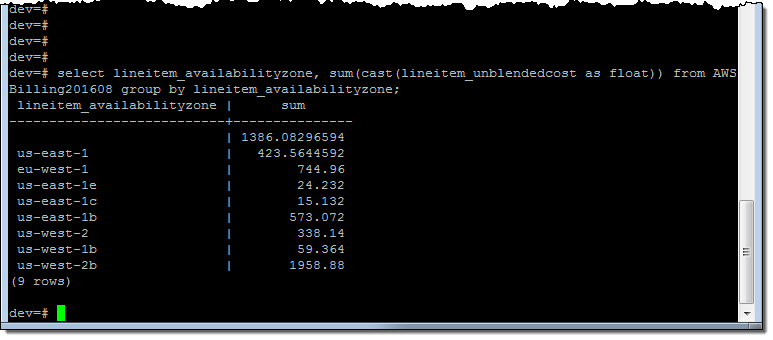
And then I looked at my costs on a per-AZ basis:
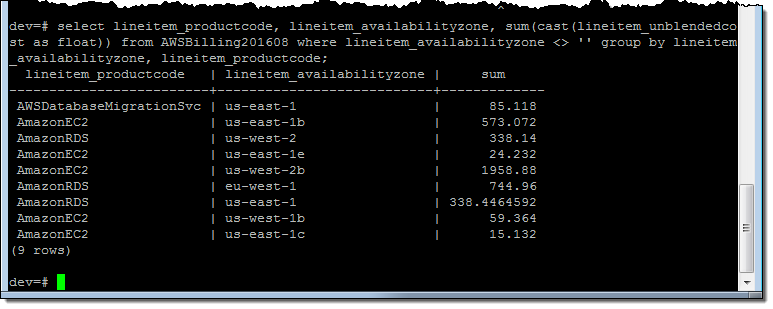
And on a per-AZ, per-service basis:
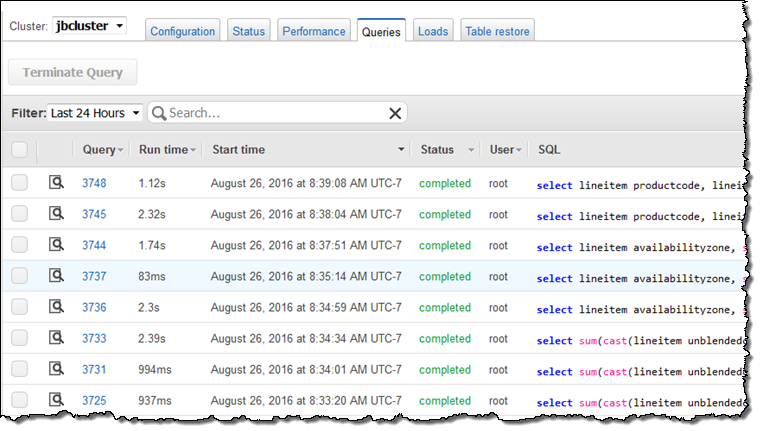
 Just for fun, I spent some time examining the Redshift Console. I was able to see all of my queries:
Analyzing Data with QuickSight
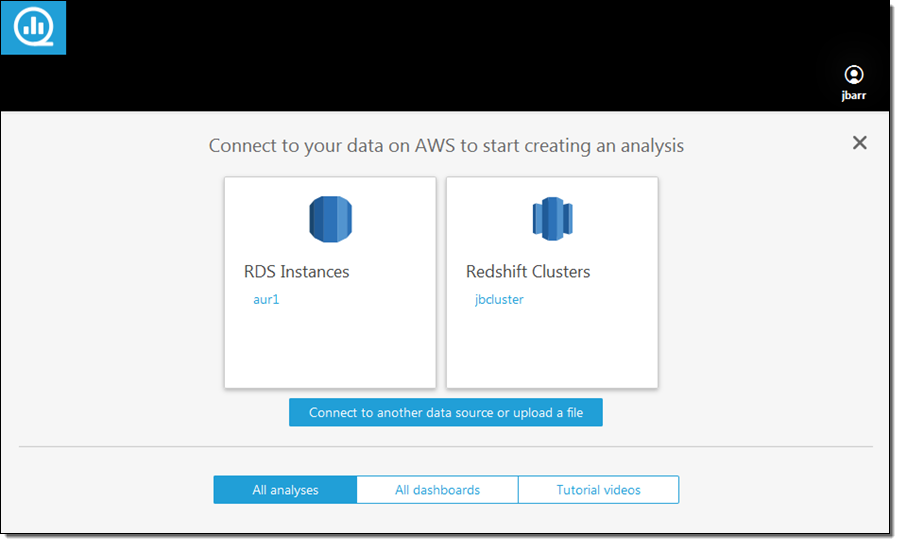
I also spent some time analyzing the cost and billing data using Amazon QuickSight. I signed in and clicked on Connect to another data source or upload a file:
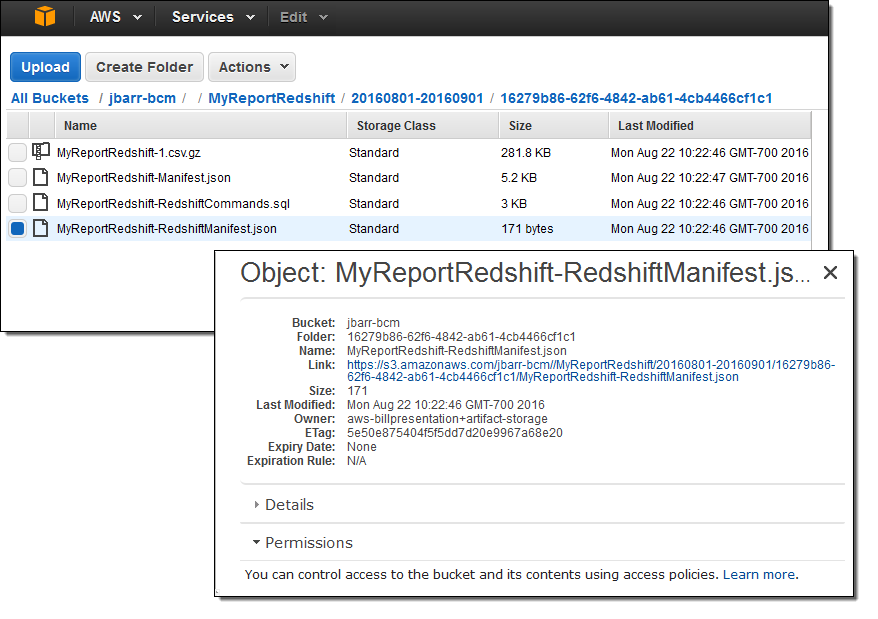
Then I dug in to my S3 bucket (jbarr-bcm) and captured the URL of the manifest file (MyReportRedshift-RedshiftManifest.json):
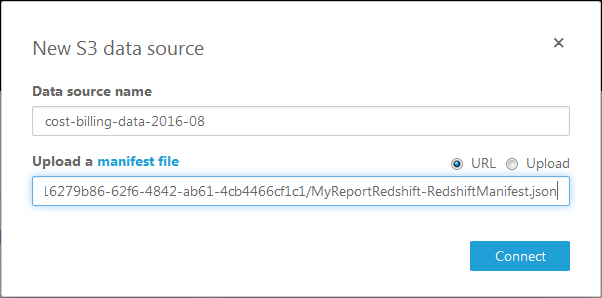
I selected S3 as my data source and entered the URL:
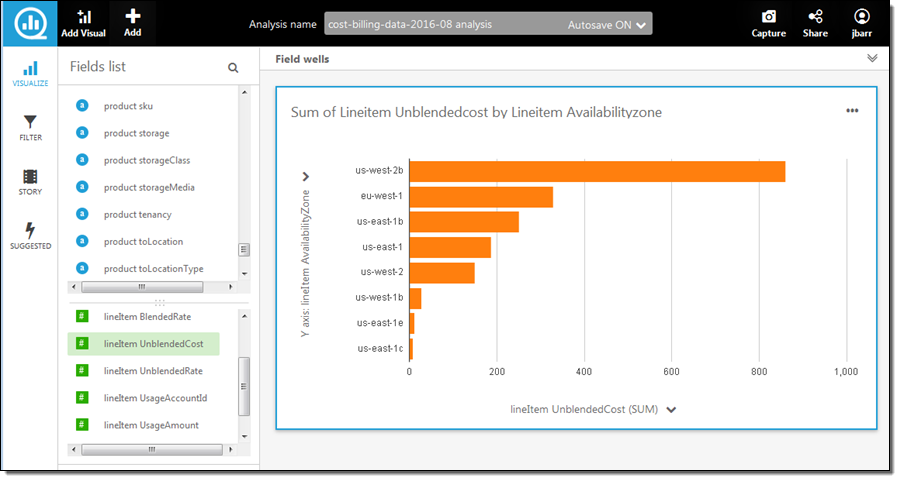
QuickSight imported the data in a few seconds and the new data source was available. I loaded it into SPICE (QuickSight’s in-memory calculation engine). With three or four more clicks I focused on the per-AZ data, and excluded the data that was not specific to an AZ:
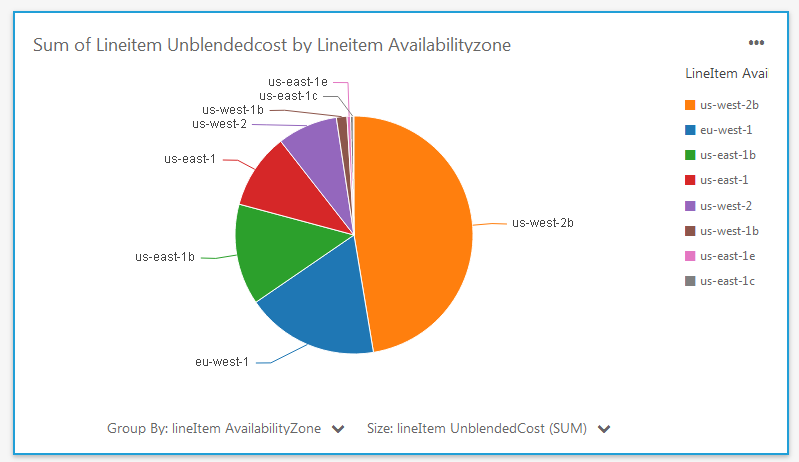
Another click and I switched to a pie chart view:
I also examined the costs on a per-service basis:
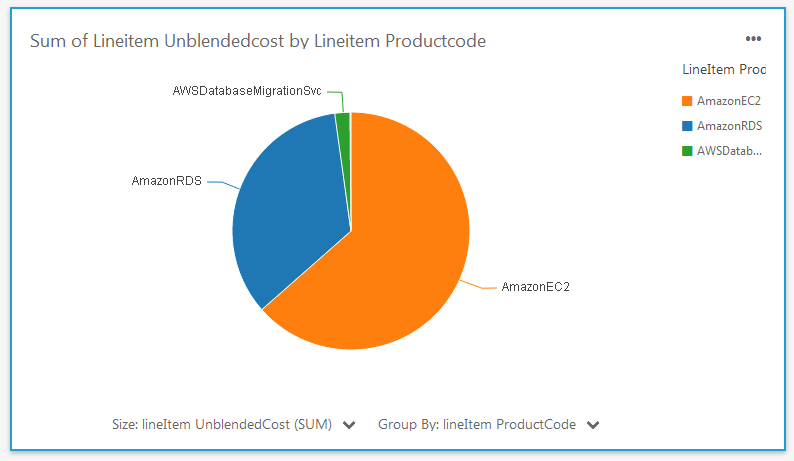
As you can see, the new data and the analytical capabilities of QuickSight allow me (and you) to dive deep into your AWS costs in minutes.
Available Now
This new feature is available now and you can start using it today!
— Jeff;