AWS News Blog
New – AWS Cost and Usage Reports for Comprehensive and Customizable Reporting
Many of our customers have been asking us for data and tools to allow them to better understand and manage their AWS costs.
New Reports
Today we are introducing a set of new AWS Cost and Usage Reports that provide you with comprehensive data about products, pricing, and usage. The reports allow you to understand individual costs and to analyze them in greater detail. For example, you can view your EC2 costs by instance type and then drill-down in order to understand usage by operating system, instance type, and purchase option (On-Demand, Reserved, or Spot).
The new reports are generated in CSV form and can be customized. You can select the data included in each report, decide whether you want it aggregated across an hour or a day, and then request delivery to one of your S3 buckets, with your choice of ZIP or GZIP compression. The data format is normalized so that each discrete cost component is presented in an exclusive column.
You can easily upload the reports to Amazon Redshift and then run queries against the data using business intelligence and data visualization tools including Amazon QuickSight.
Creating a Report
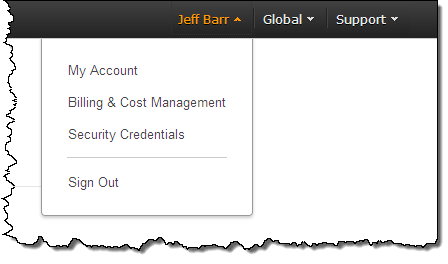
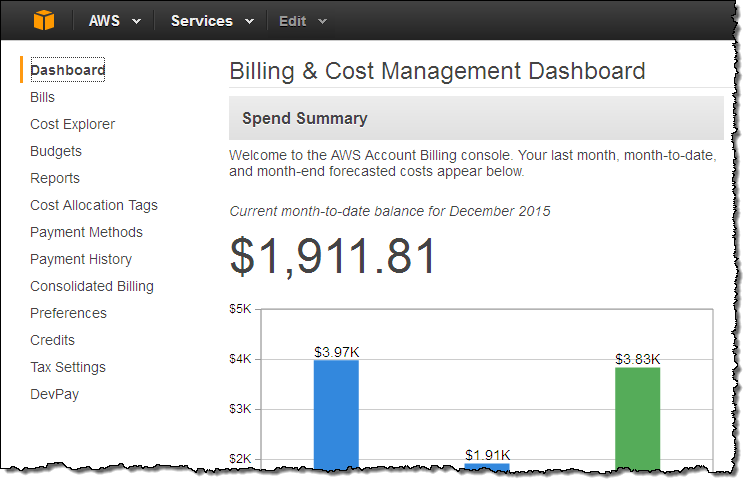
To create a report, head on over to the AWS Management Console, and choose Billing & Cost Management from the menu in the top-right:
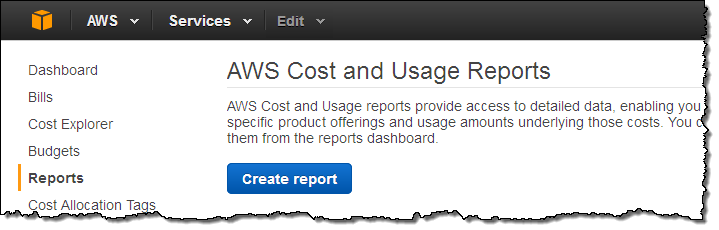
 Then click on Reports in the left navigation:
Click on Create report to create your first report:
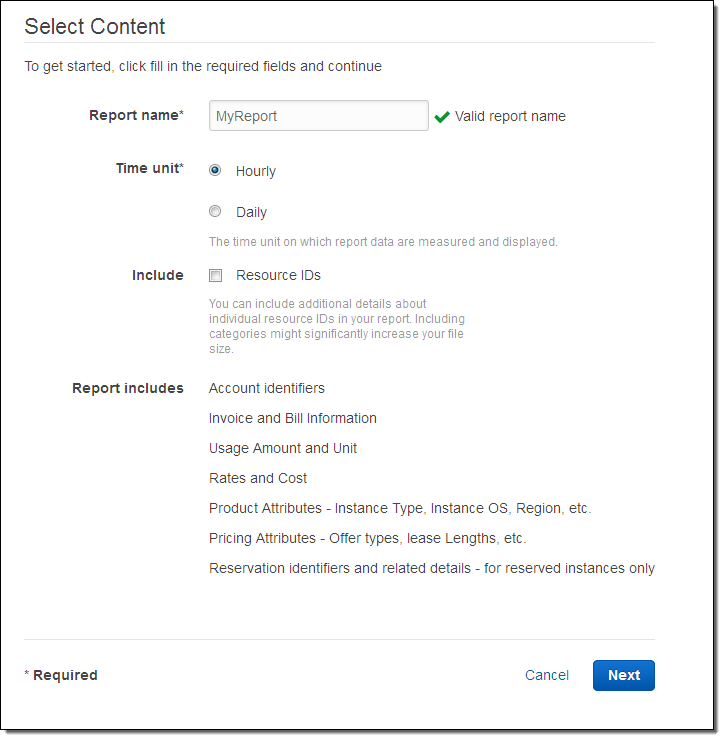
Enter a name for your report, pick a time unit, and decide whether you want to include Resource IDs (more detail and a bigger file) or not:
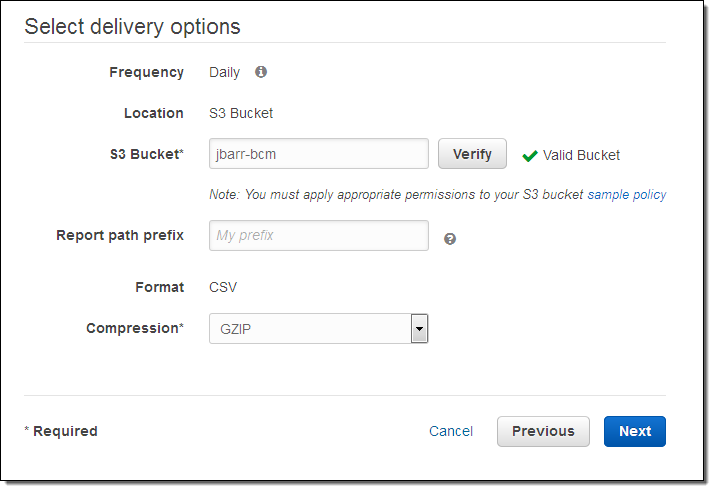
Now choose your delivery options: pick an S3 bucket (you’ll need to set the permissions per the sample policy), set a prefix if you’d like, and select the desired compression (GZIP or ZIP):
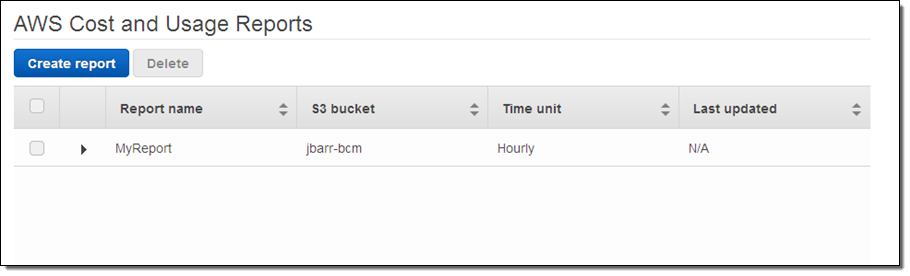
Click on Next, review your choices, and then create your report. It will become visible on the AWS Cost and Usage Reports page:
A fresh report will be delivered to the bucket within 24 hours. Additional reports will be provided every 24 hours (or less) thereafter.
From there you can transfer them to Amazon Redshift using a AWS Data Pipeline job or some code triggered by a AWS Lambda function, and then analyze them using the BI or data visualization tool of your choice.
Visualizing the Data
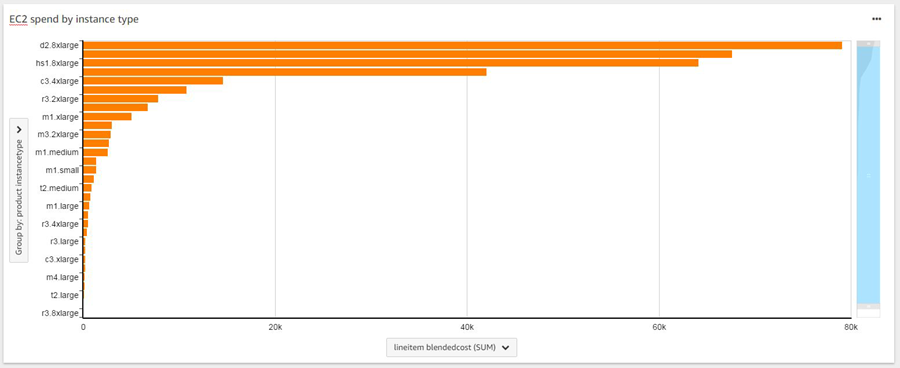
Here are some sample visualizations, courtesy of Amazon QuickSight. Looking at our EC2 spend by instance type gives an overall picture of our spending:
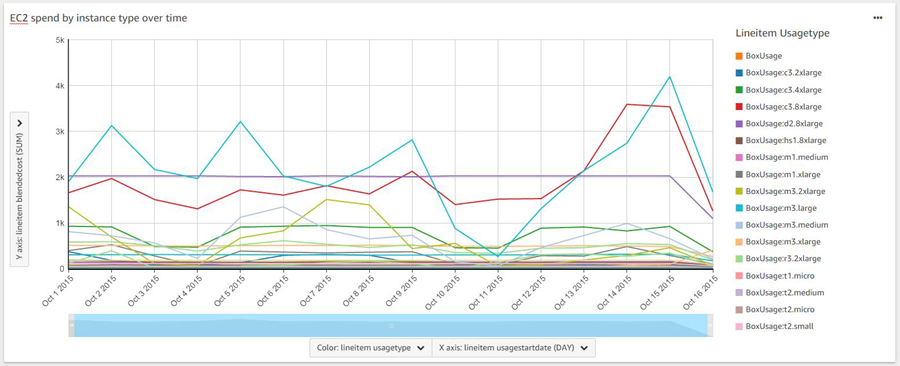
Viewing it over time shows that spending varies considerably from day to day:
Learn More
To learn more, read about Understanding Your Usage with Billing Reports.
— Jeff;