AWS News Blog
Using Enhanced RDS Monitoring with Datadog
Today’s guest post comes from K Young, Director of Strategic Initiatives at Datadog!
— Jeff;
AWS recently announced enhanced monitoring for Amazon RDS instances running MySQL, MariaDB, and Aurora. Enhanced monitoring includes over 50 new CPU, memory, file system, and disk I/O metrics which can be collected on a per-instance basis as frequently as once per second.
AWS and Datadog
AWS worked closely with Datadog to help customers send this new high-resolution data to Datadog for monitoring. Datadog is an infrastructure monitoring platform that is very popular with AWS customers—you can see historical trends with full granularity and also visualize and alert on live data from any part of your stack.
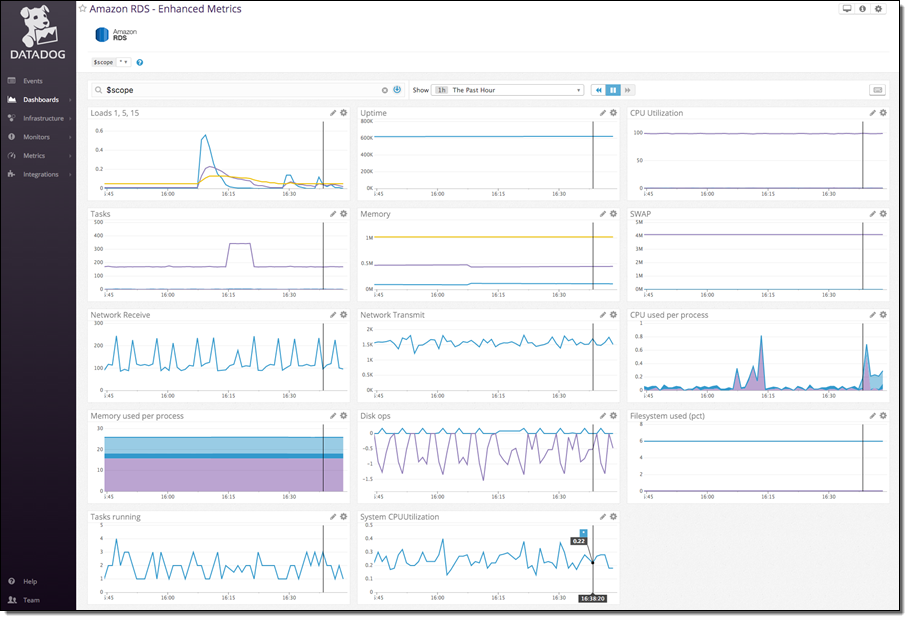
With a few minutes of work your enhanced RDS metrics will immediately begin populating a pre-built, customizable dashboard in Datadog:
Connect RDS and Datadog
The first step is to send enhanced RDS metrics to CloudWatch Logs. You can enable the metrics during instance creation, or on an existing RDS instance by selecting it in the RDS Console and then choosing Instance Options → Modify:
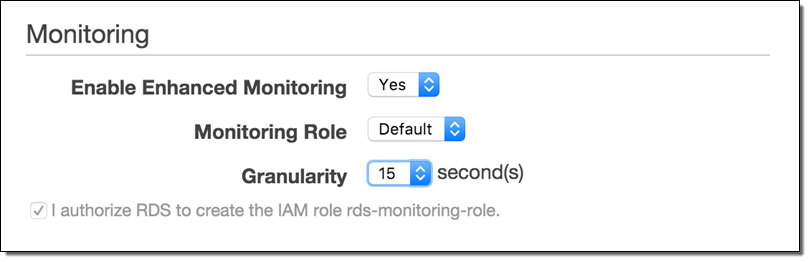
Set Granularity to 1–60 seconds; every 15 seconds is often a good choice. Once enabled, enhanced metrics will be sent to CloudWatch Logs.
The second step is to send the CloudWatch Log data to Datadog. Begin by setting up a Lambda function to process the logs and send the metrics:
- Create a role for your Lambda function. Name it something like
lambda-datadog-enhanced-rds-collectorand select AWS Lambda as the role type.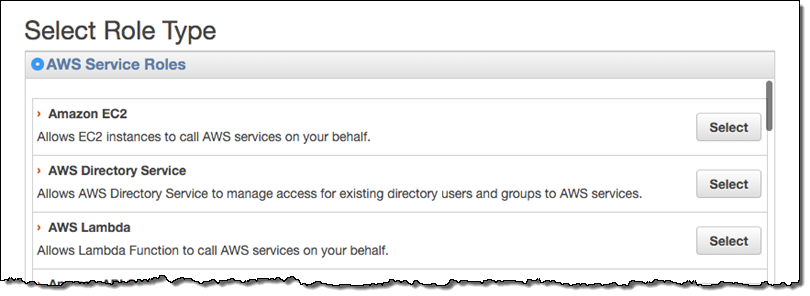
- From the Encryption Keys tab on the IAM Management Console, create a new encryption key. Enter an Alias for the key like
lambda-datadog-key. On the next page, add the appropriate administrators for the key. Next you’ll be prompted to add users to the key. Add at least two: yourself (so that you can encrypt the Datadog API key from the AWS CLI in the next step), and the role created above, e.g.lambda-datadog-enhanced-rds-collector(so that it can decrypt the API key and submit metrics to Datadog). Finish creating the key. - Encrypt the token using the AWS Command Line Interface (AWS CLI), providing the Alias of your just-created key (e.g.
lambda-datadog-key) as well as your Datadog keys, available here. Use KMS to encrypt your key, like this:$ aws kms encrypt --key-id alias/ALIAS_KEY_NAME --plaintext '{"api_key":"DATADOG_API_KEY", "app_key":"DATADOG_APP_KEY"}'Save the output of this command; you will need it for the next step.
- From the Lambda Management Console, create a new Lambda Function. Filter blueprints by datadog, and select the
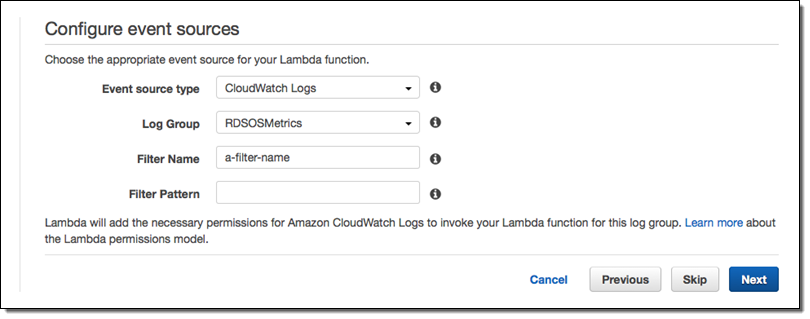
datadog-process-rds-metricsblueprint. - Choose RDSOSMetrics from the Log Group dropdown, enter the Filter Name of your choice, and go to the next page. If you have not yet enabled enhanced monitoring, you must do so before RDSOSMetrics will be presented an as option (see the instructions under Connect RDS and Datadog above):
- Give your function a name like
send-enhanced-rds-to-datadog. In the Lambda function code area, replace the string after KMS_ENCRYPTED_KEYS with the ciphertext blob part of the CLI command output above.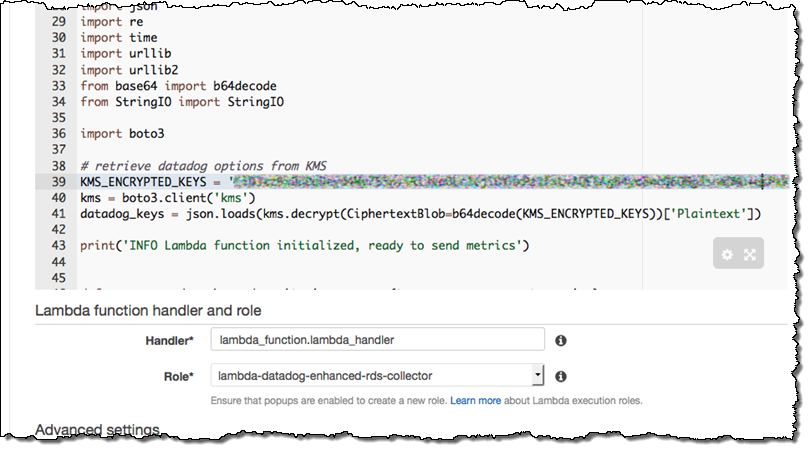
- Under Lambda function handler and role, choose the role you created in step 2, e.g.
lambda-datadog-enhanced-rds-collector. Go to the next page, select the Enable Now radio button, and create your function.
That’s It
Once you have enabled RDS in Datadog’s AWS integration tile, Datadog will immediately begin displaying your enhanced RDS metrics. Your RDS instances will be individually identifiable in Datadog via automatically-created tags of the form dbinstanceidentifier:YOUR_DB_INSTANCE_NAME, as well as any tags you added through the RDS console.
You can clone the pre-built dashboard and customize it however you want: add RDS metrics that are not displayed by default, or start correlating RDS metrics with the performance of the rest of your stack.
— K Young, Director of Strategic Initiatives