AWS Big Data Blog
Configure alerts of high CPU usage in applications using Amazon OpenSearch Service anomaly detection: Part 1
Amazon OpenSearch Service is a fully managed service that makes it easy to deploy, secure, and run Elasticsearch cost-effectively at scale. Amazon OpenSearch Service supports many use cases, including application monitoring, search, security information and event management (SIEM), and infrastructure monitoring. Amazon OpenSearch Service also offers a rich set of functionalities such as UltraWarm, fine-grained access control, alerting, and anomaly detection.
In this two-part post, we show you how to use anomaly detection in Amazon OpenSearch Service and configure alerts for high CPU usage in applications. In Part 1, we discuss how to set up your anomaly detector.
Solution overview
Anomaly detection in Amazon OpenSearch Service automatically detects anomalies in your Amazon OpenSearch Service data in near-real time by using the Random Cut Forest (RCF) algorithm. The RCF algorithm computes an anomaly grade and confidence score value for each incoming data point. Anomaly detection uses these values to differentiate an anomaly from normal variations in your data.
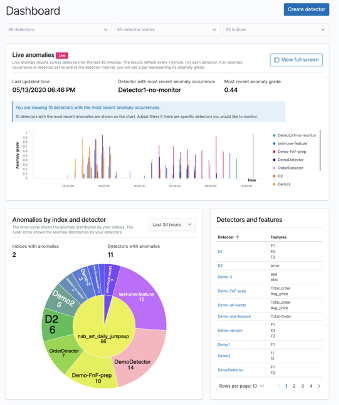
The following screenshot shows a sample anomaly history dashboard on the Amazon OpenSearch Service console.
You can configure anomaly detectors via the Amazon OpenSearch Service Kibana dashboard or API. The key elements for creating an anomaly detector are detector creation and model configuration. In the following steps, we create an anomaly detector for application log files with CPU usage data.
Create a detector
The first step in creating an anomaly detection solution is creating a detector. A detector is an individual anomaly detection task. You can have more than one detector, and they all can run simultaneously. To create your detector, complete the following steps:
- On the Anomaly detection dashboard inside your Kibana dashboard, choose Detectors.
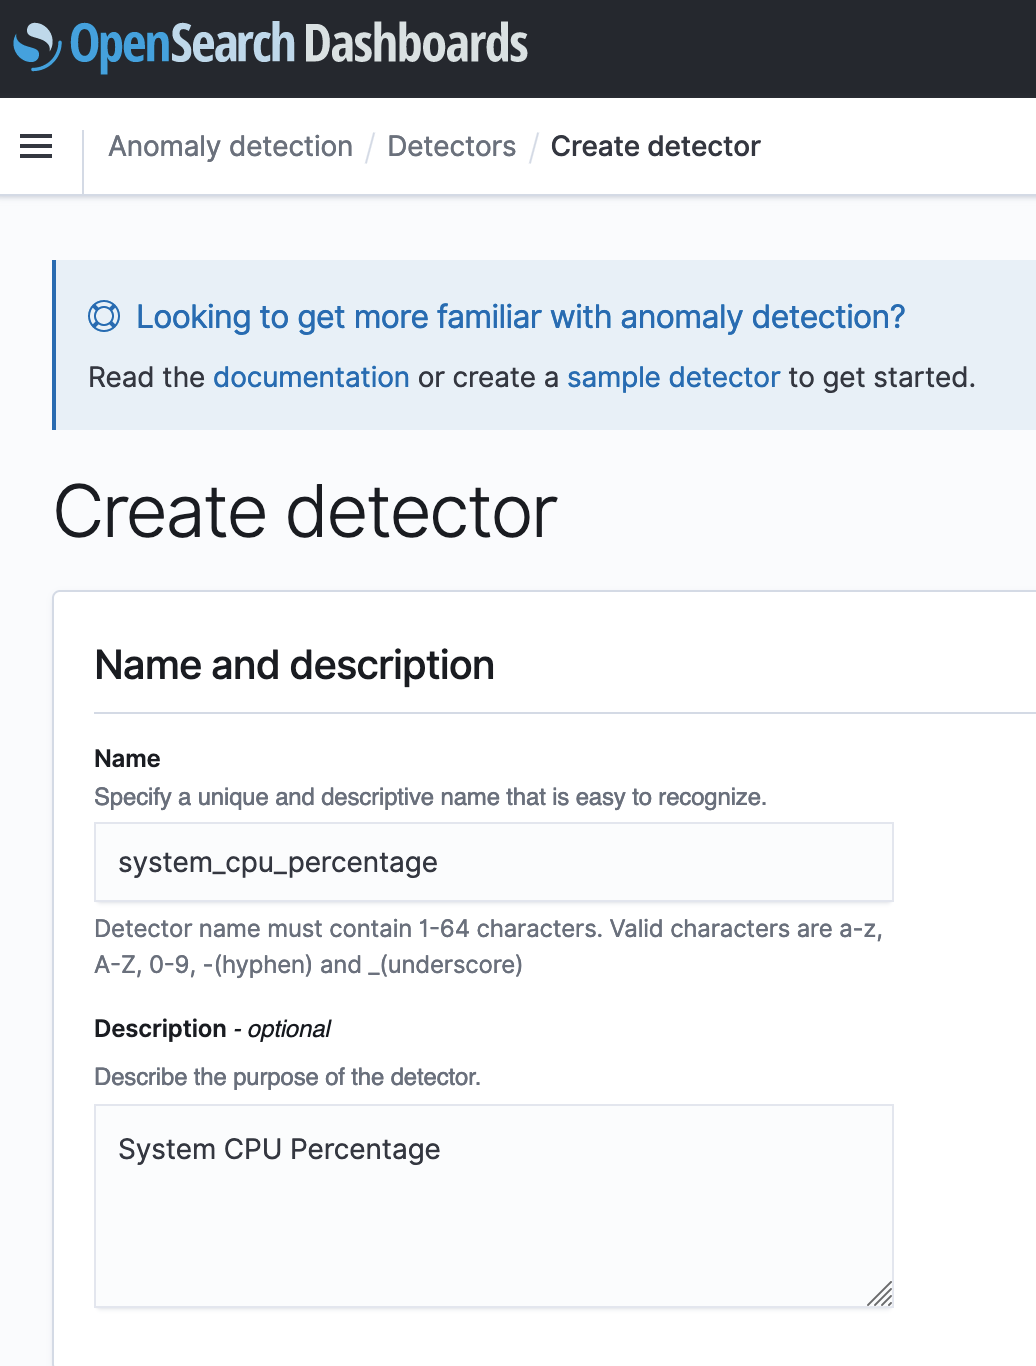
- Choose Create detector.

- For Name, enter a unique name for your detector.
- For Description, enter an optional description.

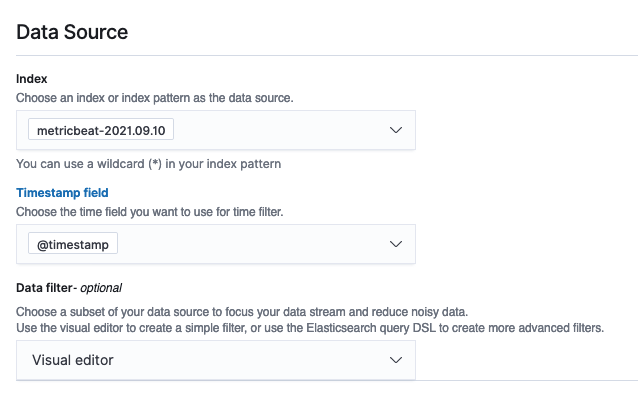
- For Index, choose an index where you want to identify the anomaly.
- For Timestamp field, choose the timestamp field from your index.
Optionally, you can add a data filter. This data filter helps you analyze only a subset of your data source and reduce the noisy data.
- For Data filter, choose Visual editor.
- Choose your field, operator, and value.

Alternatively, choose Custom expression and add in your own filter query.
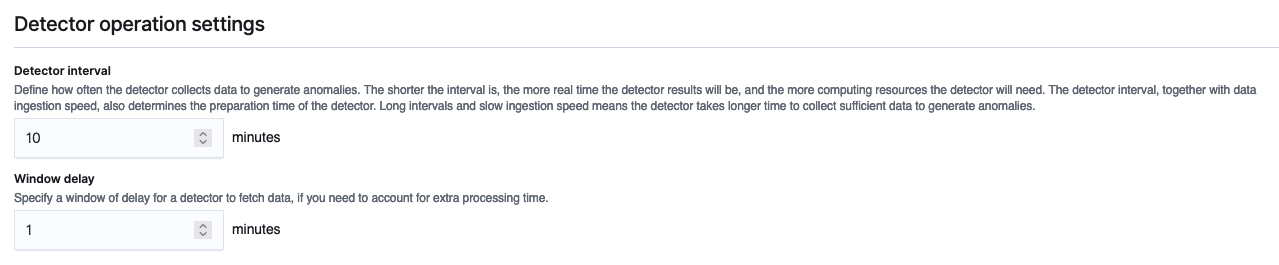
- Set the detector operation settings:
- Detector interval – This defines the time interval for the detector to collect the data. During this time, the detector aggregates the data, then feeds the aggregated results into the anomaly detection model. The number of data points depends on the interval value. A shorter interval time results in a smaller sample size. We recommend setting the interval based on actual data. Too long of an interval might delay the results, and too short might miss some data points.
- Window delay – This adds extra processing time to ensure that all data within the window is present.
Configure the model
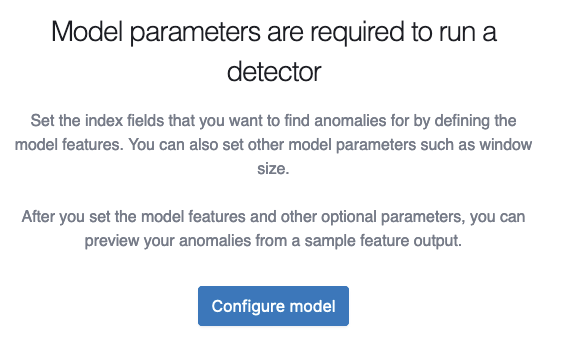
In order to run the anomaly detection model, you must configure certain model parameters. One key parameter is feature selection. A feature is a field in the index that is monitored for anomalies using different aggregation methods. You can apply anomaly detection to more than one feature for the index specified in the detector’s data source. After you create the detector, you need to configure the model with the right features to enable anomaly detection.
- On the anomaly detection dashboard, under the detector name, choose Configure model.

- On the Edit model configuration page, for Feature name, enter a name.
- For Feature state, select Enable feature.
- For Find anomalies based on, choose Field value.
- For Aggregation method, choose your appropriate aggregation method.
For example, if you choose average(), the detector finds anomalies based on the average values of your feature. For this post, we choose sum().
- For Field, choose your field.

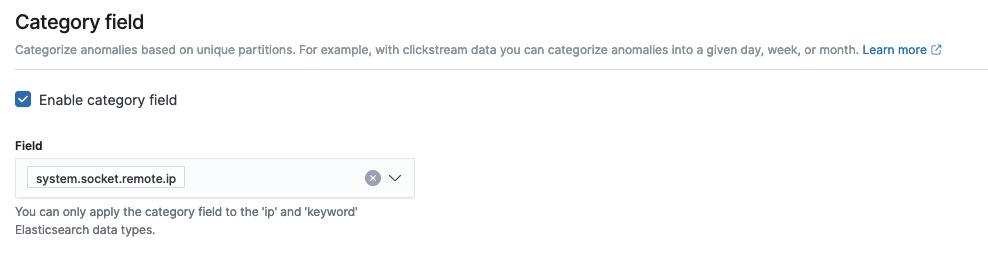
As of this writing, Amazon OpenSearch Service supports the category field for high cardinality. You can use the category field for keyword or IP field type. The category field categorizes or slices the source time series with a dimension like IP addresses, product SKUs, zip codes, and so on. This provides a granular view of anomalies within each entity of the category field, to help you isolate and debug issues. For example, the CPU usage percentage doesn’t help identify the specific instance causing the issue. But by using the host IP categorical value, you may able to find the specific host causing the anomaly.
- In the Category field, select Enable category field.
- For Field, choose your field.
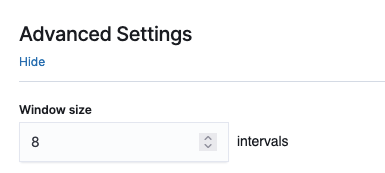
- In the Advanced Settings section, for Window size, set the number of intervals to consider in a detection window.
We recommend choosing the window size value based on the actual data. If you expect missing values in your data or if you want the anomalies based on the current interval, choose 1. If your data is continuously ingested and you want the anomalies based on multiple intervals, choose a larger window size.
In the Sample anomaly history section, you can see a preview of the anomalies.
- Choose Save and start detector.

- In the pop-up window, select when to start the detector (automatically or manually).
- Choose Confirm.


Summary
This post explained the different steps required to create an anomaly detector with Amazon OpenSearch Service. You can use anomaly detection for many use cases, including finding anomalies in access logs from different services, using clickstream data, using IP address data, and more.
Amazon OpenSearch Service anomaly detection is available on domains running any OpenSearch version or Elasticsearch 7.4 or later. All instance types support anomaly detection, except for t2.micro and t2.small.
In the next part of this post, we cover how to set up an alert for these anomalies using the Amazon OpenSearch Service alerting feature.
About the Authors
 Jey Vell is a Senior Solutions Architect with AWS, based in Austin TX. Jey specializes in Analytics and ML/AI. Jey works closely with Amazon OpenSearch Service team, providing architecture guidance and technical support to the AWS customers with their search workloads. He brings to his role over 20 years of technology experience in software development and architecture, and IT management.
 Jon Handler is a Senior Principal Solutions Architect, specializing in AWS search technologies – Amazon CloudSearch, and Amazon OpenSearch Service. Based in Palo Alto, he helps a broad range of customers get their search and log analytics workloads deployed right and functioning well.