AWS Contact Center
Visualizing Amazon Connect instance metrics with Amazon CloudWatch
Introduction
Organizations want the ability to monitor operational and system level metrics of their Amazon Connect instances. Right sizing Service Quotas is important to deliver satisfactory contact experiences, meet service level targets, and optimize AWS resources. Amazon Connect provides operational metrics at the instance level. Amazon Connect automatically sends instance and queue metrics to Amazon CloudWatch every 1 minute. You can view these metrics in Amazon CloudWatch to get a near real-time snapshot of how your Connect instance is performing within the expected ranges. You can use CloudWatch to view these metrics in near real-time, set alarms, and create a dashboard visualizing Amazon Connect metrics on a single page.
In this blog post, we demonstrate how you can create an Amazon CloudWatch dashboard to view the metrics from your Amazon Connect instance. The dashboard includes metrics for voice, chat, and task channels. We will guide you through downloading and running a collection of scripts (using AWS CDK) to build the dashboard. The post assumes that the reader is familiar with Amazon Connect. Experience with scripting/CDK, Amazon CloudWatch, or CloudWatch dashboards is not a prerequisite.
Solution overview
The solution will deploy a dashboard that displays your Amazon Connect metrics. The following diagram shows how the solution will be deployed in your AWS account. You will download (clone) the solution from GitHub, modify a configuration file, and then run the solution to create the dashboard. If you have multiple Connect instances in your account, you can re-run the solution to create corresponding dashboards. Finally, this solution is designed with a minimum number of requirements and steps so you can quickly deploy it and view the dashboard.
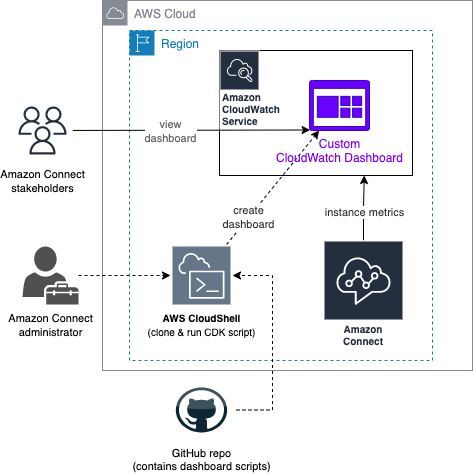
The following components are used in this solution:
- Amazon Connect
- Amazon CloudWatch Dashboards
- AWS CloudShell
- AWS CDK script to create the dashboard (provided via a GitHub repository)
After successfully deploying the solution, the custom CloudWatch dashboard will look like this:

Prerequisites
To follow along with the solution presented in this blog post, you require access to the AWS account of your Amazon Connect instance. Note that the AWS Management Console is different than the Amazon Connect console. The credential you use to log in into the AWS Management Console will need the following permissions:
- create CloudFormation and CloudWatch resources
- access to AWS CloudShell
- list and describe Amazon Connect details (note: the solution does not modify Amazon Connect)
The following steps use AWS CloudShell, which is a command line environment that has AWS CDK and CLI pre-installed. In addition, by default it inherits the same permission rights you have in the AWS Management Console (so no other permissions configuration should be required). Use this option if you don’t already have a development environment. Experienced readers can clone the repo in an existing development environment and deploy from there.
Walkthrough
-
- Sign in to the AWS Management Console.
- Select the AWS Region of your Amazon Connect instance (top right corner of the console).
- Select CloudShell service (use the search bar to find it).

- If this is the first time CloudShell has run, answer yes to the prompt. After CloudShell initializes the environment, you should see the command prompt that looks like this:

- In the CloudShell prompt, enter the following command:
- Using a standard text editor, create a text file with the following text:
- Replace
connect-instance-id,connect-instance-name(alias) with your Amazon Connect instance information (see documentation for info). Replacequeuename-xwith names of the queues in your Connect instance. Important: each queue name should be enclosed in double-quotes and each should have a,at the end, except for the last entry. - Save this file as
dashboardparameters.json. - Return to the browser tab that has CloudShell. Choose Actions (top right) and then choose Upload file. Select
dashboardparameters.jsonand upload it.
- On the CloudShell command line, enter the following commands:
cd amazon-connect-instance-dashboard(you can copy and paste this into CloudShell).- Type
npm install. - Enter
cdk bootstrap. After a few minutes, you will see a green check mark. - Enter
cdk deploy. After a few minutes, you will see another green check mark.

- Congratulations – your dashboard has been created! To view the dashboard:
- Select CloudWatch service on the AWS Management Console. This will open the CloudWatch console.
- On the navigation pane, select Dashboards. You will see your new dashboard in the middle pane with the name:
Amazon-Connect-Instance-Dashboard-<your instance name here>. - Choose this dashboard to open it.
Cleanup
To avoid incurring future charges for the CloudWatch dashboard, open CloudShell and enter the following commands:
cd amazon-connect-instance-dashboard(if you are not already in this directory).cdk destroy, then answer ‘y’ to the prompt.
There is no charge for using AWS CloudShell to deploy the solution.
Conclusion
In this blog post, we implemented a CloudWatch dashboard visualizing your Amazon Connect metrics. This will help you monitor your contact center environment. We walked through using CloudShell to deploy the dashboard using AWS CDK. In a future blog post, we will walk through setting up email alerts when Connect metrics are out of range.
Join us for AWS Contact Center Day, a free virtual event where you’ll learn about the future of customer service, how machine learning can optimize customer and agent experiences—and more. Register now »