Desktop and Application Streaming
How Johnson & Johnson uses AppStream 2.0’s Usage Reports
This post is contributed by Brandon Tedesco, Senior Analyst, End User Virtualization, Johnson & Johnson
About the Author
I am a Senior Analyst at Johnson & Johnson based in Raritan, New Jersey. I have been with Johnson & Johnson for 5 years working with AWS for a little over 2 years supporting the End User Virtualization Team. The End User Virtualization Team is responsible for delivering Amazon AppStream 2.0 and Amazon WorkSpaces to Johnson & Johnson employees and contractors globally. I took an interest in analytics early in my career when I discovered an analytics and visualization tool, which I used to organize and derive meaning from alerts and incidents generated by servers within the Johnson & Johnson environment. Quickly realizing the potential of such a tool, I continue growing my skills in the field of analytics to provide meaningful insights in all areas of my work.
Who is Johnson & Johnson?
Johnson & Johnson believes good health is the foundation of vibrant lives, thriving communities and forward progress. That’s why for more than 130 years, we have aimed to keep people well at every age and every stage of life. Today, as the world’s largest and most broadly-based healthcare company, we are committed to using our reach and size for good. We strive to improve access and affordability, create healthier communities, and put a healthy mind, body and environment within reach of everyone, everywhere. Every day, our more than 140,000 employees across the world are blending heart, science and ingenuity to profoundly change the trajectory of health for humanity. The End User Virtualization Team supports each of the Operating Companies by providing many virtual services through AWS and other platforms.
Why AppStream 2.0?
AppStream 2.0 is one of the virtualization services we use to enable our any device anywhere strategy. Our primary use-case focuses on providing external partners secure access to Johnson & Johnson data and/or resources without the need to provide them a full Johnson & Johnson desktop (physical or virtual) or open firewall ports to allow restricted application access.
What needs to be measured?
Our goal is to keep costs down and provide our end-user a pay/go billing model. To do that, we need to measure usage and be able to allocate cost on a per user basis. This allows us (IT) as a shared internal service to charge users back for their actual consumption.
How did we develop operational metrics?
The AppStream 2.0 team at AWS has released a new feature called Usage Reports. This feature provides an auto-generated feed of the datapoints we require in a daily comma-separated values (CSV) file stored in S3. Using AWS Glue, we identify fieldnames within the CSV files and load them into Amazon Athena. From there we use a data analytics tool to provide a consumable visualization of the data.
Here is a diagram of how the data flow and visualization works:

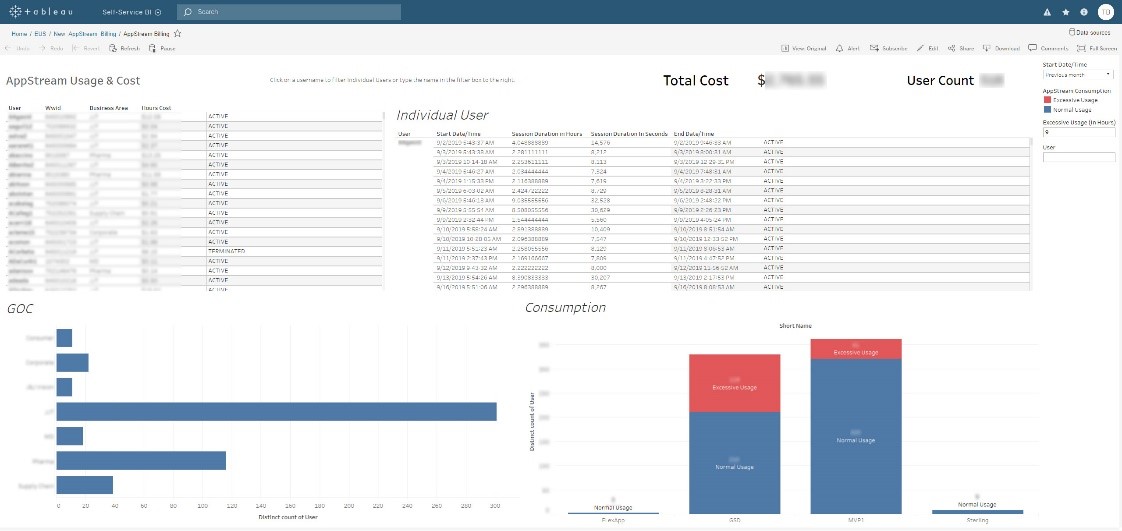
With this data, we have been able to understand how users are using AppStream 2.0, while also identifying inactive session. We also use the usage data to allocate the AppStream 2.0 cost back to the businesses that are using it. Here is an example visualization that we use:
Conclusion
Data is key for us operating the service at scale, while leveraging the cloud economics our users demand. Through the above infrastructure and visualizations, we have created structure and meaning from our data thus allowing us to make intelligent decisions moving forward.