AWS DevOps & Developer Productivity Blog
Automate Container Anomaly Monitoring of Amazon Elastic Kubernetes Service Clusters with Amazon DevOps Guru
Observability in a container-centric environment presents new challenges for operators due to the increasing number of abstractions and supporting infrastructure. In many cases, organizations can have hundreds of clusters and thousands of services/tasks/pods running concurrently. This post will demonstrate new features in Amazon DevOps Guru to help simplify and expand the capabilities of the operator. The features include grouping anomalies by metric and container cluster to improve context and simplify access and support for additional Amazon CloudWatch Container Insight metrics. An example of these capabilities in action would be that Amazon DevOps Guru can now identify anomalies in CPU, memory, or networking within Amazon Elastic Kubernetes Service (EKS), notifying the operators and letting them more easily navigate to the affected cluster to examine the collected data.
Amazon DevOps Guru offers a fully managed AIOps platform service that lets developers and operators improve application availability and resolve operational issues faster. It minimizes manual effort by leveraging machine learning (ML) powered recommendations. Its ML models take advantage of the expertise of AWS in operating highly available applications for the world’s largest ecommerce business for over 20 years. DevOps Guru automatically detects operational issues, predicts impending resource exhaustion, details likely causes, and recommends remediation actions.
Solution Overview
In this post, we will demonstrate the new Amazon DevOps Guru features around cluster grouping and additionally supported Amazon EKS metrics. To demonstrate these features, we will show you how to create a Kubernetes cluster, instrument the cluster using AWS Distro for OpenTelemetry, and then configure Amazon DevOps Guru to automate anomaly detection of EKS metrics. A previous blog provides detail on the AWS Distro for OpenTelemetry collector that is employed here.
Prerequisites
- Install eksctl for creating Amazon Elastic Kubernetes Service Cluster
- Install kubectl for managing Amazon Elastic Kubernetes Cluster
- Amazon Elastic Kubernetes Service(EKS)
- AWS Distro for OpenTelemetry
- Amazon DevOps Guru
- Amazon Simple Notification Service(SNS)
EKS Cluster Creation
We employ the eksctl CLI tool to create an Amazon EKS. Using eksctl, you can provide details on the command line or specify a manifest file. The following manifest is used to create a single managed node using Amazon Elastic Compute Cloud (EC2), and this will be created and constrained to the specified Region via entry metadata/region and Availability Zones via the managedNodeGroups/availabilityZones entry. By default, this will create a new VPC with eight subnets.
- To create an Amazon EKS cluster using eksctl and a manifest file, we use eksctl create as shown below. Note that this step will take 10 – 15 minutes to establish the cluster.
- Once this is complete, you can use kubectl, the Kubernetes CLI, to access the managed nodes that are running.
AWS Distro for OpenTelemetry Collector Installation
We will use AWS Distro for OpenTelemetry Collector to extract metrics from a pod running in Amazon EKS. This will collect metrics within the Kubernetes cluster and surface them to Amazon CloudWatch. We start by defining a policy to allow access. The following information comes from the post here.
Attach the CloudWatchAgentServerPolicy IAM Policy to worker node
- Open the Amazon EC2 console.
- Select one of the worker node instances, and choose the IAM role in the description.
- On the IAM role page, choose Attach policies.
- In the list of policies, select the check box next to
CloudWatchAgentServerPolicy. You can use the search box to find this policy. - Choose Attach policies.
Deploy AWS OpenTelemetry Collector on Amazon EKS
Next, you will deploy the AWS Distro for OpenTelemetry using a GitHub hosted manifest.
- Deploy the artifact to the Amazon EKS cluster using the following command:
- View the resources in the
aws-otel-eksnamespace.
View Container Insight Metrics in Amazon CloudWatch
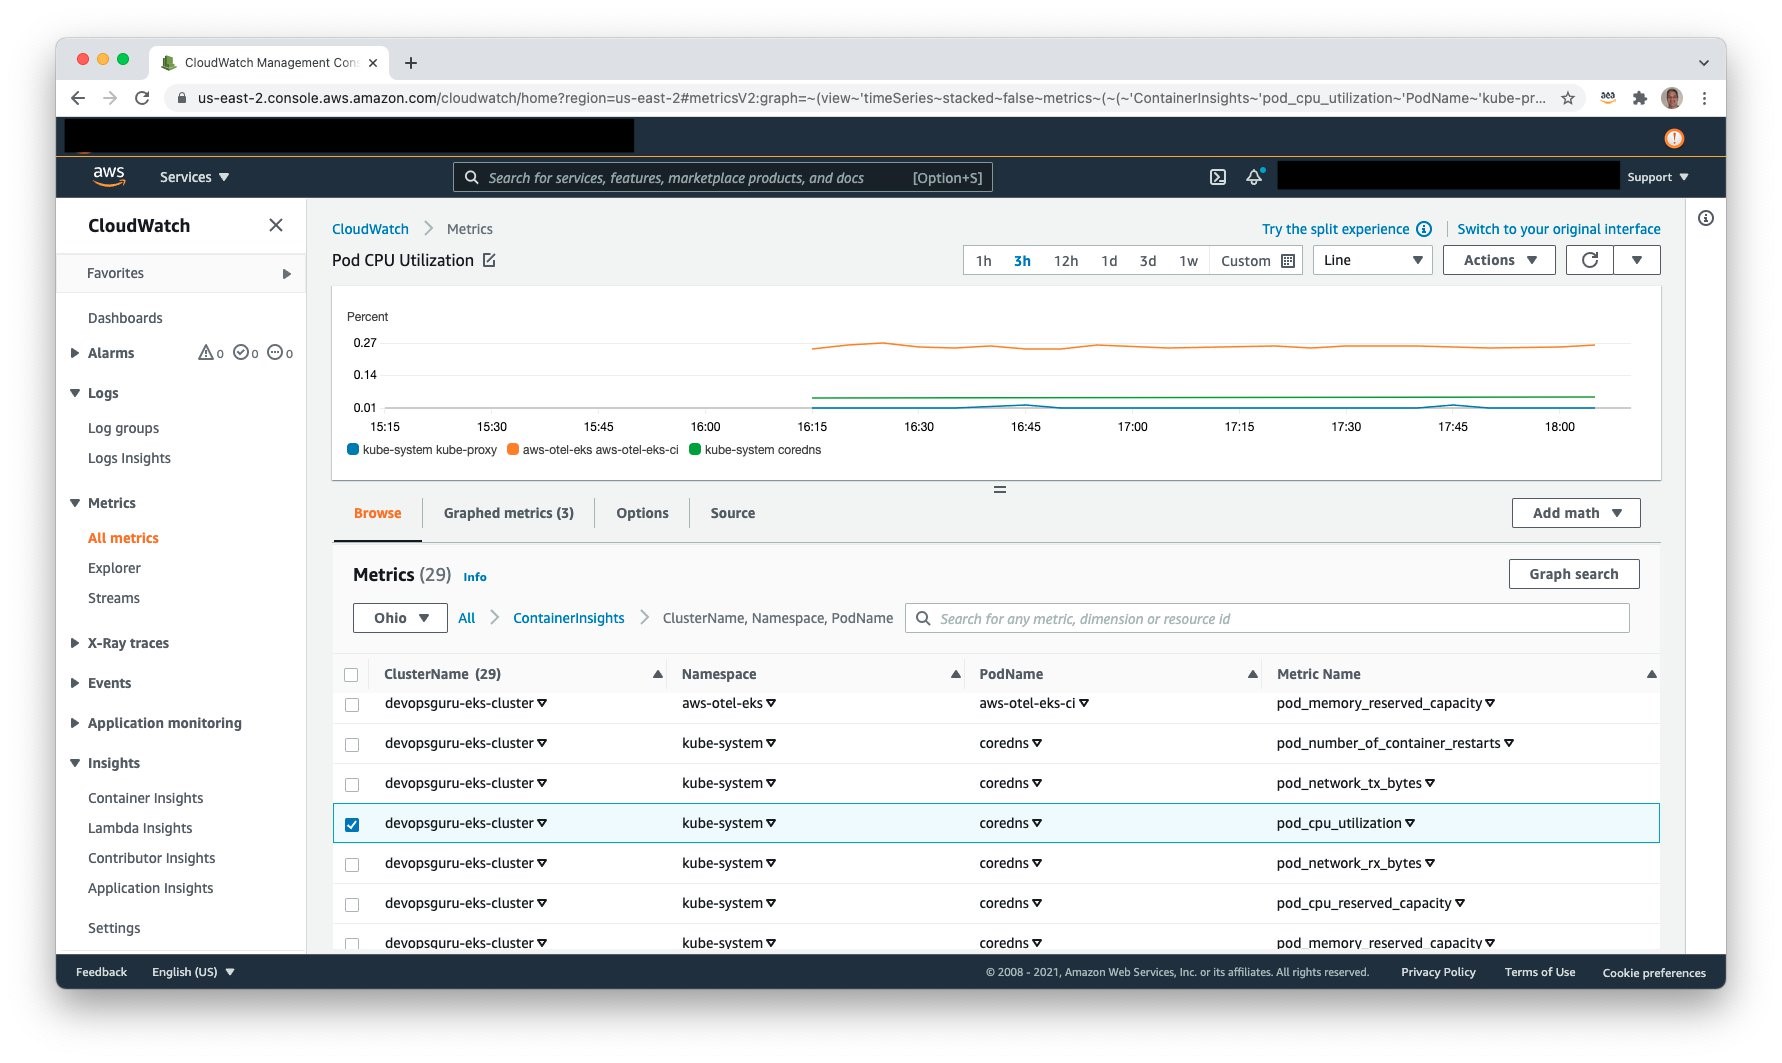
Access Amazon CloudWatch and select Metrics, All metrics to view the published metrics. Under Custom Namespaces, ContainerInsights is selectable. Under this, one can view metrics at the cluster, node, pod, namespace, and service granularity. The following example shows pod level metrics of CPU:
Amazon Simple Notification Service
It is necessary to allow Amazon DevOps Guru access to Amazon SNS in order for Amazon SNS to publish events. During the setup process, an Amazon SNS Topic is created, and the following resource policy is applied:
Amazon DevOps Guru
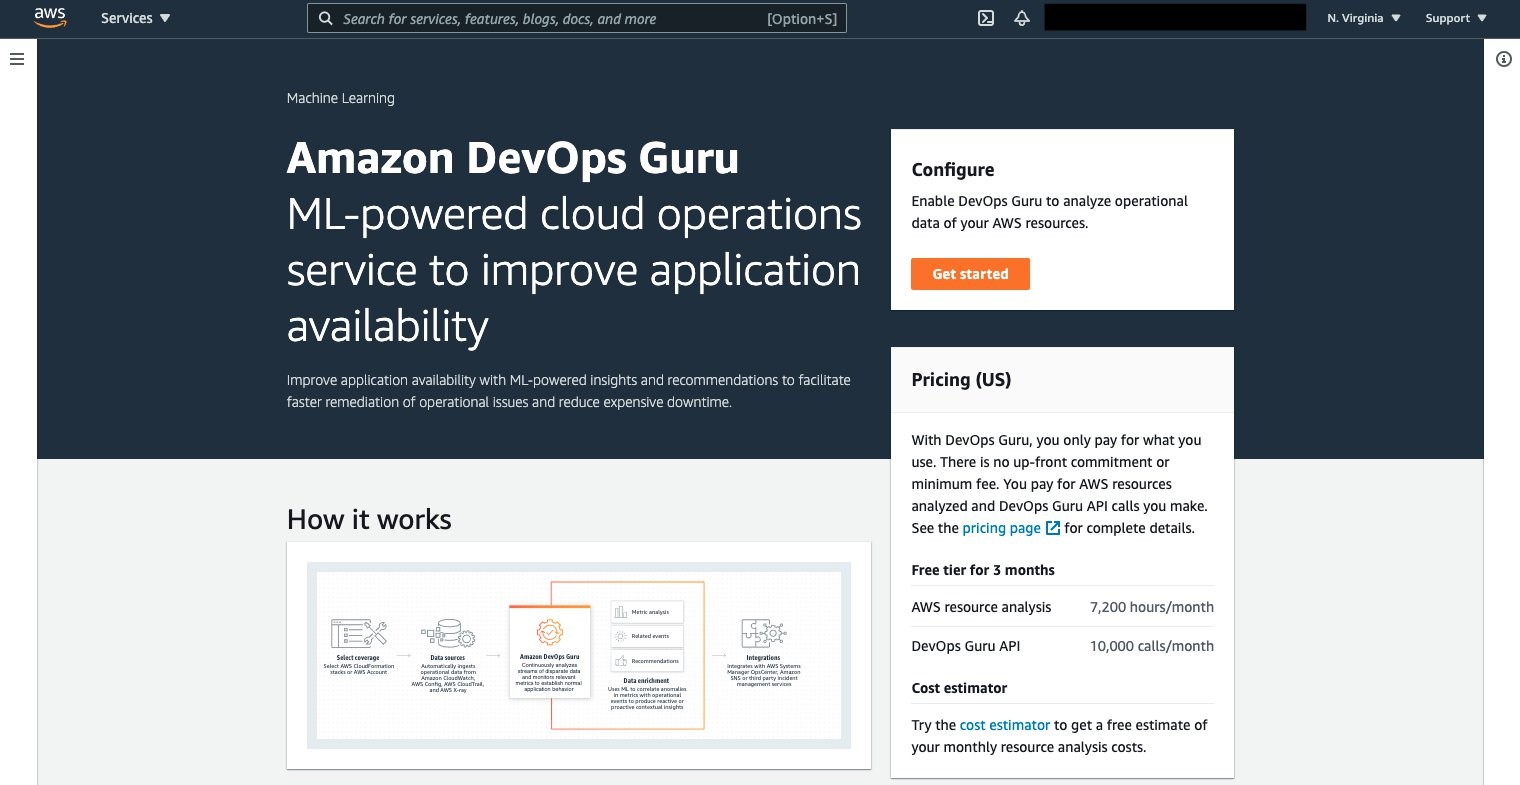
Amazon DevOps Guru can now be leveraged to monitor the Amazon EKS cluster and Managed Node Group. Select Amazon DevOps Guru, and select Get started as shown in the following figure to do this.
Once selected, the Get started console displays, letting you specify the IAM role for DevOps guru to access the appropriate resources.

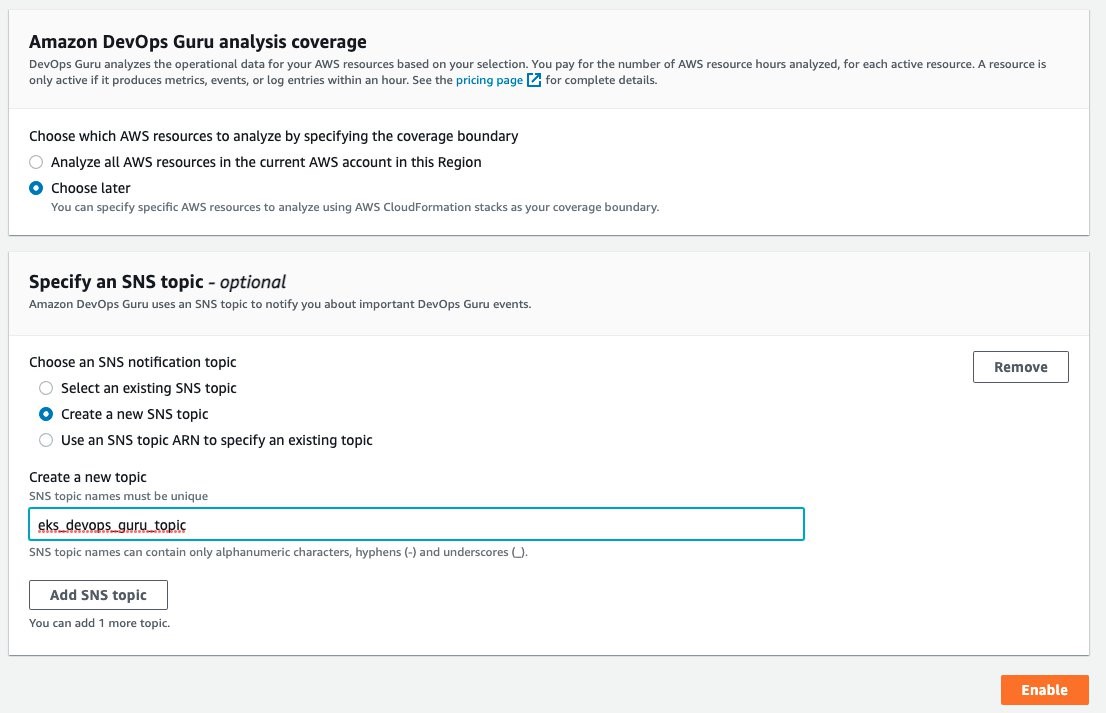
Under the Amazon DevOps Guru analysis coverage, Choose later is selected. This will let us specify the CloudFormation stacks to monitor. Select Create a new SNS topic, and provide a name. This will be used to collect notifications and allow for subscribers to then be notified. Select Enable when complete.
On the Manage DevOps Guru analysis coverage, select Analyze all AWS resources in the specified CloudFormation stacks in this Region. Then, select the cluster and managed node group AWS CloudFormation stacks so that DevOps Guru can monitor Amazon EKS.
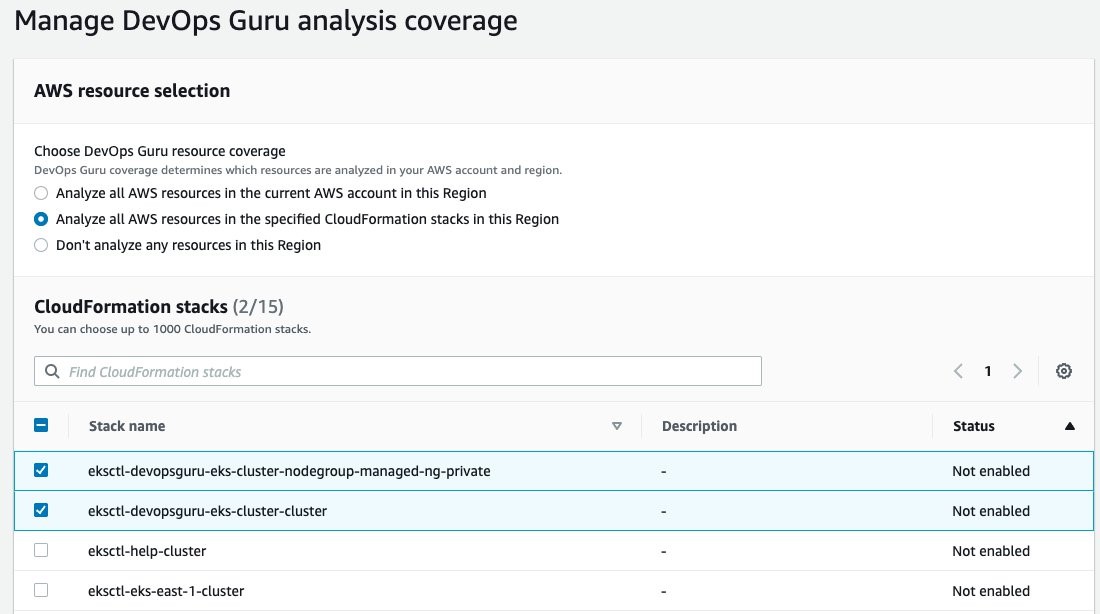
Once this is selected, the display will update indicating that two CloudFormation stacks were added.

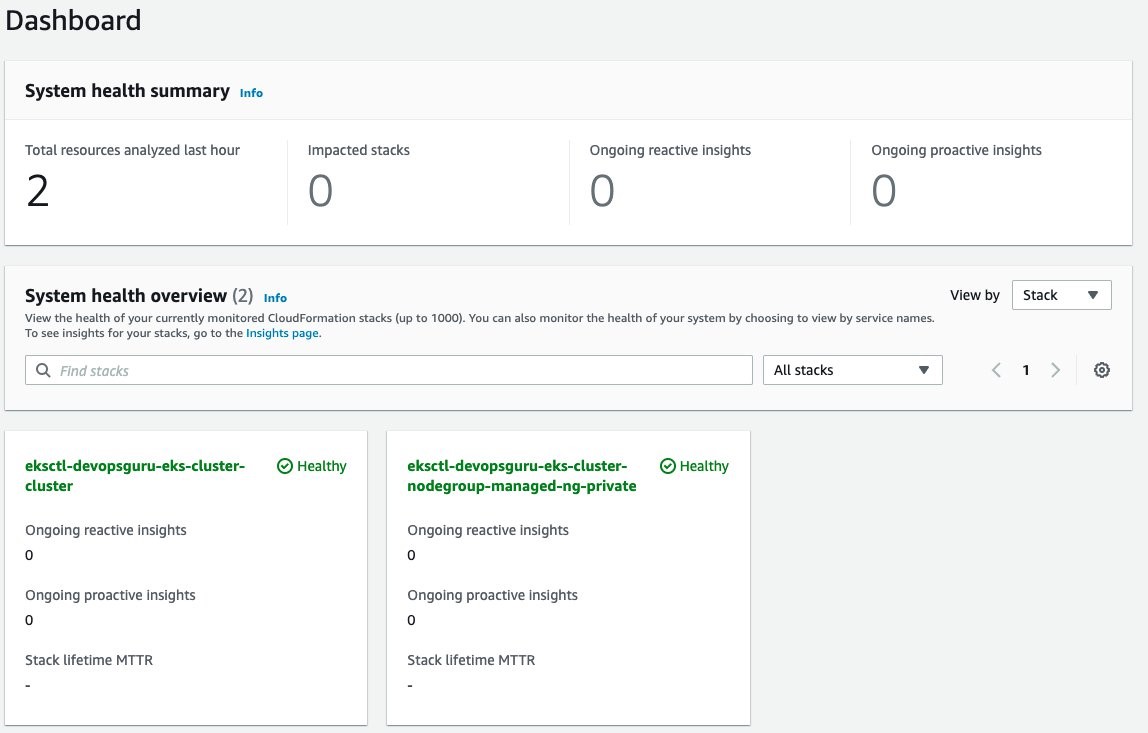
Amazon DevOps Guru will finally start analysis for those two stacks. This will take several hours to collect data and to identify normal operating conditions. Once this process is complete, the Dashboard will display that those resources have been analyzed, as shown in the following figure.
Enable Encryption on Amazon SNS Topic
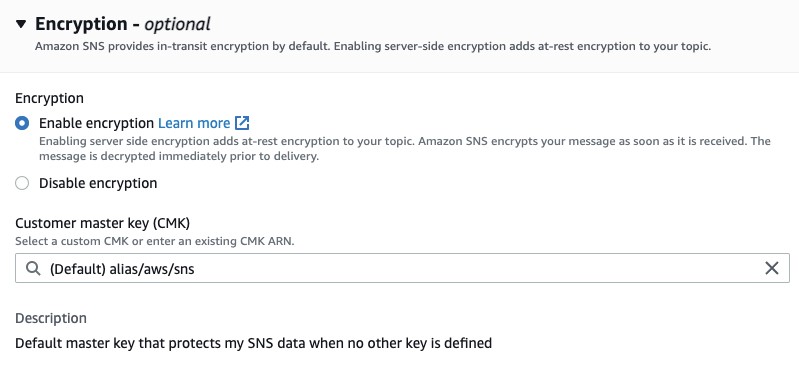
The Amazon SNS Topic created by Amazon DevOps Guru will not enable encryption by default. It is important to enable this feature to encrypt notifications at rest. Go to Amazon SNS, select the topic that is created and then Edit topic. Open the Encryption dialog box and enable encryption as shown in the following figure, specifying an alias, or accepting the default.
Deploy Sample Application on Amazon EKS To Trigger Insights
You will employ a sample application that is part of the AWS Distro for OpenTelemetry Collector to simulate failure. Using the following manifest, you will deploy a sample application that has pod resource limits for memory and CPU shares. These limits are artificially low and insufficient for the pod to run. The pod will exceed memory and will be identified for eviction by Amazon EKS. When it is evicted, it will attempt to be redeployed per the manifest requirement for a replica of one. In turn, this will repeat the process and generate memory and pod restart errors in Amazon CloudWatch. For this example, the deployment was left for over an hour, thereby causing the pod failure to repeat numerous times. The following is the manifest that you will create on the filesystem.
To deploy the application, use the following command:
Scenario: Improved context from DevOps Guru Container Cluster Grouping and Increased Metrics
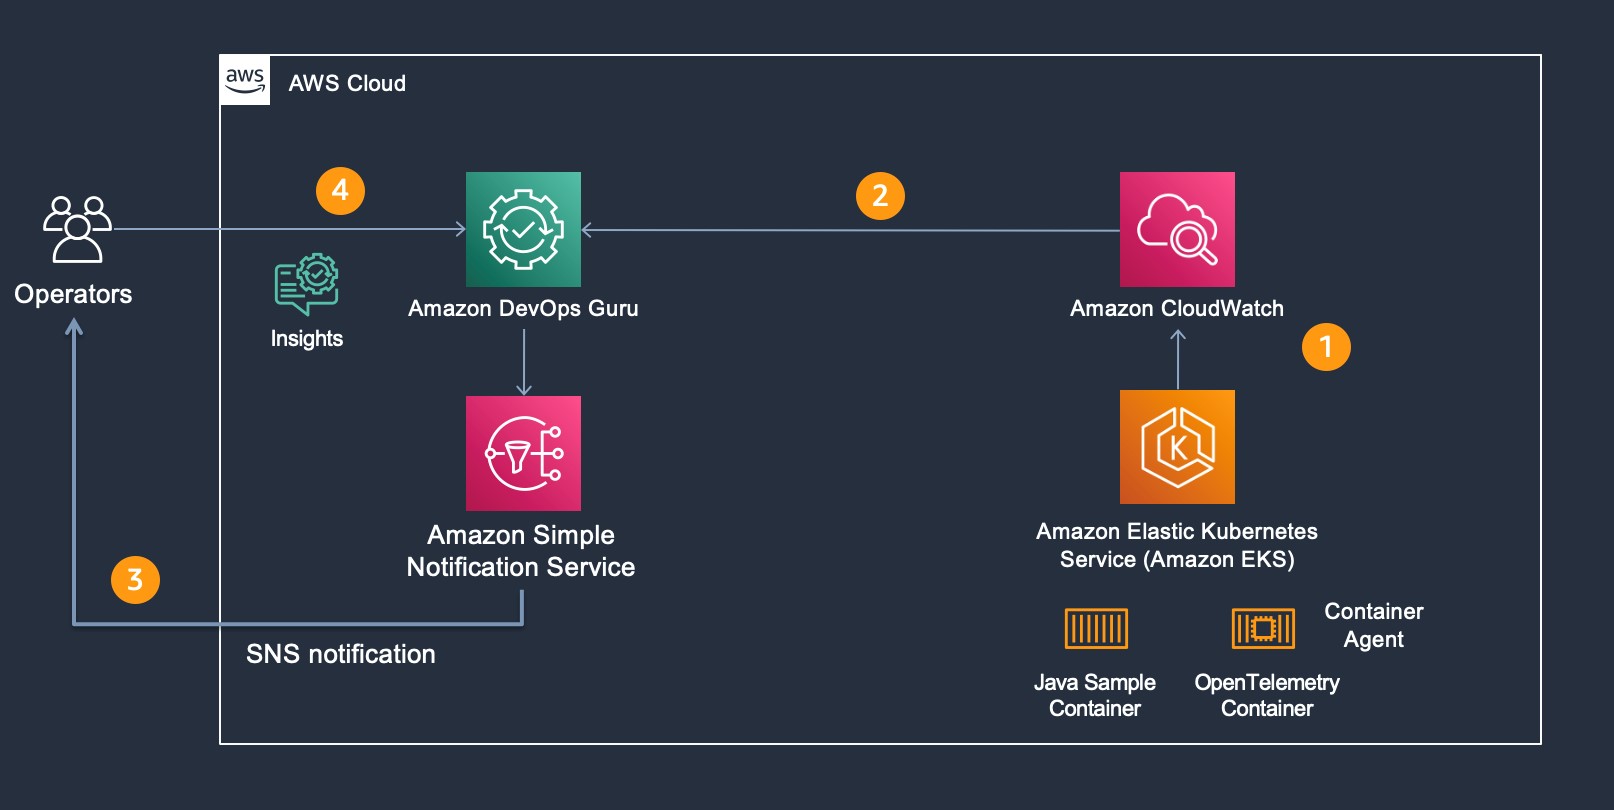
For our scenario, Amazon DevOps Guru is monitoring additional Amazon CloudWatch Container Insight Metrics for EKS. The following figure shows the flow of information and eventual notification of the operator, so that they can examine the Amazon DevOps Guru Insight. Starting at step 1, the container agent (AWS Distro for OpenTelemetry) forwards container metrics to Amazon CloudWatch. In step 2, Amazon DevOps Guru is continually consuming those metrics and performing anomaly detection. If an anomaly is detected, then this generates an Insight, thereby triggering Amazon SNS notification as shown in step 3. In step 4, the operators access Amazon DevOps Guru console to examine the insight. Then, the operators can leverage the new user interface capability displaying which cluster, namespace, and pod/service is impacted along with correlated Amazon EKS metric(s).
New EKS Container Metrics in DevOps Guru
As part of the release, the following pod and node metrics are now tracked by DevOps Guru:
- pod_number_of_container_restarts – number of times that a pod is restarted (e.g., image pull issues, container failure).
- pod_memory_utilization_over_pod_limit – memory that exceeds the pod limit called out in resource memory limits.
- pod_cpu_utilization_over_pod_limit – CPU shares that exceed the pod limit called out in resource CPU limits.
- pod_cpu_utilization – percent CPU Utilization within an active pod.
- pod_memory_utilization – percent memory utilization within an active pod.
- node_network_total_bytes – total bytes over the network interface for the managed node (e.g., EC2 instance)
- node_filesystem_utilization – percent file system utilization for the managed node (e.g., EC2 instance).
- node_cpu_utilization – percent CPU Utilization within a managed node (e.g., EC2 instance).
- node_memory_utilization – percent memory utilization within a managed node (e.g., EC2 instance).
Operator Scenario
The Kubernetes Operator is informed of an insight via Amazon SNS. The Amazon SNS message content appears in the following code, showing the originator and information identifying the InsightDescription, InsightSeverity, name of the container metric, and the Pod / EKS Cluster:
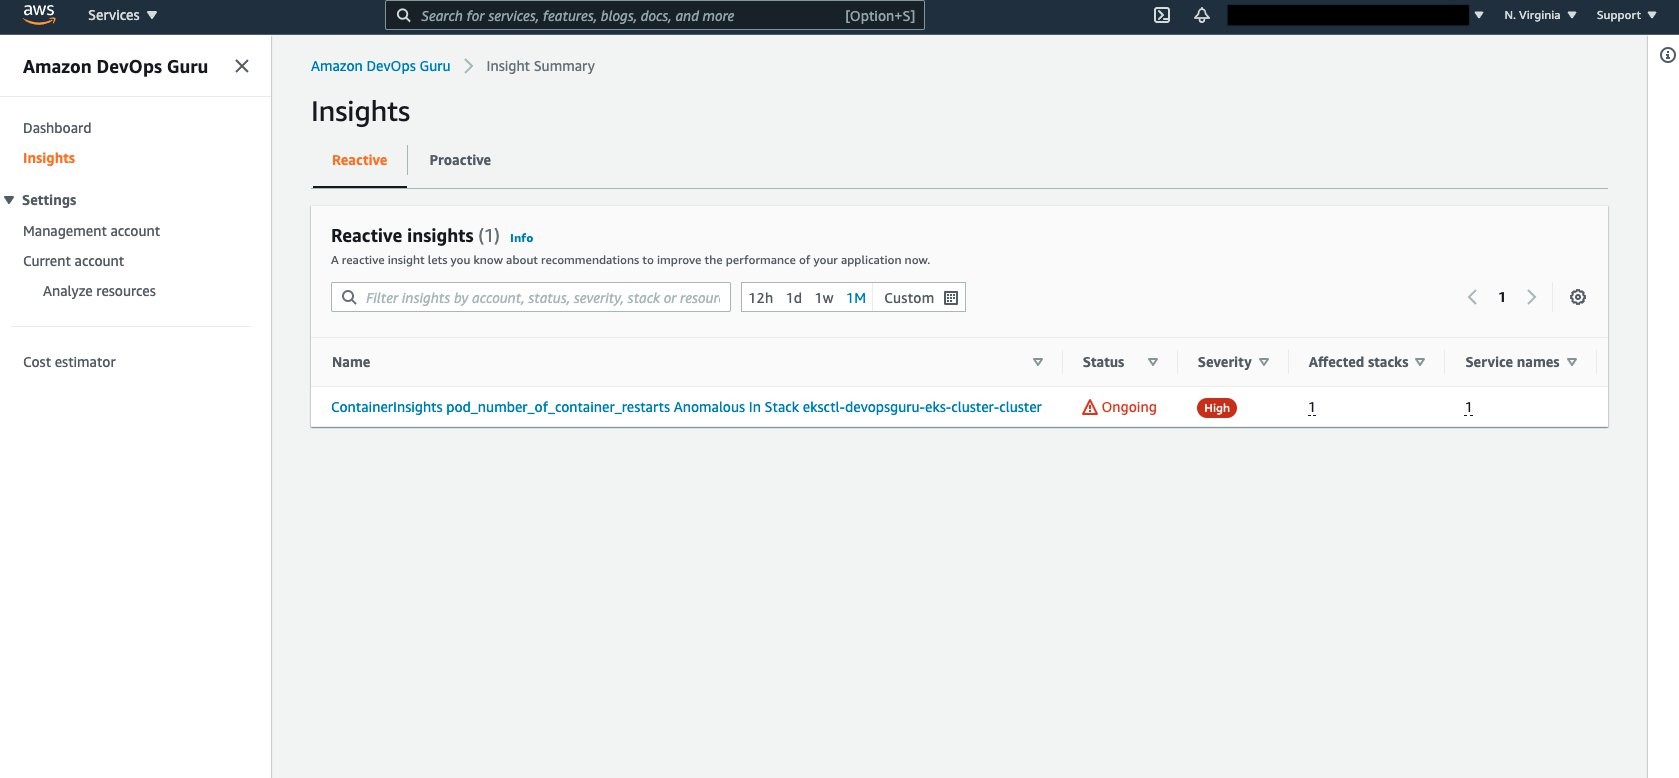
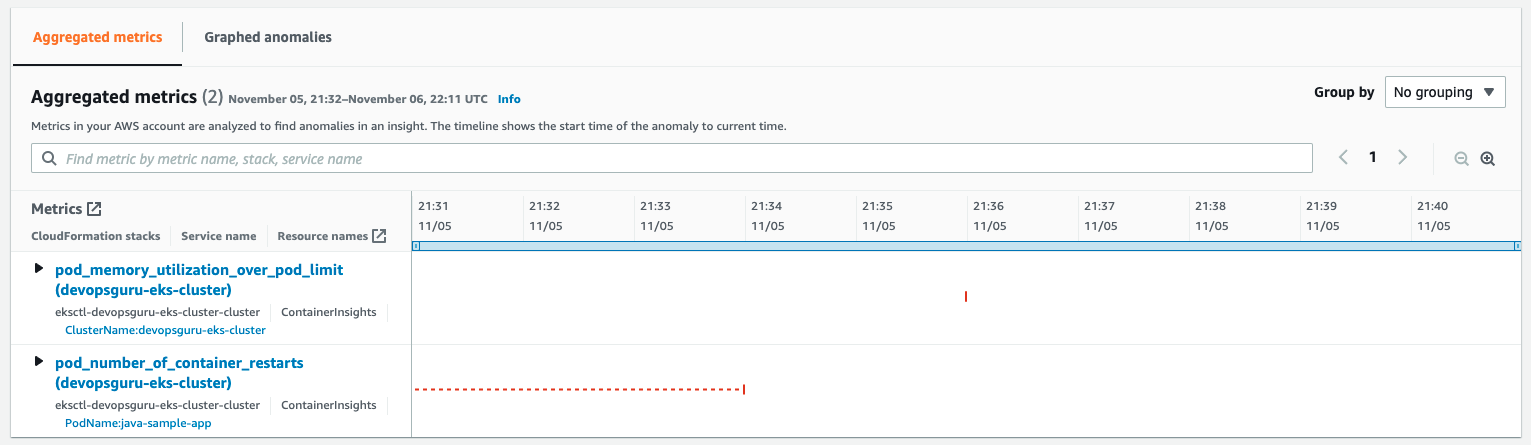
Amazon DevOps Guru Console collects the insights under the Insights selection as shown in the following figure. Select Insights to view the details.
Aggregated Metrics provides the identification of the EKS Container Metrics that have errored. In this case, pod_memory_utilization_over_pod_limit and pod_number_of_container_restarts.
Further details can be identified by selecting and expanding each insight as shown in the following figure.

Note that the display provides information around the Cluster, PodName, and Namespace. This helps operators maintaining large numbers of EKS Clusters to quickly isolate the offending Pod, its operating Namespace, and EKS Cluster to which it belongs. A search bar provides further filtering to isolate the name, stack, or service name displayed.
Cleaning Up
Follow the steps to delete the resources to prevent additional charges being posted to your account.
Amazon EKS Cluster Cleanup
Follow these steps to detach the customer managed policy and delete the cluster.
- Detach customer managed policy,
AWSDistroOpenTelemetryPolicy, via IAM Console. - Delete cluster using eksctl.
Conclusion
In the previous scenarios, demonstration of the new cluster organization and additional container metrics was performed. Both of these features further simplify and expand the ability for an operator to more easily identify issues within a container cluster when Amazon DevOps Guru detects anomalies. You can start building your own solutions that employ Amazon CloudWatch Agent / AWS Distro for OpenTelemetry Agent and Amazon DevOps Guru by reading the documentation. This provides a conceptual overview and practical examples to help you understand the features provided by Amazon DevOps Guru and how to use them.