AWS for Industries
Integrate OSIsoft PI and Esri ArcGIS on AWS for Real-time Utility Dashboards and Analysis
As more organizations and energy producers take the climate pledge and aim to be carbon neutral in some form by 2050 or earlier, now is the time when utilities need to innovate to reach their carbon goals. At the same time, utilities need to collect and make sense of the flood of data coming from the thousands of assets that comprise their critical infrastructure to ensure asset health and longevity. Real-time situational awareness and proactive analytics are keys to addressing this challenge. AWS Partner solutions, which can natively understand IoT and system control and data acquisition systems (SCADA) data and provide operational insights, are a good fit for this use case. One is the OSIsoft PI system that collects, stores, contextualizes, visualizes, and shares situational awareness for utilities. The PI System data infrastructure platform provides a suite of products to achieve this.
Of these, the PI Integrator for Business Analytics is a popular choice to send time series data to external analytics platforms. For example, PI Integrator for Business Analytics allows direct transmission of telemetry data from PI System to Amazon Kinesis, which is a fully managed streaming service. Likewise, the PI Integrator allows for the combining of real-time operations data with geo-spatial visualization and geo-analytics. Esri’s ArcGIS Enterprise platform lets utilities create, manage, share, and analyze spatial data. AWS continuously collaborates with partners such as OISsoft and Esri to innovate and develop cloud-native solutions for the utility industry.
This is the first part of a three-part blog series that explores the following solutions: Part 1 – Integrate OSIsoft PI and Esri ArcGIS on AWS for Real-time Utility Dashboards and Analysis; Part 2 – Integrate AWS IoT Core and Esri ArcGIS Velocity for Real-time Utility Dashboards and Analysis; Part 3 – Integrate AWS IoT Core and Esri ArcGIS GeoEvent Server for Real-time Utility Dashboards and Analysis.
Part 1 – Running PI Server and Esri ArcGIS on AWS
Traditionally, large utilities use grid management systems like advanced distribution management systems (ADMS), transmission energy management systems (EMS), and outage management systems (OMS) to make sense of the real-time status and operating performance of their individual assets across their electric grid. Many organizations also use Esri’s Enterprise ArcGIS platform as the system of record to represent their assets geospatially, for example where on Earth are their transmission lines, distribution lines, transformers, individual electric meters; and what is connected to what. Data from the geographic information system (GIS) and from SCADA, which may arrive via a PI System, is combined together in the DMS/ADMS, EMS, and OMS to provide real-time situational awareness and operational control of the grid state.
The majority of enterprises have their time series data infrastructure platforms (“Historians”) hosted on-premises. With thousands of data streams and billions of data tags being collected in major utility or industrial settings using PI System, many organizations are looking ahead to modernize their data infrastructure platform and innovate on AWS for its flexibility, scalability, and breadth of services. They require low latency access to operational data from across many sites in an electric grid infrastructure while adhering to all the federal and local government regulations and integrate with other systems, such as GIS.
With the solution covered in this blog, other stakeholders, such as Independent System Operators (ISOs), can also have real-time visibility into the grid. A similar approach is used by PJM for geospatial data analytics to improve situational awareness. Other customers have also leveraged value from this “data and map” integration as well. Another value in this solution is that ArcGIS and PI System have native integrations that can be leveraged for quick setup and provide you a vendor supported system vs. home-grown.
This integration can provide a view similar to ADMS systems when integrated along with sensor data from those assets collected from SCADA, DCS, and PLCs. With both GIS and SCADA data combined in one single view, electric grid stakeholders would be able to assess, for example, how a transformer is functioning but also how its performance is related to the functioning of all the associated meters. With this composite view, now multiple stakeholders beyond just the grid control center operations can assess quickly the status of the grid, and do proactive grid planning, and even assess grid outage situations to assist with outage restorations in a timely manner.
Esri ArcGIS environments are highly integrated and can range from simple single machine deployments to significant complexity. Running ArcGIS Enterprise on AWS has the benefit of being able to use the Esri AMI from the AWS Marketplace with AWS CloudFormation to easily standup and replicate entire environments. Another benefit is the ability to provision GPU powered instances on demand. Esri has published a blog calling out this exact use case where users can use Amazon AppStream 2.0 instances with GPUs for ArcGIS Pro graphics intensive processing and machine learning use cases. This also moves your ArcGIS Pro clients closer to large datasets that are available in AWS Open Data Registry. The Open Data Registry hosts large datasets sometimes up to a petabyte in size like Sentinel-2 satellite imagery but also smaller datasets like Department of Energy Wave.
Overview of Solution Approach
This overall solution consists of integrating the central PI System and ArcGIS Enterprise platforms, both hosted on AWS, using components from the respective companies to deliver real-time sensor data from assets into ArcGIS feature layer. Once we have a feature layer, we now have the ability to easily share this layer among Esri’s community in addition to apply it to various map layers for visualization.
The following diagram illustrates the overall concept of this blog series. Real-time sensor data from the grid is aggregated to the centrally hosted highly available PI System on AWS that then leverages PI Integrator for Esri ArcGIS to transmit the real-time data for each asset to Esri’s GeoEvent Server. The data from the GeoEvent Server is then passed-on to ArcGIS Enterprise platform hosted on AWS, which can be used to create an Operations Dashboard view, as shown in the following example.
 Figure 1: Data Flow explaining Overview Integration Concept
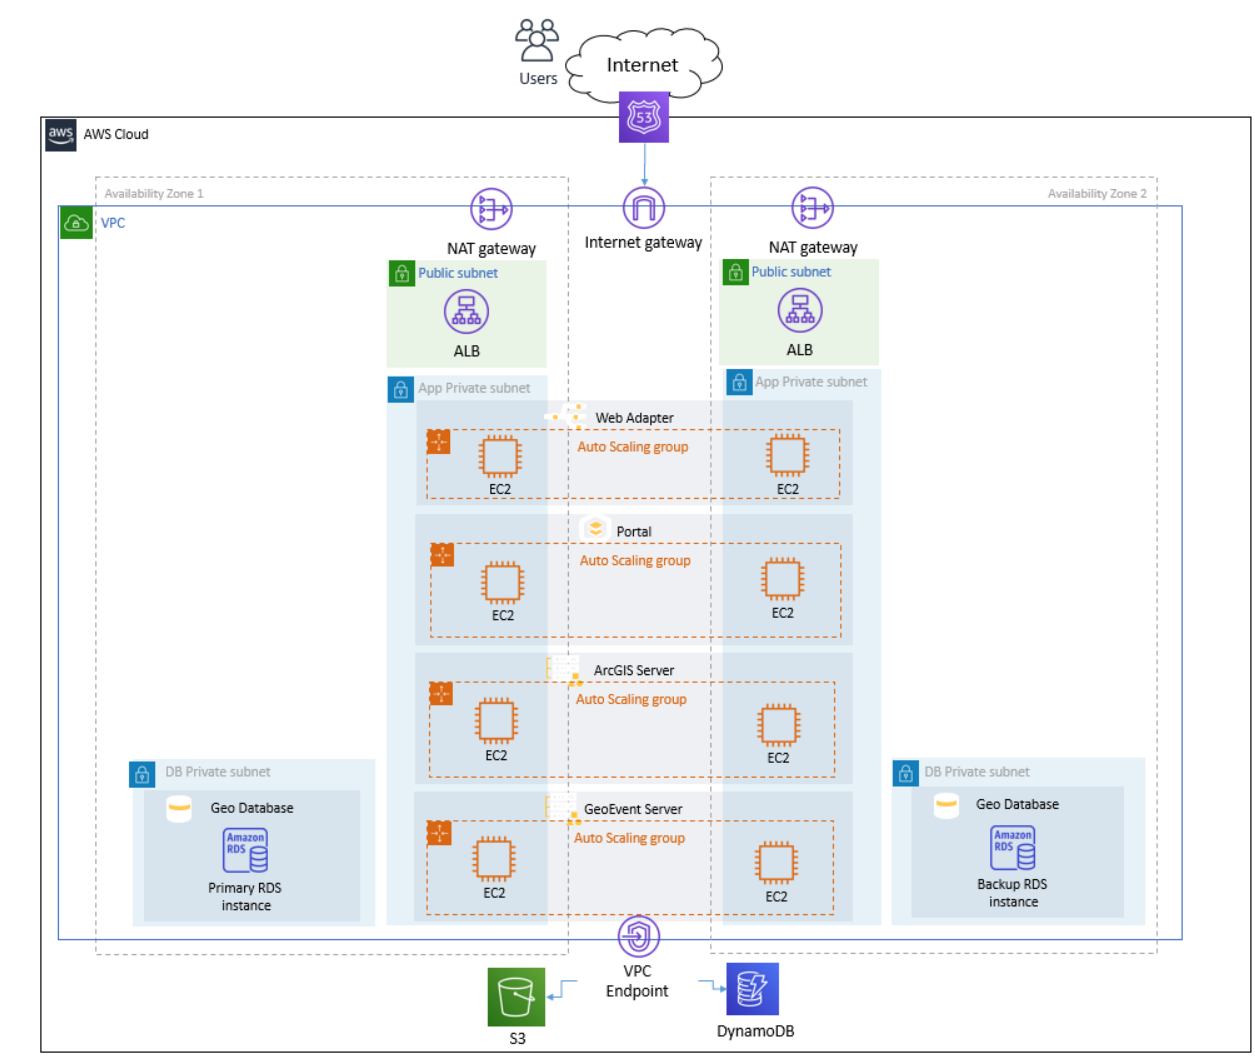 Figure 2: Reference Architecture for a Highly Available Esri ArcGIS Deployment on AWS
In Figure 2, you can see we utilize two Availability Zones for hosting ArcGIS Enterprise. These Availability Zones have single digit latency between facilities that allows you to run multiple ArcGIS server instances in separate AWS Availability Zones at the same time. You can deploy all your instances in a single Availability Zone and use Auto Scaling Groups and Auto Recovery to automatically restore the instances in the other Availability Zone if an AZ is unavailable. Different Esri components can make use of these Availability Zones in different ways. For example, ArcGIS Servers can be run Active / Active and be spread across multiple Availability Zones simultaneously while instances like ArcGIS Data Store and GeoDatabases will be configured as Active / Passive across Availability Zones. Also, an easy way to launch highly available ArcGIS deployments is to use Esri’s Cloud Builder Tool to automatically build out ArcGIS Enterprise on AWS.
PI on AWS
In 2020, AWS released its Reference Architecture for deploying a central PI system on AWS in a highly available configuration.
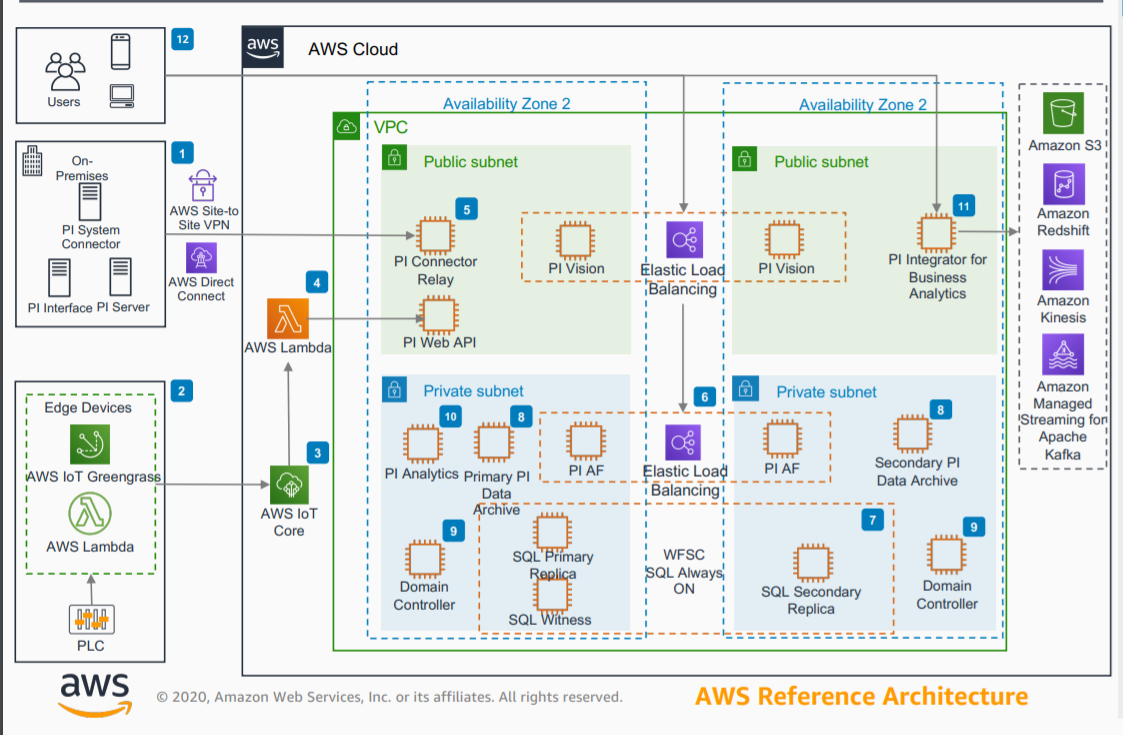 Figure 3: Highly available and load balanced configuration of Roll-up PI System that aggregates data from multiple PI Systems across sites
This reference architecture comprises of a central highly available PI System that is hosted across two Availability Zones on AWS. Here the data collected at different on-premises sites are aggregated into the roll-up PI System via a secure connection using OSIsoft PI System Connector and also from edge devices via AWS IoT Core. Furthermore, the data from the roll-up PI System is sent to AWS targets, such as Amazon S3, Amazon Redshift, Amazon Kinesis, and Amazon Managed Streaming for Apache Kafka using OSIsoft’s out-of-box PI Integrator for Business Analytics.
PI Integrator for ArcGIS is a comprehensive out-of-box solution that integrates PI system with ArcGIS GeoEvent Server, which in-turn posts the near-real-time information to ArcGIS maps hosting the feature layers for individual assets on GIS map. These two product offerings from OSIsoft and Esri enable customers to bring maps to life by providing real-time operations data to Esri ArcGIS. This provides ISOs and Interconnects insight into failures of grid assets. It allows them to quickly grasp through geo-spatial visualizations, the relationships and correlations between affected assets, such as meters and customers affected by a transformer failure. Lastly, they can use this data to unravel the complexities of nested outages during a storm.
Integrated PI and Esri on AWS Reference Architecture
The reference architecture shows a highly available central PI System and Esri ArcGIS platform hosted on AWS. The centralized highly available PI System aggregates data from PI Systems hosted in multiple sites and sends the real-time data to ArcGIS utilizing OSIsoft PI Integrator and ArcGIS GeoEvent as shown in the following diagram.
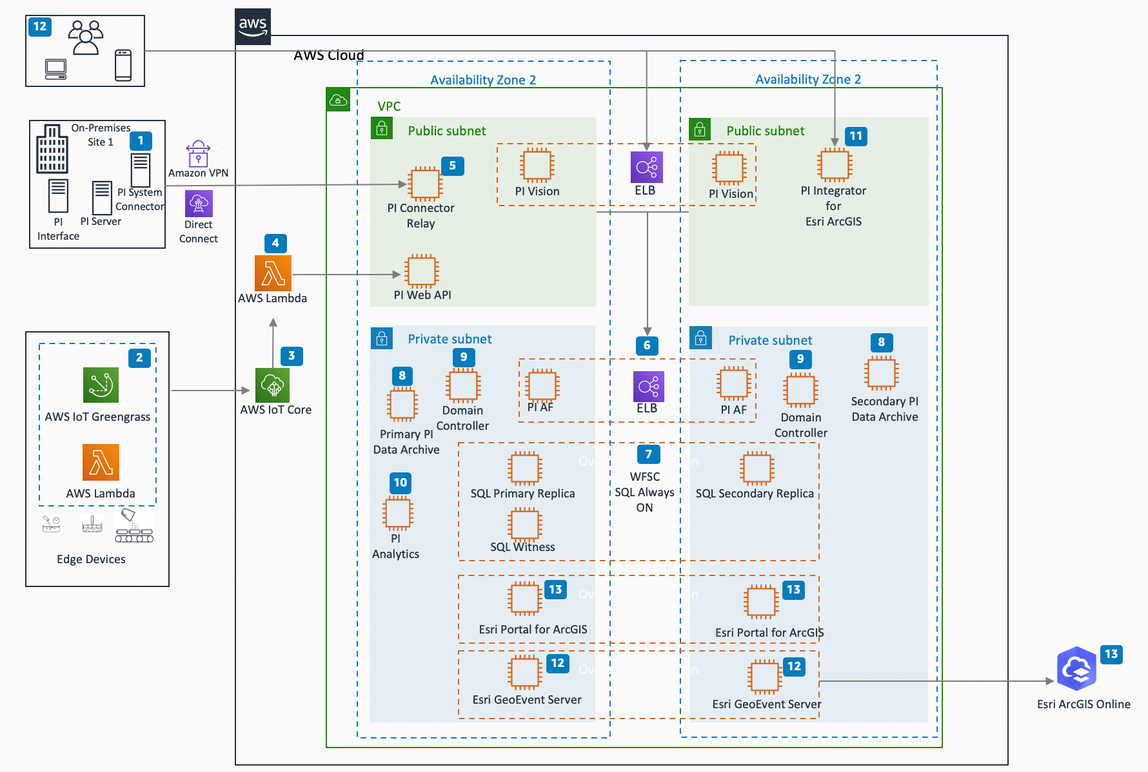 Figure 4: Reference Architecture of Highly Available PI System Deployment on AWS Integrating with Esri Enterprise ArcGIS Platform
- PI System Connector connects PI System from individual sites to the Roll-up PI System on AWS via AWS Direct Connect or Amazon VPN.
- Data from edge devices that can speak Modbus, OPC UA or MQTT flow into AWS IoT Greengrass via Lambda function running locally.
- AWS IoT Greengrass sends the data from edge devices to AWS IoT Core in MQTT format. AWS IoT Core rule is triggered that invokes a Lambda function passing in the data.
- A custom AWS Lambda function translates data from MQTT message into OMF (OSIsoft Messaging Format) and then sends it to PI Web API which posts the data to PI System.
- PI System data from on-premises is sent to the PI Connector Relay which posts the data to PI System.
- Elastic Load Balancing directs PI System traffic from public subnet (PI Connector Relay, PI Web API, PI vision and PI Integrator for Business Analytics) to the PI Asset Framework (PI AF).
- Highly Available SQL Servers running on Amazon EC2 instances stores the metadata used by PI Vision and PI AF.
- Both PI Collective servers (Primary PI Data Archive and Secondary PI Data Archive) receives data from PI Connector Relay.
- Microsoft Active Directory provides Windows Integrated Security access between PI System and is used for user Authentication and Authorization.
- PI Analytics connects to PI AF and PI Data Archives to perform KPI and Event Frame computations.
- PI Integrator for ArcGIS connects to ArcGIS GeoEvent server and configures the ArcGIS GeoEvent server connectors, Input, GeoService, and Output.
- ArcGIS GeoEvent Server polls the data from the PI Integrator for ArcGIS and publishes the data to the relevant feature layer on ArcGIS.
- The published real-time data can be either to ArcGIS Online or to the AWS hosted Enterprise ArcGIS platform.
Finally, a collection of feature layers can be overlaid on a map with the appropriate symbology and color changes based on real-time status obtained from the electric grid. This can be made a more interactive visualization and analysis utilizing Esri Operations dashboard.
PI Integrator for Esri ArcGIS has many value-added features. First, it provides a seamless integration with Esri’s interactive Operations dashboard where ISOs and Interconnects can get a comprehensive view and analysis capability. Secondly, apart from providing up-to-the minute asset status information to Esri ArcGIS, there is a need for ISOs and Interconnects to assess the performance of the grid over-time. A simple use case would be to analyze failures in a particular Region in terms of frequent failure locations over a time period and the analysis of remediation time. In this regard, PI Integrator for Esri ArcGIS provides a capability called “Time-enabled feature layer.” With the Time-enabled feature layer capability, ISOs and Interconnects can quickly playback historical events on the map and analyze the performance of the grid network over a specified time period.
Conclusion
As outlined in this blog post, there is a need in the power and utilities industry to have a one-stop composite view about the entire grid infrastructure. Now with real-time sensor measurement data, ISOs and utilities of all sizes can now get actionable intelligence and remediate faults quickly to improve performance for cost efficiency. Visit AWS for Power and Utilities for more information.