AWS for Industries
Sustainability Reporting Considerations for the Semiconductor Industry
Introduction
The Semiconductor Industry is working to establish Environmental, Social, and Corporate Governance (ESG) standards with the help of science-based targets. As a result, there is an increasing demand to collect and understand operational and product related data for accounting, reporting and optimization. Businesses are now looking to assume responsibility for their products across their entire life cycle. A full life cycle assessment refers to taking into account effects of six stages of sustainability including design, extraction of raw materials, manufacturing, distribution and packaging, product use and end of life or disposal including recycling where possible. For instance, studies have indicated that up to 75% of the carbon dioxide emissions from a mobile device can be ascribed to its manufacturer, with approximately half of those emissions coming from the manufacturing of the underlying chip.
In this blog post we discuss how AWS cloud can assist the Semiconductor Industry in using data from product and engineering teams, manufacturing value chain partners, foundry suppliers, and assembly/test divisions to meet their short- and long-term scope 1, 2 and 3 (explained below) emission targets as well as other sustainability goals.
Semiconductor Industry GHG Scopes
The (Greenhouse Gas) GHG protocol Corporate Standard classifies a company’s GHG emissions into three scopes. This is an industry agnostic concept. Scope 1 emissions are direct emissions from owned or controlled sources. Scope 2 emissions are indirect emissions from generation of purchased energy. Scope 3 refers to GHG emissions from the supply chain pipeline.
Since the Semiconductor Industry is a part of a complicated and extensive supply chain, especially when it comes to accounting for Scope 3 in greenhouse gas emissions, the ESG metrics may not always be under the operational control of the semiconductor company. Additionally, given that a sizable portion of emissions from the semiconductor manufacturing processes fall into the scope 1 or scope 2 categories, foundry suppliers and assembly test organizations end up having a disproportionate influence over a Semiconductor company’s ESG/GHG profile.
Scope 1 emissions arise from process gases used during wafer etching, chamber cleaning, and other tasks. These emissions significantly add to fabs’ GHG emission profile and include gases like PFCs, HFCs, NF3, and N20 which have high global-warming potential (GWP); they rise as node size shrinks. Scope 1 emissions may also arise from high-GWP heat transfer fluids that may leak into the atmosphere when fabs use them in chillers to control wafer temperature during manufacturing processes.
Scope 2 emissions, which represent the highest proportion of GHG from semiconductor companies are linked to the energy required to run extensive production facilities. The sources of these emissions include the following:
- Tool fleets containing hundreds of manufacturing tools, such as lithography equipment, ion implanters, and high-temperature furnaces
- Large clean rooms requiring climate and humidity control with overpressure and particle filtration
- Extensive sub-fab facilities for gas abatement, exhaust pumps, water chillers, and water purification
Scope 3 emissions are indirect, supply chain related emissions. Also referred to as value chain emissions, they often represent the majority of a company’s total GHG emissions. As such, companies are increasingly setting GHG emissions reduction targets on this category and thereby linking the success of their suppliers to reduce emissions to their ability to meet their GHG reduction targets.
Sustainability Considerations and Implementation Phases
It is key to understand various sustainability solutions providers in your industry and engage with them to understand the depth and breadth of requirements and what’s possible when one starts building a Datalake for Scope 1-3 calculations. Following are important questions to address for organizations working towards a sustainability journey, what architectures they want to start with, the kind of data they would like to collect to formalize their sustainability strategy:
- Are there any regional reporting compliance standards? for e.g., SEC (US) vs European?
- What emissions data are your supply chain partners willing to share
- What is the data exchange format, medium and frequency?
- Do your partners have all the data you need for ESG reporting?
- What type of access and security needs do you and your partner have
- Are there regional data storage requirements or data residency constraints?
- Who within the corporation owns quality control and normalization of the aggregated data?
Phase 1: Measurement, Compliance and Reporting.
- What frameworks are you looking at when you get to the stage of reporting, when you bring it all together do you have some framework in mind?
- Do you have a dedicated team tracking these metrics?
- Have you done a materiality assessment? (The purpose of materiality assessments is to engage stakeholders and ascertain their level of importance for various environmental, social, and governance (ESG) issues. The learned lessons can then be applied to strategy and communication, assisting you in telling a more compelling sustainability story)
- Are you at the point of modeling data?
Phase 2: Forecasting and What if scenario Analysis.
- Do you see a future where you’d like to assess different scenarios like investing in initiative A over initiative B to optimize one over the other?
Phase 3: Getting more granularity at the product and or supplier level to explore possible optimizations.
- Once you’ve chosen your reporting framework then you’ll use tools that are out there for reporting. Zooming into biggest pain points that would help you figure out what to automate first and breakdown data siloes. What would that be? Utility data? Or supply chain?
- Are you thinking of energy usage efficiency or ROI or both?
Proposed Solution for ESG Reporting
The proposed solution can help provide the Semiconductor companies with enterprise-level Scope 1,2 & 3 GHG emissions accounting & reporting, provide a carbon-focused common operating picture based on interpretable and transparent representations of Scope 3, supply chain partners and production processes from suppliers, foundry, assembly, test, to measure and manage product carbon footprint (PCF) and help derive insights for energy optimization and PCF reduction. This process begins with Data Collection, Modeling, Analysis and Reporting from your supply chain vendors to help create transparency about your scope 1, 2, and 3 (upstream) emissions.
Scope 1 and 2 Calculations: Using the Carbon Footprint Calculator
The calculator shown in Fig 1 below, found in our billing dashboard, allows the user to select a time period with month-level granularity, and shows carbon emissions in summary, geographic, and per-service form. In all these cases, emissions are in Metric Tons of Carbon Dioxide Equivalent, abbreviated as MTCO2e.

Scope 3 Calculations:
Scope 3 data collection and reporting can be understood with the help of the following reference architecture in Fig 2. that leverages AWS services. The architecture talks about three stages:

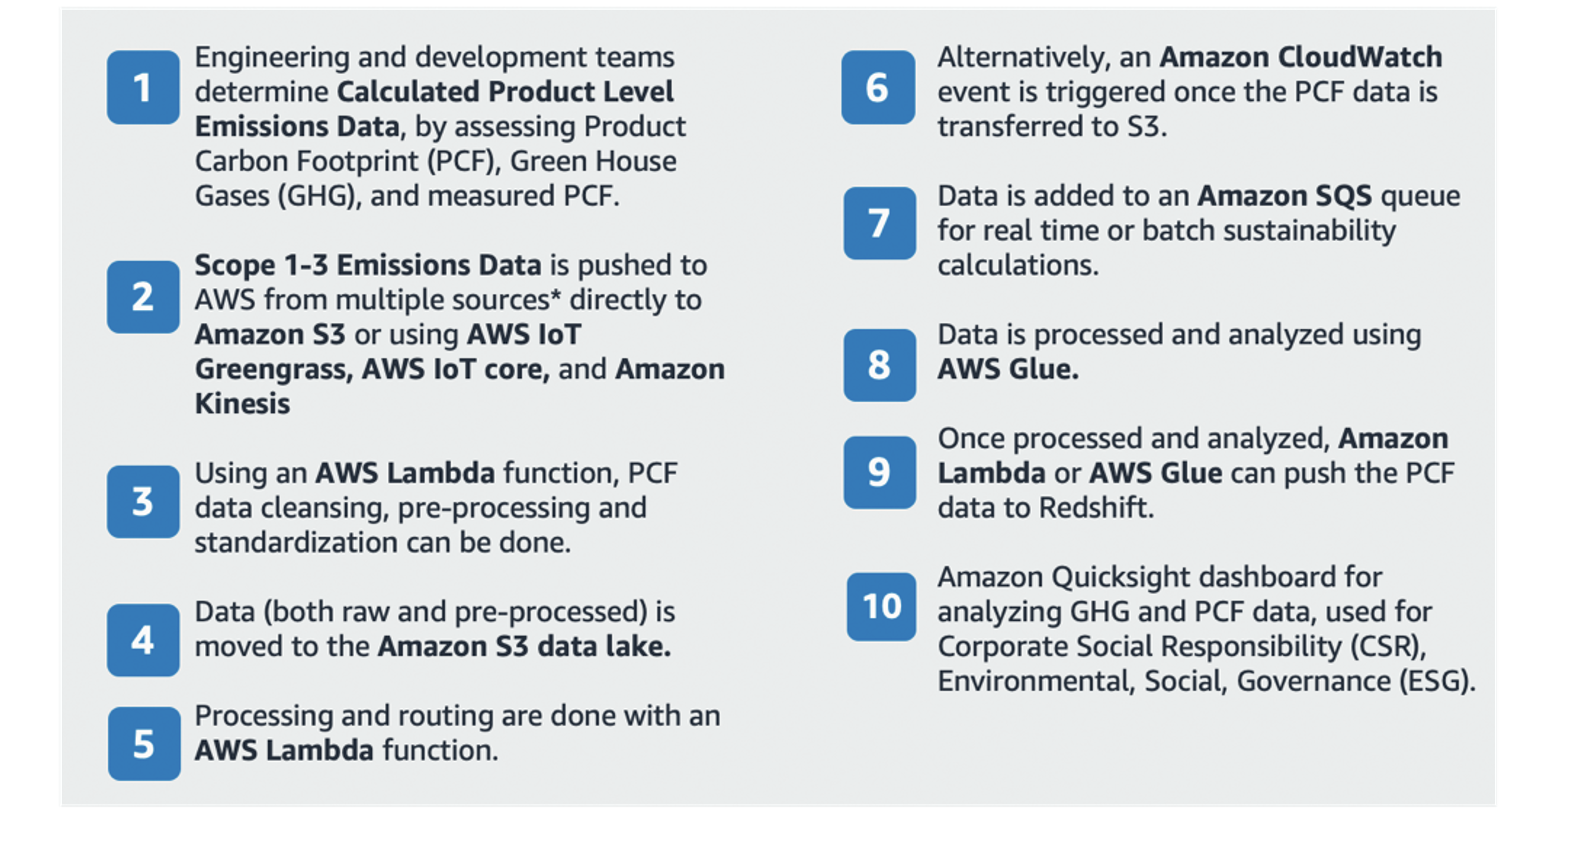
Data Collection:
Scope 1-3 Emissions Data gets pushed to AWS from different sources either via IOT services or a direct S3 upload. In this scenario, we are getting the product level emissions data including attributed Scope 1 & 2 Foundry emissions, and Scope 3 Foundry emissions from procurement (including excess/waste materials and defective wafers).
Data Modeling and Analytics: Once the data has been collected, it needs to be cleaned and prepared for analysis. PCF Data Cleansing, Pre-Processing and Standardization can be done and then pushed to the Sustainability Data Lake. The architecture talks about writing processing code within lambda functions, but you can do the same within any of our ETL services or low code data preparation tools such as Glue Data Brew and Amazon Sagemaker Data Wrangler.
Tracking and Reporting: Once we have all the data in our sustainability data lake, we have a Routing and Processing Lambda function that periodically extracts data for sustainability ROI calculations. The PCF Data gets added to SQS queue for real time sustainability calculations or a CloudWatch event could be triggered once PCF lands in S3 to trigger the glue job or the lambda function. They would then process the data, add the calculation metrics and push the results to a data warehouse of choice for example – Amazon Redshift. The analyzed PCF data can then be pulled into a QuickSight dashboard for sustainability reporting.
Conclusion
Customers can benefit from product life-cycle assessment and carbon data management solution built on AWS cloud to support enterprise-wide carbon accounting information in a secure, compliant, and auditable framework for overall decarbonization measurement, tracking and reporting. This solution can be utilized to accelerate decarbonization programs through use cases such as decarbonization opportunities’ identification, forecast of decarbonization scenarios, Identification of trends and patterns from existing programs, organizations and scope 1, 2, and 3 emissions tracking. Please visit the AWS Solutions Library for Semiconductor Industry solutions for sustainability.