Front-End Web & Mobile
Improving GraphQL Observability with AWS AppSync Tracing Support
This article was written by Heitor Lessa, Principal Specialist Serverless Lead AWS
September 14, 2021: Amazon Elasticsearch Service has been renamed to Amazon OpenSearch Service. See details.
Today, I’m excited to tell you about the new AWS X-Ray native integration with AWS AppSync released a couple of weeks ago. Previously, if you wanted to determine performance bottlenecks on GraphQL operations in AppSync, you had to rely on custom logging and analysis to diagnose issues. This new feature enables you to quickly gain insights into the performance of GraphQL APIs, allowing you to pinpoint the root cause of slow operations across all data sources supported in AppSync.
Overview
AWS AppSync is a managed service that uses GraphQL to make it easy for applications to get exactly the data they need. With AppSync, you can build scalable applications, including those requiring real-time updates, on a range of data sources such as NoSQL data stores, relational databases, HTTP APIs, and any custom data sources with AWS Lambda.
AWS X-Ray helps developers analyze and debug distributed applications, such as those built using a microservices architecture. With X-Ray, you can understand how your application and its underlying services are performing in order to identify and troubleshoot the root cause of performance issues and errors.
Enabling tracing for an existing AppSync API
You can enable X-Ray tracing on your GraphQL API through the AWS AppSync console.
- Sign in to the AWS AppSync console.
- Choose Settings from the navigation panel.
- Under X-Ray, click the toggle to Enable X-Ray.
- Choose Save. X-Ray tracing is now enabled for your API.
As your GraphQL API receives new requests, you should start seeing an updated Service Map with AppSync and all GraphQL operations in the X-Ray console.
Before you ask, all data sources as well as automation with CloudFormation are fully supported.
Use cases
We’ll use the Serverless Airline app to showcase useful aspects and examples on how you can leverage the X-Ray integration and tracing with AppSync. This is a full-stack web application that provides flight search, booking, payment, and loyalty services for users. For more information on how to deploy and replicate these use cases at your own convenience, take a look at the AWS Serverless Airline Booking on GitHub. You can install and deploy the application in your AWS account with 1-click using the Amplify Console.

Quickly discover unoptimized resolvers
Searching flights for your next vacations should be a quick and enjoyable experience. If a flight search result takes hundreds of milliseconds (or seconds even) it impacts the customer experience. If that ever happens, we want to be able to find out why and what areas we can improve in our application.
A quick way to find user calls searching for flights stored in the application’s DynamoDB Flight table is to filter all GraphQL operations that used the specific Amazon DynamopDB table. In order to do that, you go to the X-Ray Console, choose Traces and then use a filter expression to list all traces that match the criteria.
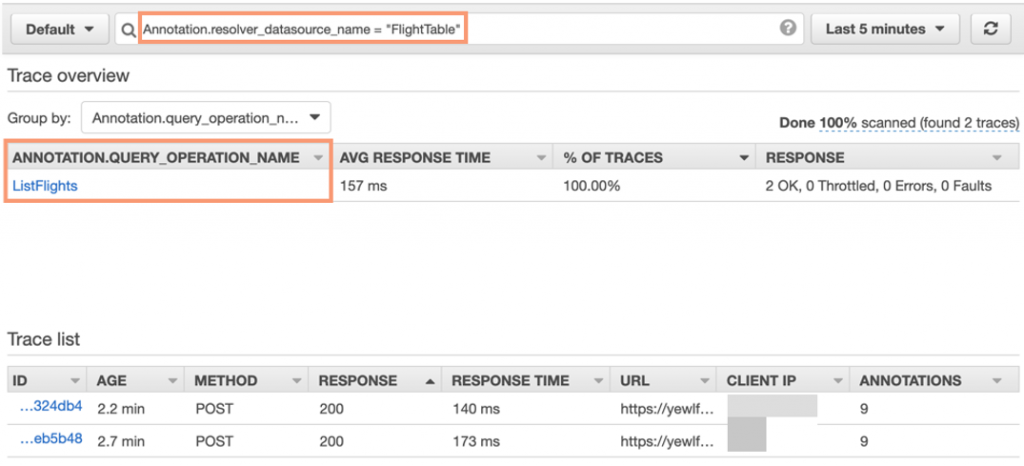
In the Trace view, there are few useful areas you should know:
Annotation.resolver_datasource_name = “FlightTable”– This is the filter expression to only retrieve traces that match AppSync GraphQL Resolvers that interacted with the DynamoDB Flight table.Group by: Annotation.query_operation_name– We can group traces by a number of new annotations that AppSync provides to ease our analysis, such as Field Name (e.g.listFlights), Operation (e.g. Query, Mutation), Data source type (e.g. DynamoDB, Lambda) and more.
Choosing one of the traces available gives you more details about the operation.

In the Trace details view, these are key areas to observe when analyzing AppSync traces:
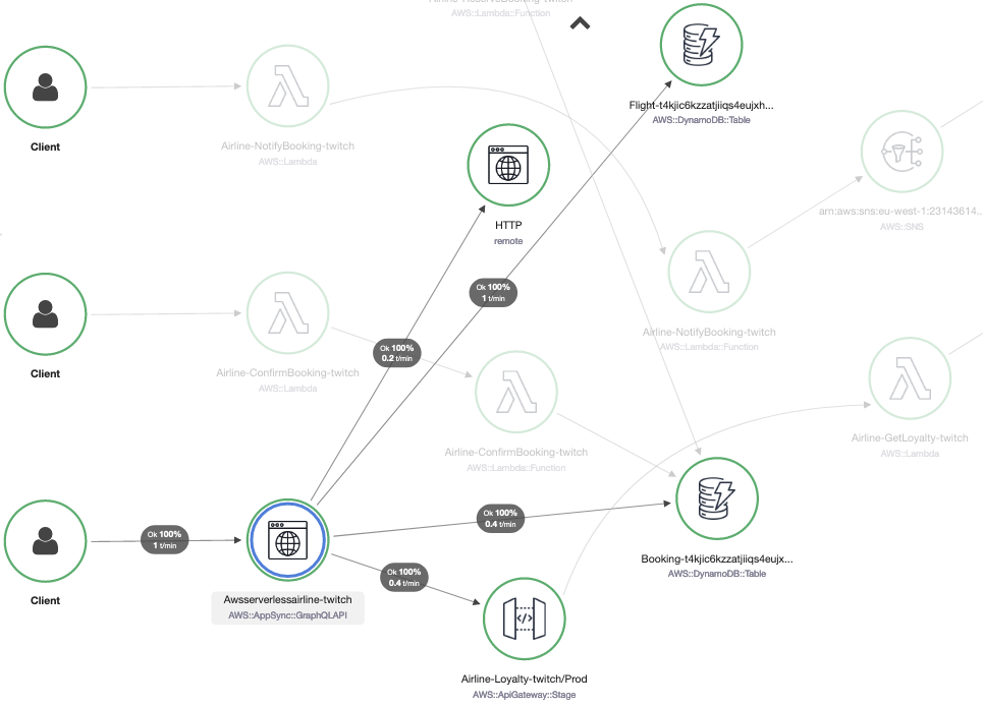
- Trace Map helps you quickly visualize what data sources AppSync used to fetch/mutate data. In a complex scenario, AppSync may have to call multiple data sources such as Amazon OpenSearch Service (successor to Amazon Elasticsearch Service), Amazon Aurora, AWS Lambda functions or an HTTP Endpoint.
- GraphQL Element Path helps you understand the path to the GraphQL operation being resolved in the AppSync GraphQL engine, including request mapping stats. In a more complex scenario, you can have nested queries, use Apache Velocity Template (VTL) to fetch data from stash, or run custom authorization logic before calling a resolver.
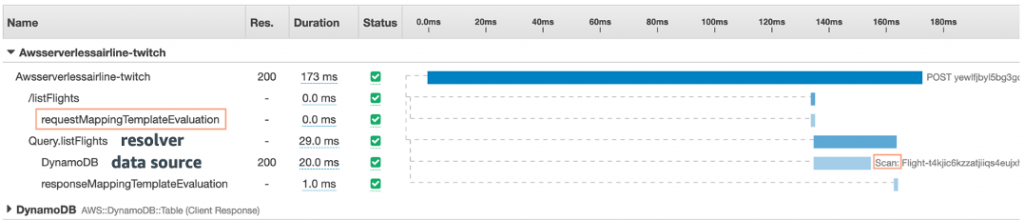
- GraphQL Resolvers are helpful to identify performance bottlenecks when fetching or manipulating data through data sources. In this example, notice that our resolver is using a DynamoDB Scan operation resolving the
listFlightsquery. This can be improved by changing it into a DynamoDB Query so we don’t scan the entire table for flights we may not want to.
By default, annotated GraphQL schemas using the @model directive with the Amplify Framework GraphQL Transform will generate list operations using a DynamoDB Scan. With pagination, infinite scrolling, and during the development prototyping phase this may not be an issue, however, as our user base and data grows it could quickly lead to a performance bottleneck. You can also use the GraphQL Transform @key directive to easily create custom indexes on DynamoDB to further optimize your queries.
Integrating GraphQL with existing REST APIs
In the Serverless Airline app, customers earn loyalty points upon successful flight bookings. If a customer wants to see their points, their current loyalty tier and progress to the next tier, we need to integrate our AppSync GraphQL API with our existing Loyalty REST API.
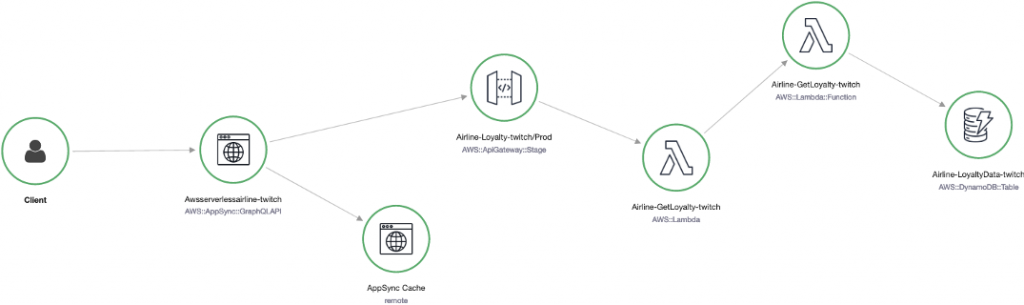
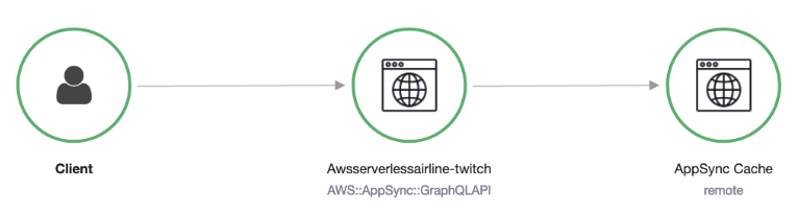
With this new tracing feature, we are able to visualize loyalty requests end-to-end by choosing Service Map in the X-Ray Console:

The map allows to easily and quickly visualize and trace the connections and services for a given API call. You repeat the previous steps to find more details about this transaction by selecting View traces and choosing any trace available.


In the Trace details view, you can see AppSync connecting to an HTTP data source, which in this case is our Loyalty REST API managed by Amazon API Gateway. In this trace, we can see the Loyalty REST API invoked a Lambda function (GetLoyalty) that then fetched data from the LoyaltyData DynamoDB table.
Enabling caching and evaluating performance results
Calculating and displaying loyalty points in our use case doesn’t change frequently, and it’s a potential area of improvement where we could experiment enabling the built-in AppSync caching to increase performance then evaluate the customer experience impact. For more information on when and how to enable caching for GraphQL operations, refer to the AppSync Caching launch blog post.
After enabling caching for the getLoyalty query on a per user session basis, you return to the X-Ray Console and again choose Service map:
You quickly notice we have a new node on our map – AppSync Cache. To continue our cache analysis, you choose Traces and filter for all Loyalty related query operations using a filter expression: Annotation.aws:appsync_query_operation_name = "getLoyalty"

You pick one of those traces that missed the cache to better understand the AppSync caching operation:

Notice that AppSync Cache appears twice in the Trace view – The first operation was our cache miss, then the GraphQL path resolution continued (Query.getLoyalty), and before returning to the client it hydrated the cache. By contrast, this is what it looks like when our transactions hit the cache.

Catching exceptions in the GraphQL engine
Different from REST, GraphQL returns HTTP 200 responses whether parts of a query succeeded or not at all, and the client has to detect if errors are sent as part of the response. That means, if we made a mistake when creating a malformed custom resolver, or if one of our data sources returned errors it wasn’t trivial to pinpoint exactly the culprit.
With the new tracing feature, we are able to quickly visualize issues by choosing Service Map in the X-Ray Console:

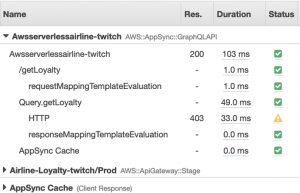
Picking any trace available where AppSync tried connecting to API Gateway, I can see that we had an authorization issue (HTTP 403).
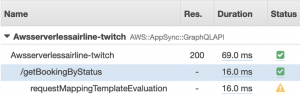
Alternatively if we manually remove a bracket from any mapping template to force a malformed syntax error, X-Ray would also show us the error within the Trace view as well as the Exceptions details.

Available now!
Tracing support for AWS AppSync is available today in all regions where AppSync is offered, as described in the AWS Region Table. You can enable tracing into your existing AppSync APIs, or quickly enable the integration when you create a new GraphQL API managed by AppSync.
There is an additional charge based on the number of traces recorded, retrieved, and scanned by AWS X-Ray. For more information, visit our pricing page.
I’m excited to see the level of operational observability and visibility this new feature provides, and how you can combine X-Ray Trace Groups, and built-in annotations to slice and dice GraphQL operations with ease.
Give that a try, and please send us your feedback, either on the AWS Forum for AWS AppSync, the AppSync Community repository, or through your usual AWS Support contacts – Go build with AppSync and X-Ray!