Microsoft Workloads on AWS
Setting up monitors for .NET Application and SQL Server using Application Insights
Many Windows-based applications are .NET applications. They use SQL Server in the backend to retrieve and persist data. Often in the journey to the cloud, a rehost decision is made for such a solution using a simple lift-and-shift approach. When such applications are hosted on the Amazon Elastic Compute Cloud (Amazon EC2) Windows platform, native Windows-based tools can be used to monitor the health of these applications at a server level. However, getting a holistic view across the different components and servers deployed as part of the solution is a challenge. This pain point can be addressed by Amazon CloudWatch Application Insights.
CloudWatch Application Insights is a service targeting enterprise customers to help them set up monitoring for their applications in a unified manner on AWS with minimal effort. In addition to the ease in getting started, there is automation around setting up recommended metrics (platform, OS, and other agent-specific metrics), application and operating system logs, dynamic alarms, and automated detection of problems combining insights from CloudWatch, AWS Health, and other events.
In this blog post, we show you how to configure CloudWatch Application Insights to monitor an example solution and then simulate problem scenarios to test the monitors. The deployed scenario is a load-balanced web application with SQL Server in the backend hosted on different EC2 instances.
Solution Overview
In the following sections, let’s see how customers can easily get started with CloudWatch Application Insights monitoring a .NET application using SQL Server running on an EC2 instance. The deployed configuration has two EC2 instances hosting the Barley Adventure Works application, which are load balanced and are accessing SQL Server hosted on different EC2 instances. This setup will be used to simulate problems showing that the application is not working as expected. If this was a real-life situation, there would be a need to quickly identify, isolate, and resolve the issue. In this example, we discuss how easy it is to set up end-to-end monitoring using CloudWatch Application Insights. We further discuss how to use Application Insights to configure, isolate, and resolve issues with the application.
The diagram in Figure 1 describes the components of the solution, which is deployed using a CloudFormation template:

Figure 1. Solution Architecture Diagram
Walkthrough
Here are the high-level steps we will walk through:
- Setup/configure CloudWatch Application Insights for the application
- Simulate a problem scenario and observe the issue in the CloudWatch Application Insights dashboard
- Run through a sequence of steps to identify the issue
- Dig deeper for details into the issue
- Compare what steps would need to be done in the absence of CloudWatch Application Insights
Prerequisites
For this walkthrough, you should have the following prerequisites:
- An AWS account
- AWS Services used
- Amazon EC2
- Application Load Balancer
Deploy the resources for the example scenario
To ensure that the example scenario will be ready to test “out of the box,” there is a CloudFormation template provided that will deploy 3 instances as follows:
- One EC2 instance hosting Microsoft SQL Server Database.
- Two load-balanced EC2 instances, each hosting the Barley Adventure Works web application.
This will take approximately 10 minutes to complete, with most of that time being used for the services to be provisioned.
Once you have taken care of the prerequisites, follow these steps:
- Select the Launch Stack button to launch a CloudFormation stack in your account in the US East (N. Virginia) Region. To switch to the Region of your choice, click on the Region selector in the upper-right corner of the navigation bar.
 Select Next on the Select Template page.
- On the Specify Details page, give your stack a name such as “ApplicationInsightsDemo.”
- Under Parameters, review the default parameters for the template and modify the values, if desired.
- Select Next and either create a new key pair or choose an existing one to log into the EC2 instance, if required.
- Also enter a password for SQL Server following the guidelines in “Password Policy – SQL Server | Microsoft Docs” for the password.
- Select Next to continue to the Review page.
- Review and confirm the settings. Be sure to select the box acknowledging that the template may create AWS Identity and Access Management (IAM) resources.
- Select Create to deploy the stack.
- Monitor the status of the stack deployment from the Events tab of the CloudFormation stack. Once the stack is deployed successfully, proceed to the next section.
Setup Application Insights Monitors
- Navigate to AWS Resource Groups on AWS Management Console as demonstrated in Figure 2 and create a new resource group as demonstrated in Figure 3:

Figure 2. AWS Resource Groups Menu
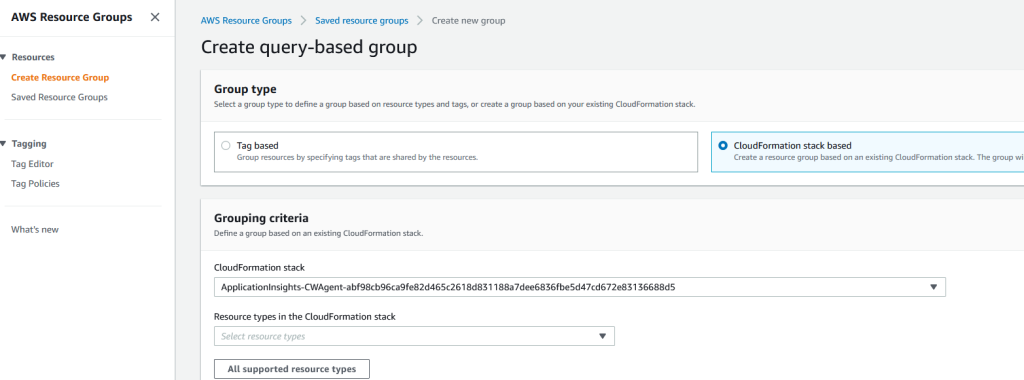
Figure 3. Create query-based group
- Select ‘CloudFormation Stack based’. Then enter the group name within group details section and select ‘Create group’.
- Navigate to CloudWatch dashboard, then choose Insights -> Application Insights from the menu and then select ‘Add application’. This launches the 4-step wizard as shown in Figure 4.
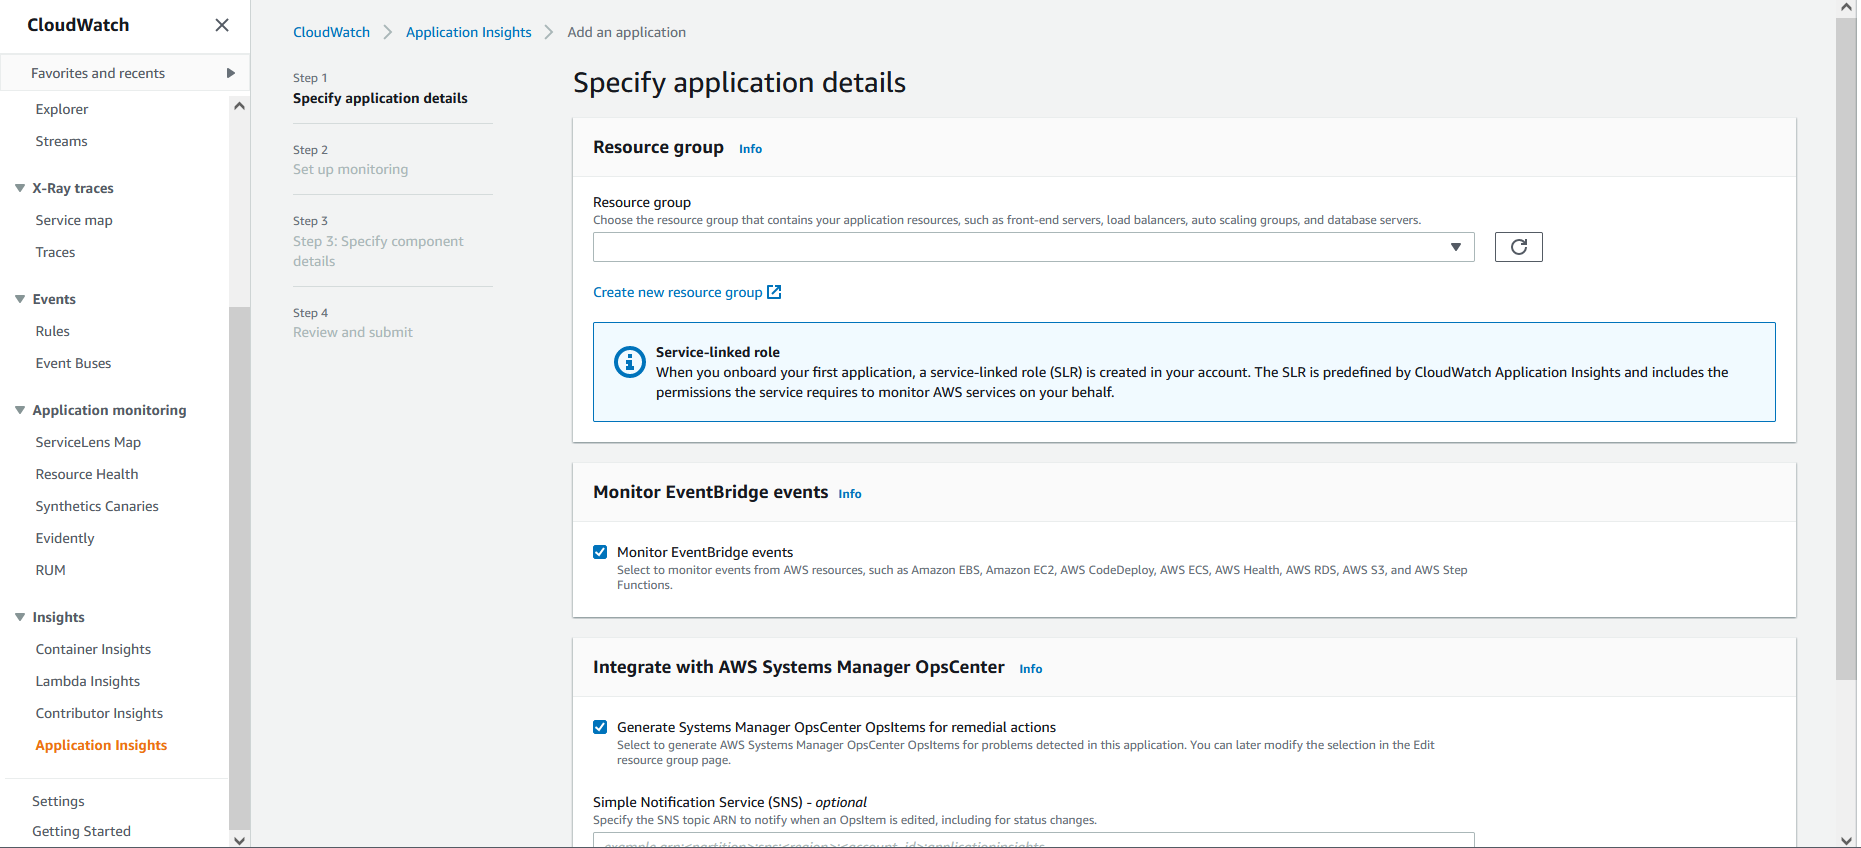
Figure 4 Step 1: Specify Application Details
- Choose the resource group created in the earlier step from the drop-down. If a resource group is not already created, you will get an option to add an application based on the entire account.
- Select ‘Next’ to navigate to step 2 of the wizard. In this step, we specify the component details to be monitored, as shown in Figure 5. The first dropdown for monitoring IIS is auto-selected, and in the second dropdown, Microsoft SQL Server is auto-selected. If for some reason, the Application type is not selected or you wish to change it, you can select the application type from the drop-down list. This sets up the preferred monitoring for both IIS and SQL Server components. Then select ‘Next.’

Figure 5 Step2: Setup Monitoring
-
- This launches step 3 of the wizard where you can specify additional component details as shown in Figure 6. Select ‘Next’ here. (Note that the IIS and SQL Server log paths are pre-filled.)
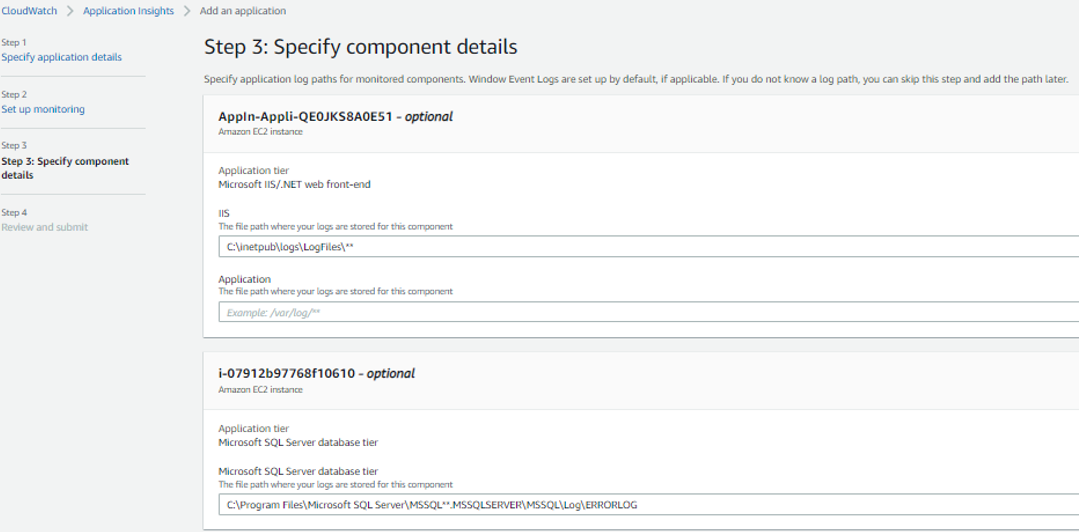
Figure 6. Step 3: Specify component details
-
- This launches the final step 4 of the wizard where we review all the information provided in the previous steps and submit, as shown in Figure 7. This completes the application monitoring setup process.

Figure 7. Step 4: Review and submit
-
- The dashboard view of Application Insights is launched, as shown in Figure 8. This dashboard summarizes the setup you just completed.
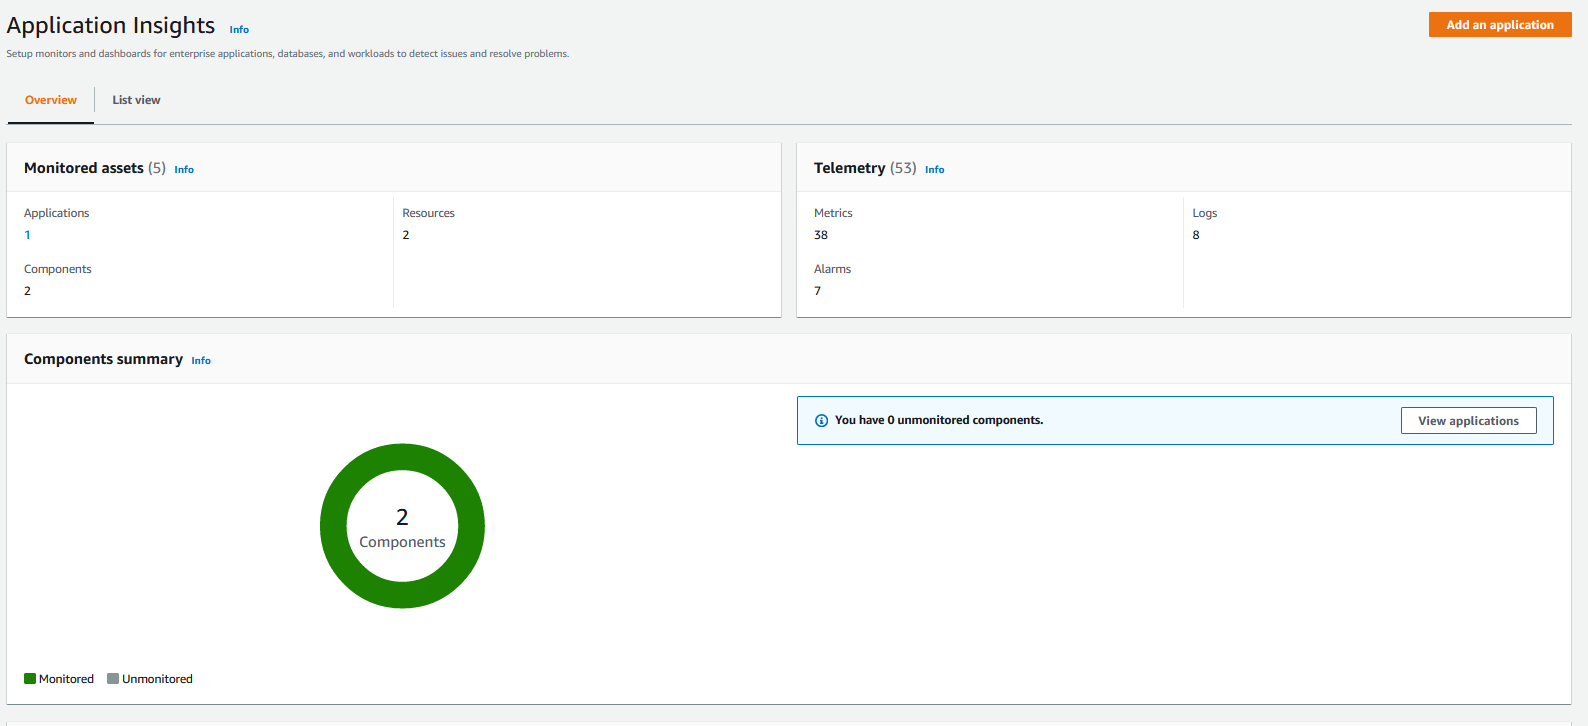
- Figure 8. Dashboard view of Application Insights
-
- Now monitoring is enabled for both load balancer, EC2 instances as well as SQL Server instance. Navigate back to the CloudWatch Dashboard to view alarms, as shown in Figure 9.

- Figure 9. CloudWatch dashboard Alarms
Simulate a problem and Watch Events using Application Insights
Let’s assume in this ASP .NET application that is backed by a SQL Server database, the following problems occur. Let’s go through the steps of simulating these one at a time and watch them surface in the dashboard.
To simulate problems #1 and #2, log into the EC2 machine running the database server (M4 instance type) using the key pair you chose at the time you created the CloudFormation stack. Follow these steps once you are logged in.
SQL Memory pressure
Let’s assume the SQL Server database suddenly begins to malfunction because of high memory pressure. This leads to application performance degradation and possibly timeout errors on the web servers and load balancer. To simulate this problem, let’s follow these steps:
- Launch SQL Management Studio and log in using the Windows administrator account.
- Right-click on the database server and choose properties.
- Select and lower the max memory to 256KB (as well as maybe min memory for SQL Query to 64KB)
- Then in a new query window, let’s run the following SQL query:
SELECT count(*) FROM [AdventureWorks2016].[Sales].[Customer]
An exception message is displayed, as shown in Figure 10:
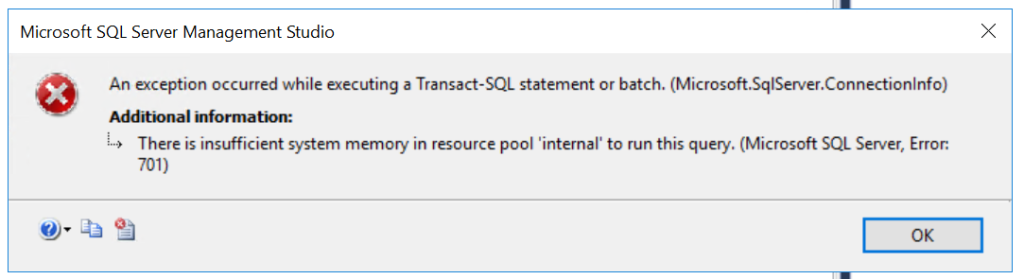
Figure 10. Microsoft SQL Server Management Studio Exception
Now navigate to CloudWatch to see the memory error, as shown in Figure 11.
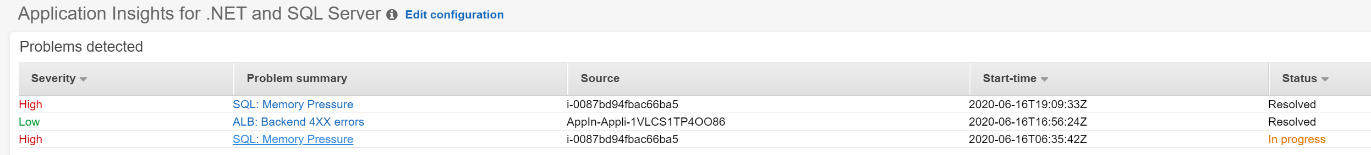
Figure 11. CloudWatch Application Insights
This aligns with errors logged in log group, as shown in Figures 12 and 13:
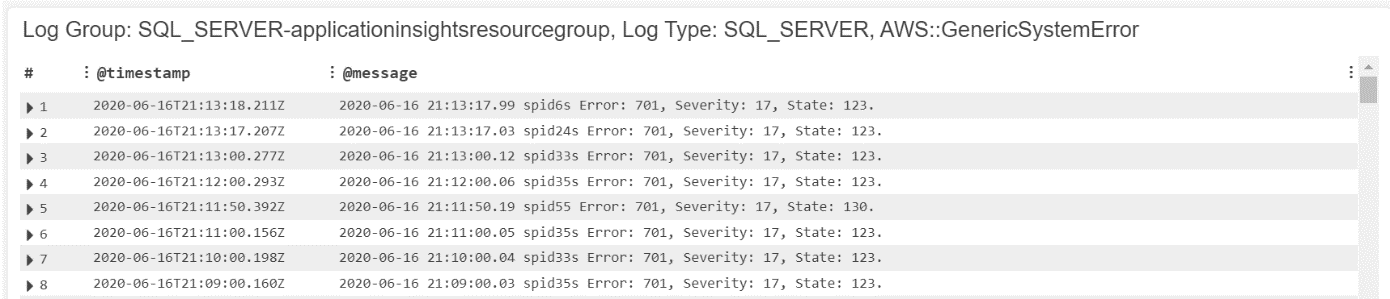
Figure 12. SQL Server Log Group
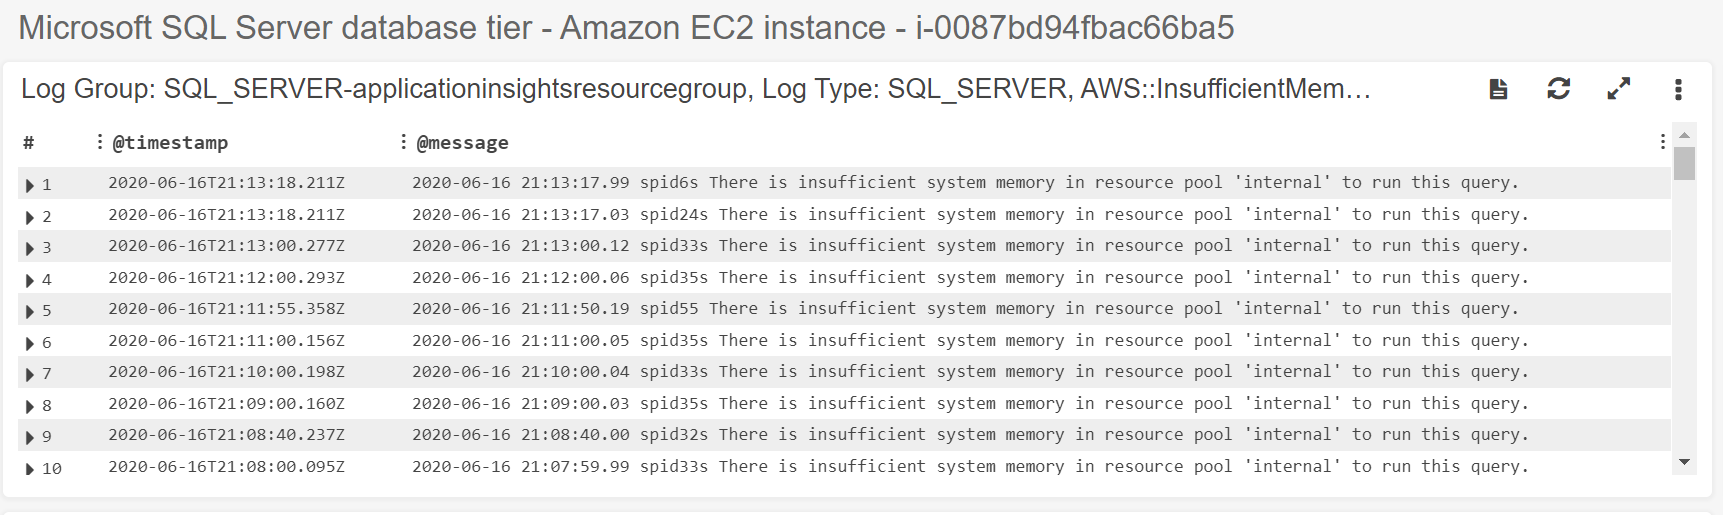
Figure 13. SQL Server Log group – Application Insights Resource Group
HTTP 500 Errors – unhandled exception for http request
An unhandled exception for a HTTP request to the web application throws a 500 error. To simulate this error, let’s follow these steps:
- From the AWS Management Console, navigate to the CloudFormation dashboard and choose the outputs tab of the CloudFormation stack that you launched earlier, as shown in Figure 14.

Figure 14. Output tab of CloudFormation stack
- Launch the WebsiteURL displayed for Adventure Works in a browser.
- Navigate to the customer details page of the Barley Adventure Works web application by concatenating this to the above URL: /SalesOrderDetails/edit/5
- Refresh the above compiled URL a couple more times. It will look something like this:
http://YourURL.us-east-1.elb.amazonaws.com/sampleapp/SalesOrderDetails/edit/5 - An error is displayed, which is expected.
- Navigate to the CloudWatch Application Insights dashboard in the AWS Management Console and the 500 error shows up, as shown in Figure 15:
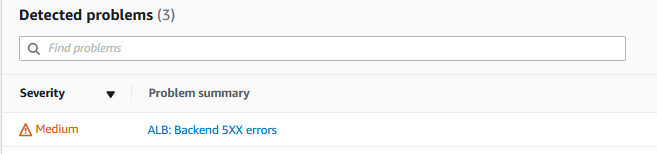
Figure 15. Application Insights dashboard
Select the ALB Backend 5xx errors hyperlink, as shown above, and the following graphs are displayed, as shown in Figures 16 and 17:

Figure 16. ALB Backend 5xx errors

Figure 17. Backend 5XX errors – Application Insights
Cleaning Up
Customers should delete example resources if they no longer need them to avoid incurring future costs. Following resource should help in deleting resources in this blog post:
- Deleting a stack on the AWS CloudFormation console
- Delete the application setup for monitoring from the Amazon CloudWatch console
New Features
Amazon CloudWatch Application Insights continues to enhance observability for additional workloads and AWS Resources. With CloudWatch Application Insights, customers can get extended monitoring support for MySQL, SQL Server High Availability (HA) configurations, AWS Lambda, containers, Amazon DynamoDB, Oracle, Java, SAP HANA, and PostgreSQL. Additionally, customers who deploy new SQL Server HA and FCI (Failover Cluster Instances) and SAP workloads using AWS Launch Wizard can enable 1-click monitoring on the Launch Wizard console using CloudWatch Application Insights. For customers who are using AWS Systems Manager Application Manager, CloudWatch Application Insights is now integrated and can be set up and used within the service.
Conclusion
In this blog post, we saw how to get started with monitoring your .NET applications using CloudWatch Application Insights. Application Insights continuously monitors metrics and logs to detect, correlate, and deduplicate anomalies and errors to reduce mean time to repair. The automated dashboards help you take remedial actions to keep your applications healthy and to prevent impact to the end users of your application. This service automates the activities to identify and track down the issue—in our example, we used a SQL memory pressure issue — by logging into the EC2 instance and checking the SQL Server error logs. We learned how to test for specific errors and see them displayed on the Application Insights dashboard for quick analysis and remediation.
In the absence of configuring CloudWatch Application Insights, a user would have to log into each EC2 instance and sift through the logs to identify the problem. This can be time-consuming and may lead to further downtime, especially in production scenarios where time is of the essence. CloudWatch Application Insights helps by correlating problems using intelligent problem-detection patterns to display them in the dashboard quickly. The goal is to simplify the monitoring of the application and allow users to quickly identify problem(s) within their application.
References
- How Amazon CloudWatch Application Insights for .NET and SQL Server works
- Setting up your application for monitoring
- Logs and metrics supported by Amazon CloudWatch Application Insights for .NET and SQL Server
AWS can help you assess how your company can get the most out of cloud. Join the millions of AWS customers that trust us to migrate and modernize their most important applications in the cloud. To learn more on modernizing Windows Server or SQL Server, visit Windows on AWS. Contact us to start your modernization journey today.