AWS Cloud Operations Blog
Amazon CloudWatch Metric Math simplifies near real-time monitoring of your Amazon EFS file systems and more
This blog was contributed by Helen Lin, Sr. Product Manager for Amazon CloudWatch and Darryl S. Osborne, Storage Specialist Solutions Architect
Today, we’re releasing a new feature in Amazon CloudWatch called Metric Math that makes it easy to perform math analytics on your metrics to derive additional insights into the health and performance of your AWS resources and applications. As you may already know, CloudWatch is a monitoring solution for both your AWS resources and on-premises devices, providing default metrics for the AWS services you use while enabling you to also monitor custom application metrics or system metrics.
With CloudWatch Metric Math, you can now easily convert your CloudWatch metrics such as count of errors or database total IO bytes to metrics that give you a sense of scale and speed, like IOPS, throughput, and percent error rate metrics. In addition to rate and throughput metrics, you can also aggregate individual resource metrics into a cluster or fleet-wide view by using functions as such SUM on a group of metrics. Metric Math supports simple mathematical operations such as addition, subtraction and functions such as SUM, ABSOLUTE, STANDARD DEVIATION, and more. For sparse metrics that publish values at irregular intervals, such as HTTP error counts, you can use a FILL function to fill in default values such as zeros for empty values to make the metric easier to perform math on or to graph. You can create these metric math expressions directly in the CloudWatch console or by using the new GetMetricData API operation which allows for both metric math retrieval and bulk metric retrievals.
Using Metric Math for Amazon EFS Metrics
To show you how Metric Math can be used for operational monitoring, let’s dive deep into a specific example using Metric Math to simplify monitoring your Amazon EFS file systems’ performance. The best way to understand the workload your file system serves is by monitoring the metrics Amazon CloudWatch collects and processes. By monitoring the EFS CloudWatch metrics TotalIOBytes, DataWriteIOBytes, DataReadIOBytes, and MetaDataIOBytes in the CloudWatch console, you can see your file system performance in near real-time. These metrics are sent to CloudWatch at one-minute intervals and are available for the next 15 months, so you can access historical information about the workload that has run on your file system over time. The different IOBytes metrics give you the number of bytes for each file system operation (e.g., data read, data write, metadata, and total). To know the throughput of the different file system operations, you need to perform a math calculation on these metrics. For example, in order to know the total throughput of your file system, you take the sum statistic of the TotalIOBytes metric and divide by the number of seconds in the period. If you’re like me, you have a hard time doing calculations like this in your head as you’re monitoring the CloudWatch console in real-time. We no longer have to worry about this because Metric Math solves this problem for us. With Metric Math, you add an expression to a graph or line widget, and it does the calculation for you in real time.
Here’s an example of how I calculate total throughput using both the old way, and now the new way with Metric Math.
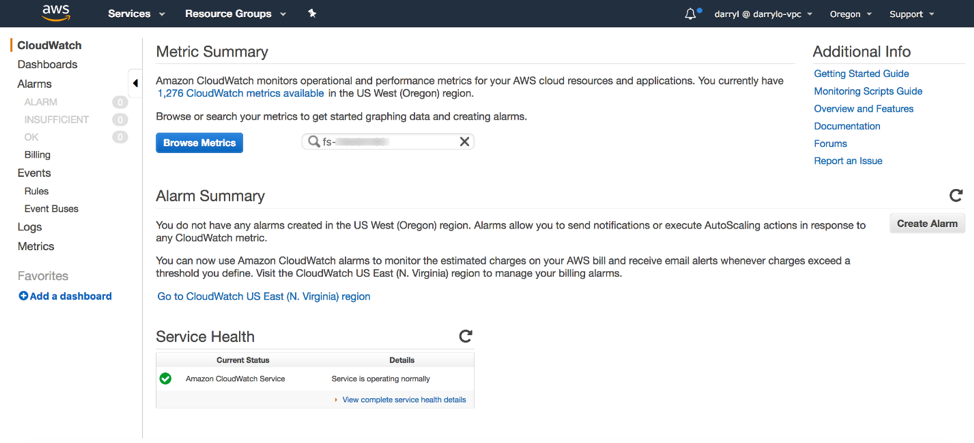
I open the Amazon CloudWatch console, enter my file system ID in the browse field, and press Enter.
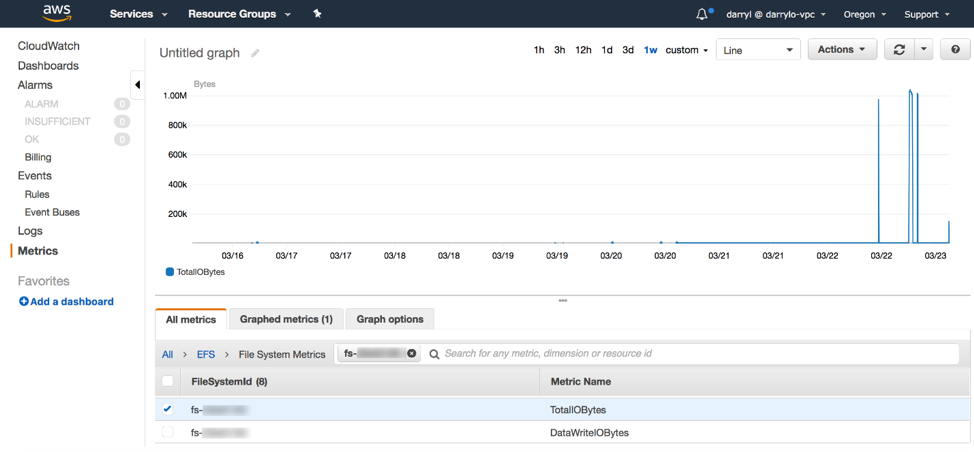
 I choose EFS > File System Metrics then select the check box next to the TotalIOBytes metric name.
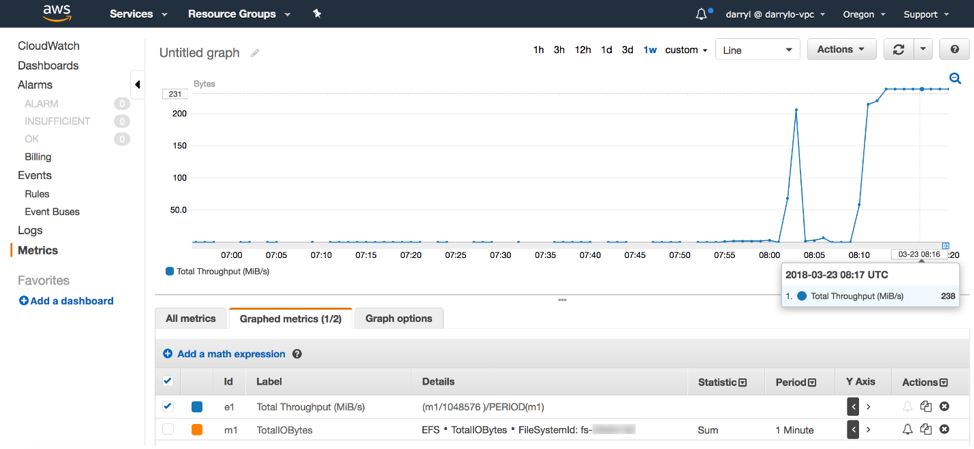
I choose the Graphed metrics tab and change the Statistic of the TotalIOBytes metric to Sum and Period to 1 Minute. I click+hold+drag over an area of the graph I want to zoom in to, then hover the pointer over a data point I want to view.
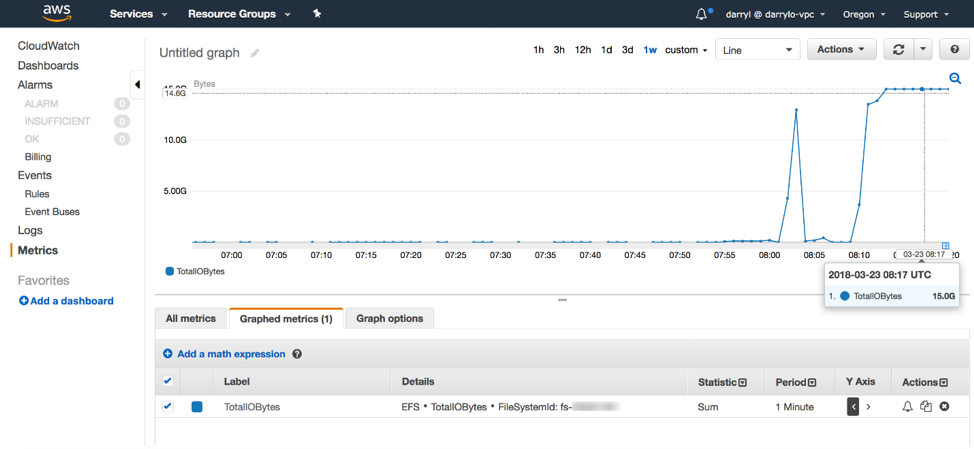
Old way:
I used to have to manually calculate the total throughput of the value displayed, 15.0G.
Total throughput (MiB/s) = ( Sum(TotalIOBytes) ÷ 1048576(to convert to MiB) ) ÷ seconds in the period
Total throughput (MiB/s) = ( 15,000,000,000 ÷ 1048576 ) ÷ 60 = 238.419 MiB/s
Metric Math:
Now I use CloudWatch Metric Math to do the calculation just once for the entire graph. I can also add this graph to a dashboard and refer back to it at a later time.
First, I choose Add a math expression and a new expression line is displayed.
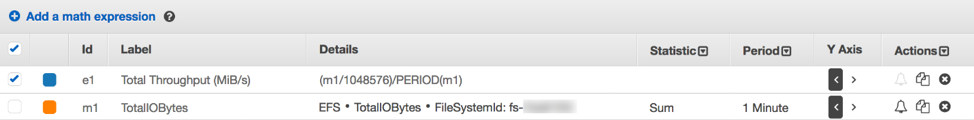
I optionally add the label Total Throughput (MiB/s) to make it easier for me to remember what the metric represents and enter the math expression in the Details field. This calculation takes the metric Id m1, which is the sum of TotalIOBytes for 1 minute, converts it to MiB by dividing by 1048576, then divides by the number of seconds in the PERIOD of metric Id m1. I unselect the check box of the m1 (EFS * TotalIOBytes…) metric so it doesn’t display in the graph. Now I have all the data points in this time series displaying total throughput in MiB/s.
I could use these same steps and create expressions to calculate data read throughput, data write throughput, and metadata throughput, and have all my throughput metrics displayed as MiB/s on this same graph.
The following are some file system metrics you could calculate using Metric Math.
- Total throughput (MiB/s)
- Metadata throughput (MiB/s)
- Data read throughput (MiB/s)
- Data write throughput (MiB/s)
- Available throughput (MiB/s)
- Percent metadata throughput (%)
- Percent data read throughput (%)
- Percent data write throughput (%)
- Total IOPS
- Metadata IOPS
- Data Read IOPS
- Data Write IOPS
- Percent metadata IOPS (%)
- Percent data read IOPS (%)
- Percent data write IOPS (%)
- Average total IO size (KiB)
- Average read IO size (KiB)
- Average write IO size (KiB)
You can also use this CloudFormation template that I created to build your CloudWatch Dashboard which includes these EFS metrics.
Using Metric Math for other Amazon CloudWatch Metrics
Metric Math is also useful for deriving new operational insights for other my Amazon resources. For example, I can calculate fault rates for my Elastic Load Balancing load balancers by creating this math expression in the CloudWatch console (using the Sum statistic):
Fault Rate = 100 * HTTPCode_Target_5xx_Count ÷ Request_Count
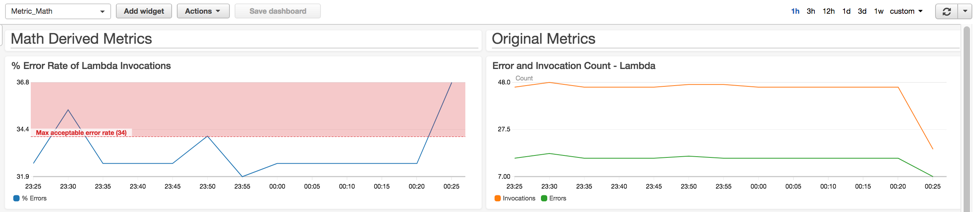
Or percent error invocations for my AWS Lambda functions:
% Error Rate = Errors ÷ Invocations
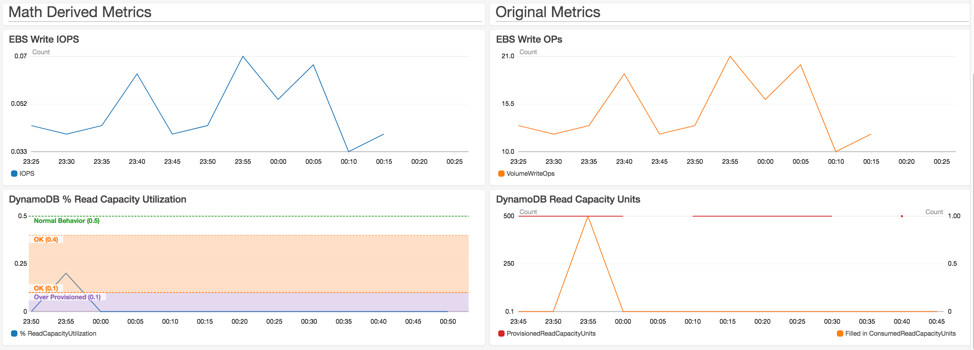
I also find it useful to monitor my Amazon DynamoDB tables with a % capacity utilization metric, such as:
% Read Capacity Utilization = 100 * ConsumedReadCapacityUnits ÷ ProvisionedReadCapacityUnits
% Write Capacity Utilization = 100 * ConsumedWriteCapacityUnits ÷ ProvisionedWriteCapacityUnits
To calculate the consumed read and write throughput, I take the Consumed Read and Write Capacity Units and divide that by the total number of seconds in that period, which I can use the PERIOD function to automatically calculate:
Consumed Read Throughput = ConsumedReadCapacityUnits ÷ PERIOD(ConsumedReadCapacityUnits)
I can also calculate IOPS metrics for my Amazon EBS volumes. I take the EBS Read and Write Ops metric and divide by the total number of seconds in that period, which I can use the Period()function to automatically calculate:
EBS Volume Read IOPS = VolumeReadOps ÷ PERIOD(VolumeReadBytes)
EBS Volume Write IOPS = VolumeWriteOps ÷ PERIOD(VolumeWriteOps)
As I’m creating new metric math expressions, I can add them to a CloudWatch dashboard for easy referencing and viewing.
I can also use the result of one math expression as a parameter for another math expression. If I don’t want to use the CloudWatch console, I can perform the same metric math calculations using the GetMetricData API action.
Available Now
CloudWatch Metric Math is available in all AWS Public Regions and the AWS GovCloud (US) Region. To get a full list of the mathematical operations and functions that Amazon CloudWatch supports, see the user guide. There are no extra charges to use CloudWatch Metric Math in the CloudWatch console. You can also retrieve math results using the GetMetricData API action, which follows the CloudWatch pricing for API requests.