AWS Cloud Operations Blog
An Observability Journey with Amazon CloudWatch RUM, Evidently, and ServiceLens
Observability means more than just monitoring. At AWS, we consider observability to be an integral component of healthy and secure operations. Two of the newest features of Amazon CloudWatch that enhance observability into your application’s health and operations are Amazon CloudWatch RUM and Amazon CloudWatch Evidently. In this post, we will take you through a journey of debugging an application from end-to-end using these tools, and how they are integrated with the rest of CloudWatch offerings for you to gain a complete picture of your users’ experience and application’s performance.
Before we begin, let’s be clear about what “end-to-end” really means. A true observability story includes the end user or customer’s use of your application. Today we will frame this through an example, where a user attempts to make a purchase on an e-commerce site and experiences a technical failure. We will walk through the entire path of the user’s journey – from the front-end web application, through an A/B test that another developer was running, the tools we use to quantify their interactions with the web application, and finally into the microservices backend. Note that while our e-commerce site is fictional, none of the technologies or experiences we describe here are, and this post describes real-world scenarios that we at AWS have personally experienced.
What are these new services?
It is common for developers and operators to describe logs, traces, and metrics as the building blocks of observability. From a service perspective, we use Amazon CloudWatch Logs, Amazon CloudWatch Metrics, and AWS X-Ray for traces. CloudWatch also provides powerful tools that collate, ingest, analyze, and derive insights across these three data types. There are open source-based alternatives that AWS is committed to supporting as well, depending on your objectives and application architecture.
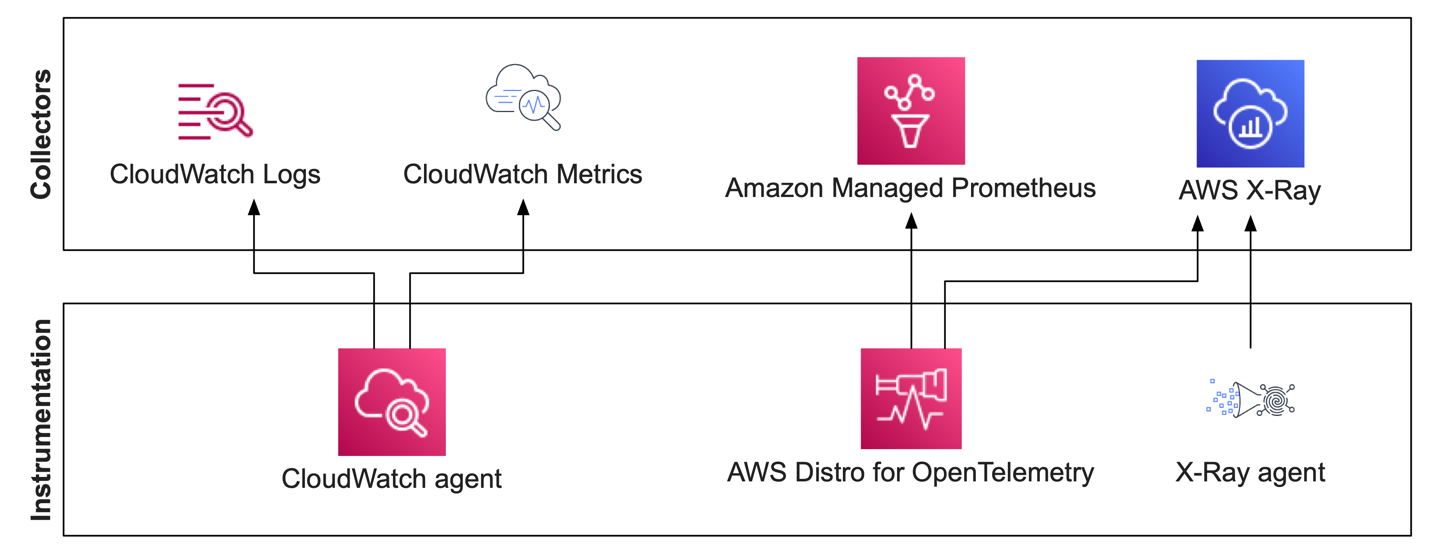
Here’s where the new AWS observability tools come in, helping you make sense of the data, through contextual linking of the insights as the issue traverses through the various components of the application and infrastructure. We do the hard work for you through managed and guided experiences, to avoid you having to tie the dots together yourself. Collectively, these services provide an application performance monitoring platform.
These services are what Amazon uses to gain observability into all of the services and platforms that we offer. Today, you must use a combination of these tools to gain visibility into the interactions with your web application. You may require an array of functionalities to gain insights into your web application by collecting the end user telemetry, measure an end user’s page load time, perform an experiment, or deactivate an application’s features through a toggle if this feature has an increased error rate.
Amazon CloudWatch RUM and Evidently complete the picture by doing exactly that, without you having to do the heavy lifting yourself. You can now easily gather real user’s application experience data and interpret it in terms of their sentiment or frustration, errors, and more than a dozen other event types. Moreover, CloudWatch provides a suite of features that target these needs explicitly.
Digital Experience Management (DEM)
Amazon CloudWatch DEM lets you monitor how your end users experience your applications, including performance, availability, and usability. For example, if a user loads a web page, they will have to wait for objects on that page to load, and for their browser to render this page, before they can proceed to interact with it. Every element of a web application – the HTML, CSS, images, JavaScript code, the time to draw the page, asynchronous calls to web services, etc. – will, in aggregate, compose the elements of a user’s journey. The CloudWatch DEM tools demystify these customer experiences, building on the core three primitives of observability, and giving your developers a powerful means to understand their end-users’ frustration – or delight – from your applications. At the latest re:Invent, CloudWatch introduced two new services that expand upon our existing DEM suite:
Amazon CloudWatch RUM is a real-user monitoring capability that helps you identify and debug issues in the client-side of web applications and enhance the end user’s digital experience. CloudWatch RUM enables application developers and DevOps engineers reduce the mean time to resolve (MTTR) client-side performance issues.
Evidently is a new Amazon CloudWatch capability that makes it easy for developers to introduce experiments and feature management in their application code. CloudWatch Evidently may be used for two similar but distinct use-cases: implementing shadow launches, also known as feature flags, and A/B testing.
Let’s make this real through an actual support experience
Our end user has just clicked on the “complete my purchase” button on their favorite e-commerce site, and they have just seen an error message after waiting a long time for the page to load.
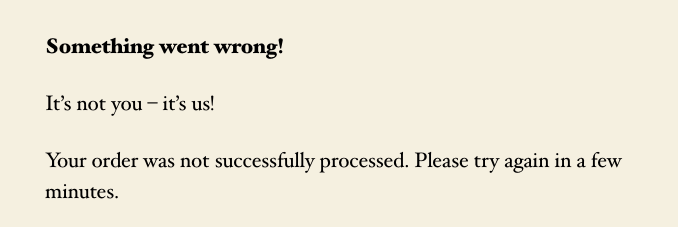
That’s not a good customer experience! However, since the e-commerce application has already been onboarded onto CloudWatch RUM, the moment after this error has been displayed, the RUM web client has already reported the error, page ID, session ID, an application trace ID, as well as several other critical statistics to CloudWatch RUM for analysis. While our customer patiently retries their purchase, you have already collected the data to learn what went wrong.
And, unfortunately, this single customer was not the only one having a failed purchase today! Using the data collected from this and other errant transactions, you are now armed to effectively debug the issue and make sure that it doesn’t impact any other future transaction. That’s the whole point, right? The catch here is, how soon can we do this? How can we ensure that what happened to this customer is isolated, or doesn’t happen in the first place? Let’s not get ahead of ourselves though, and instead focus on the issue at hand.
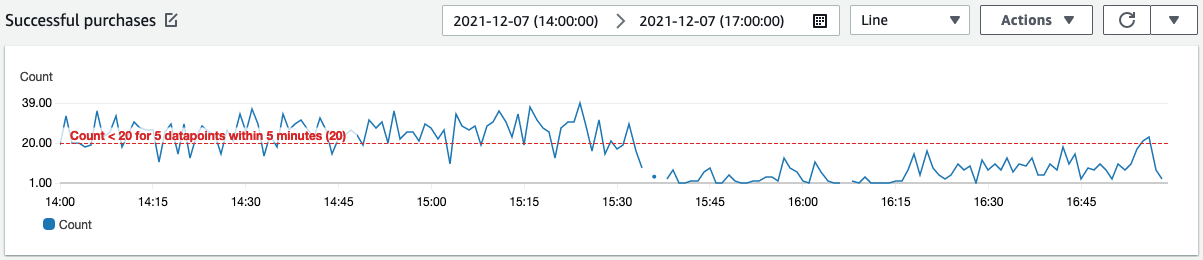
The development team that oversees the purchase page receives several alarms about status code 502 spikes on the purchase page. This is the first sign that there is an issue. Simultaneously, they observe in CloudWatch Metrics that the count of successful purchases has plummeted.
These developers understand that an experiment has been running that displays reworded text following a purchase attempt, and they suspect that a recent deployment may be an issue. Their first stop is the CloudWatch RUM console, where they can view the critical statistics of user experiences across their application. After all, it all starts with the customer!
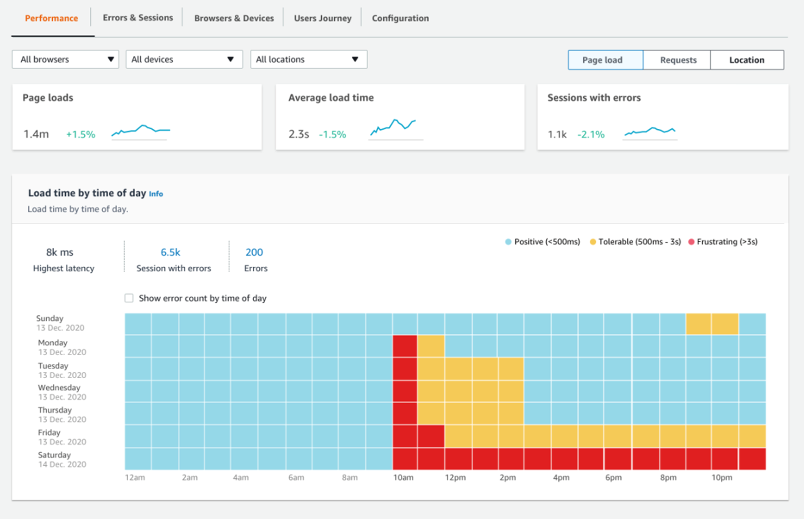
Clearly, there is an issue taking place! Seeing that the average page load time is causing a major problem, the developer views the Errors & Sessions page to gain more information.
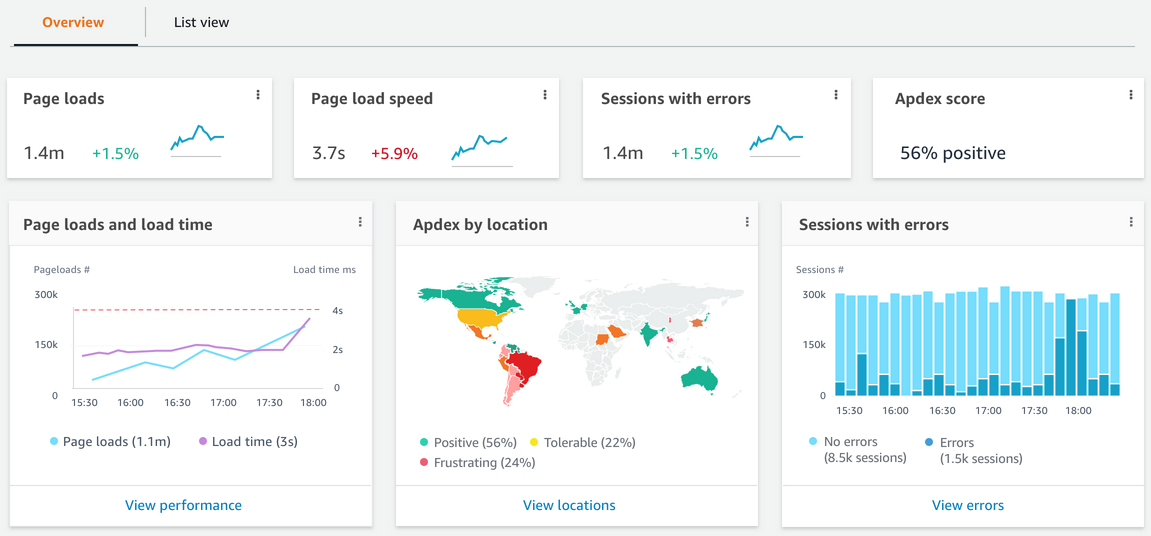
Developers can clearly see the issue occurring worldwide, thereby eliminating the possibility that it is isolated to a region, and they also see the errors originating across multiple devices. This meant that it wasn’t code issues related to a specific type of device. Great! We have narrowed down the problem a great deal here and understood that this is not a network problem (since it seems to be prevalent everywhere). Now we can focus on the application performance.
Through the Service Map, the developers see a few resources in error states, and also have alarms going off.
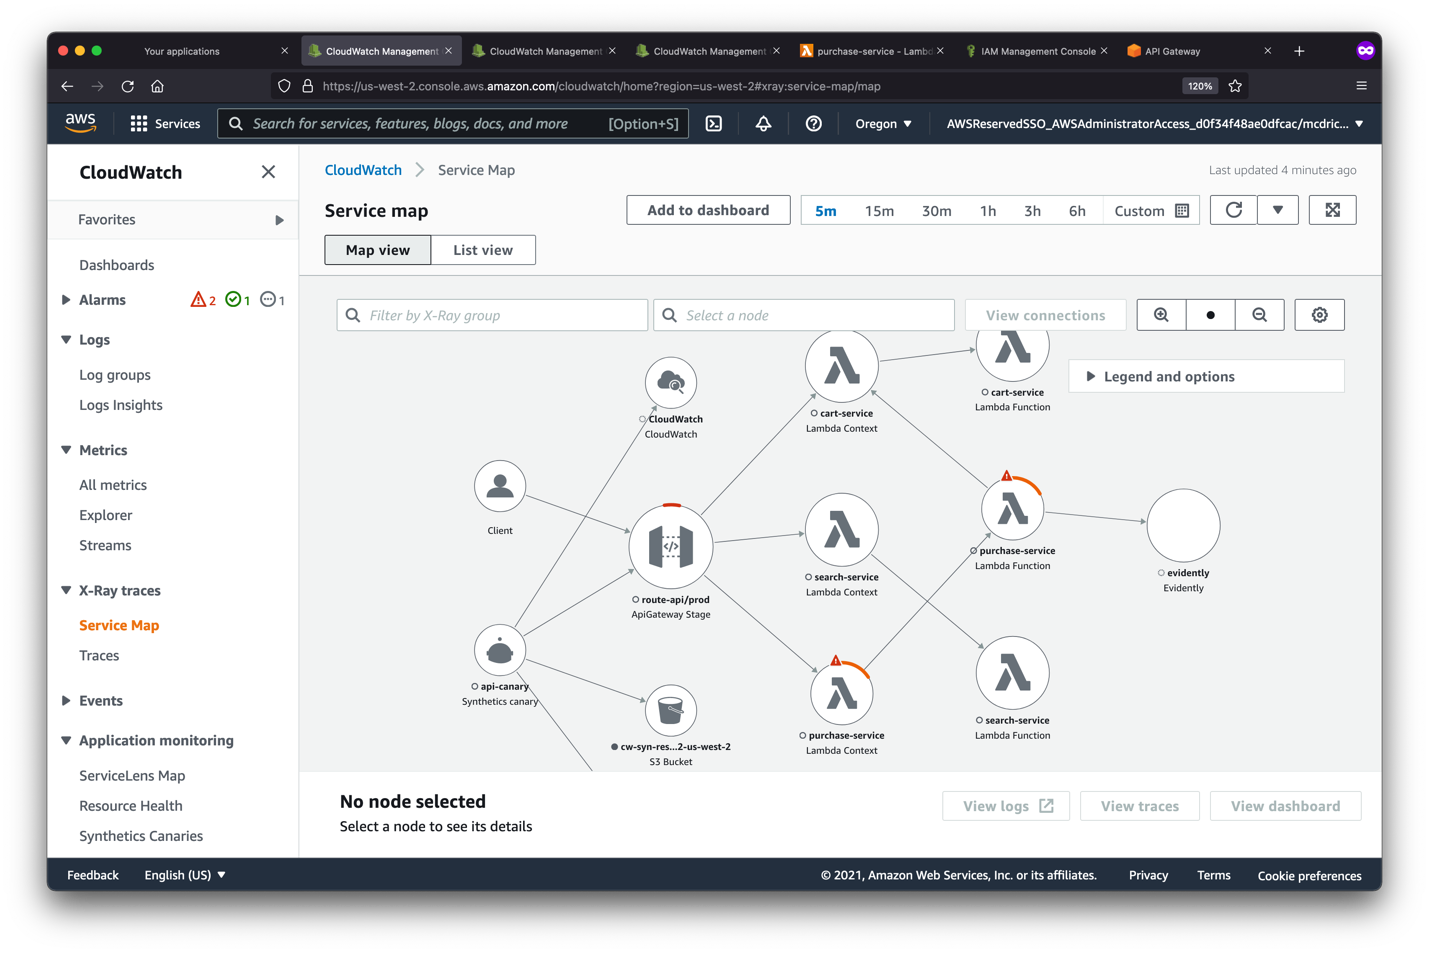
Examining a trace through these resources reveals the same application error of 502, and also correlates the logs from the application on the Lambda function. On further log inspection, we immediately find the bug: a mishandled type conversion in the code.

The developer has learned a number of things in just a few minutes:
- The issue is not regional, occurring with a specific type of device,
- it does not seem like a network issue,
- there is a bug in the code,
- 50% of purchases are failing,
- and the end-user’s experience on the site is poor.
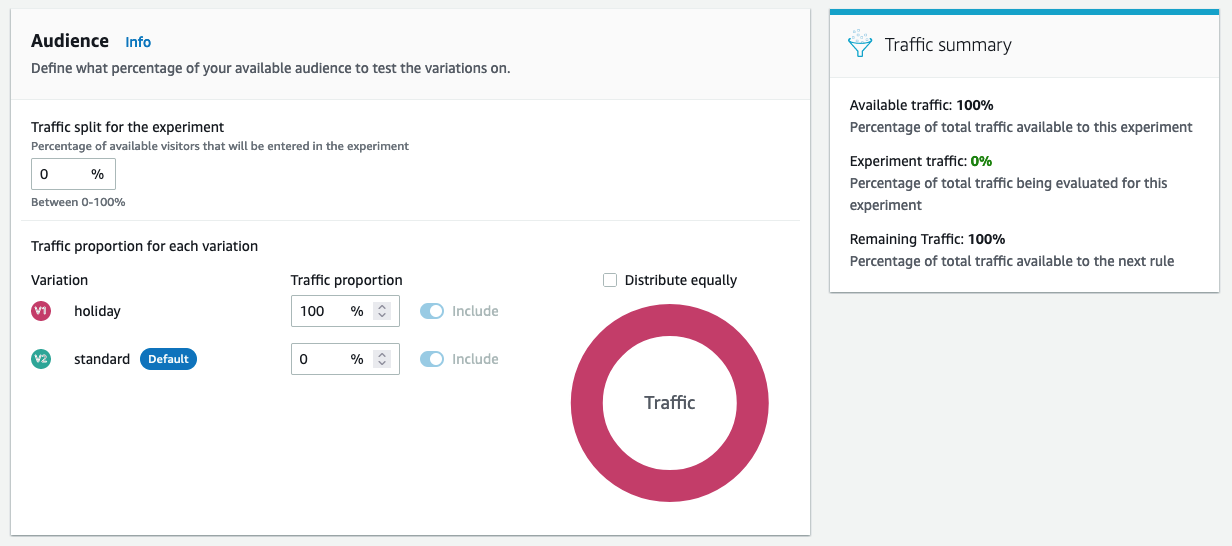
However, instead of doing an emergency deployment to production to fix the issue, a procedure that introduces other risks, they found some interesting pieces of information in the application logs. It looks like a different team in the organization is running an experiment on the purchase page to try out some new functionalities, and they have updated the core workflow of the customers, to include this experiment. When the developer opens the Amazon Evidently console, it shows them the number of users being sent to the experimental page view:

Ironically, this is very good news! At this point, because the new purchase page is a part of an experiment, the developer can immediately terminate it, sending all traffic back to the previous feature version. This will send 100% of traffic back to the healthy, old view of the purchase code. There is no need for a deployment at this time!
Crisis averted! And hopefully no one sees that error again, because what could possibly be worse for a customer who has done all of the shopping and selection, and is now unable to check out!
This team uses Evidently to routinely launch and experiment with application features, and past experiments have been conducted with great success. In this example, we see how the same tool can be used to mitigate an actual production issue.
Make this even better with automation
The example above is typical, and ubiquitous, although it does highlight manual intervention to resolve the problem. This is a great start! But relying on humans to perform this kind of service correction is not the most efficient method, and we strongly encourage you to use systems that can automatically recover from errors. Here we describe two easy updates that could have prevented this customer impact.
Using CloudWatch Synthetics
You can use Amazon CloudWatch Synthetics to create canaries, configurable scripts that run on a schedule, to monitor your endpoints and APIs. Canaries follow the same routes in your application and perform the same actions as a customer, which lets you continually verify your customer experience even when you don’t have any live traffic on your applications. By using canaries, you can discover issues before your customers do.
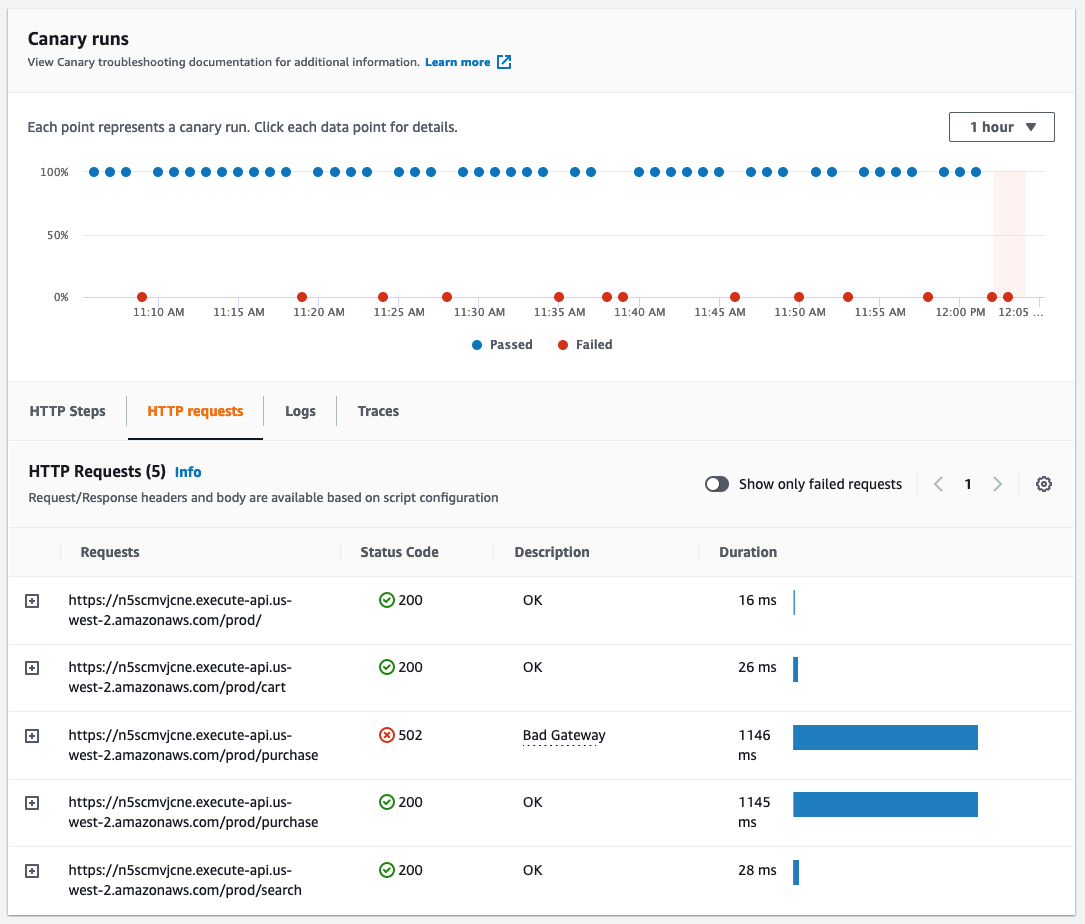
In this case, a canary could have alerted the developer team of the issue, before the error saw daylight on a customer screen. But we can create even more automation than this!
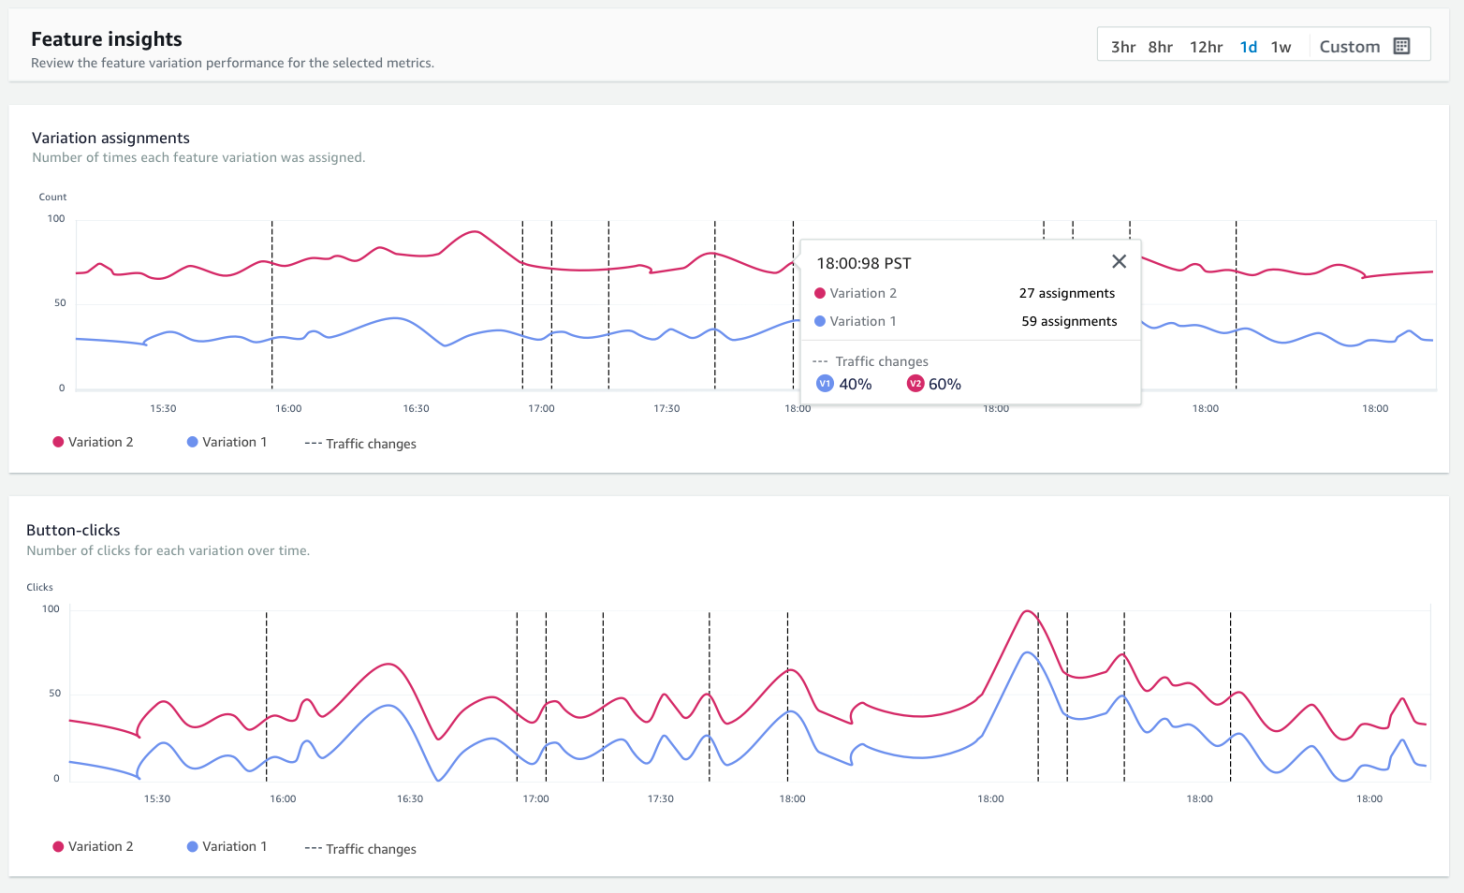
Using CloudWatch Evidently
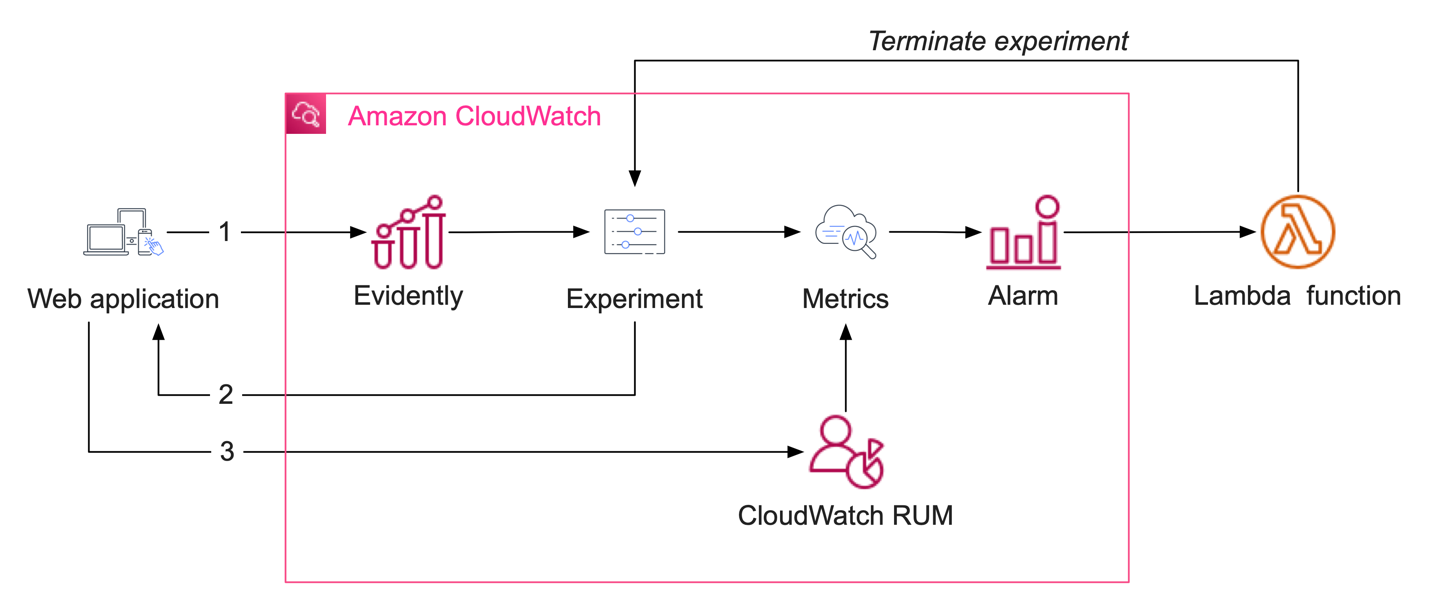
The actions that we walked through today are gated through Evidently, which can be interacted with programmatically – and dynamically – based on the health of your environment as observed by your end users. The most straightforward approach to automatically terminating an experiment or a feature launch that has gone awry is to have this done through the metrics that AWS collects. CloudWatch RUM automatically measures the performance of your web pages, as experienced by real users. Why not have your experiments terminated if your application has demonstrated instability or degradation?
This can be done with a simple pipeline involving a CloudWatch alarm, metrics, and a Lambda function that will remove an experiment, thereby restoring your application’s default behavior.
By using this approach not only to automate your data collection, but also to proactively and dynamically adjust your application’s behavior, you can cut the time it takes to observe an error in production and rectify it. What once would have taken hours can now be achieved automatically in just minutes. And your development team doesn’t lose any visibility or insight into what has transpired by quickly terminating this experiment. A post-mortem analysis and error correction can be done in a safe manner, rather than ad-hoc out-of-band changes to production.
Next steps
The above scenario is drawn from our own experiences, and represents a real-world issue that our customers face every day. Amazon CloudWatch RUM and Evidently are new services that can help rapidly accelerate observability and insights into application health, but the observability story doesn’t stop there. We have a complete suite of services that provide insights into your logs, metrics, and traces, and this post only scratches the surface.
We encourage you to visit the One Observability Workshop for more examples and a deeper dive into synthetic testing, log correlation, custom metrics, advanced dashboarding, anomaly detection models, and more.