AWS Cloud Operations Blog
Announcing AWS Observability Accelerator to configure comprehensive observability for Amazon EKS
In May 2022, we announced Amazon EKS Observability Accelerator, a tool for configuring and deploying a purpose built observability solution on Amazon Elastic Kubernetes Service (Amazon EKS) clusters for specific workloads using Terraform modules. We launched this tool demonstrating four use-cases and customers have been using the tool rapidly to achieve observability. Customers can use this solution to get started with Amazon Managed Service for Prometheus, AWS Distro for OpenTelemetry (ADOT), and Amazon Managed Grafana by running a single command to start monitoring applications. We are renaming the tool to AWS Observability Accelerator to support additional orchestration platforms and features.
One of the pieces of collective feedback from our customers was to utilize AWS Observability Accelerator to solve the observability challenges of the existing environments. This includes collecting key metrics (utilization, saturation, and errors) about the applications configured on the Amazon EKS clusters, monitoring the health of the Kubernetes components such API server, etcd etc and lastly monitoring the infrastructure where the applications are hosted. Customers also asked for Prometheus Recording rules and Alerting rules to be integrated with Amazon Managed Service for Prometheus. Moreover, we wanted to provide readily available Amazon Managed Grafana dashboards to visualize the diverse set of metrics and help customers get a holistic view of their environment.
Today we’re announcing a new example within the AWS Observability Accelerator, that simplifies the observability challenges by providing a one-click solution that deploys out-of-the-box Amazon Managed Grafana dashboards, AWS Distro for OpenTelemetry collector to collect metrics, store them on Amazon Managed Service for Prometheus and configure alerts and recording rules. By implementing this solution, customers can derive insights regarding their Amazon EKS cluster components, applications, and infrastructure. This example provides customers with not only a comprehensive dashboard foundation, but also the flexibility to customize this solution to meet their specific needs.
Github repo
Download the AWS Observability Accelerator solution from the below Github repo:
https://github.com/aws-observability/terraform-aws-observability-accelerator
Solution walkthrough
We will be leveraging an existing Amazon EKS cluster, and an Amazon Managed Grafana workspace. Make sure that you specify the respective variables in the variable file described in step 3. You can use an existing Amazon Managed Service for Prometheus workspace or have the solution create one for you.
Prerequisites
Make sure that you complete the prerequisites before proceeding with this solution:
- Install Terraform
- Install Kubectl
- Install AWS Command Line Interface (AWS CLI) version 2
- Install jq
- An AWS Account
- Configure the credentials in AWS CLI
- An existing Amazon Managed Grafana Workspace
We’ll be using terraform-aws-observability-accelerator repository to deploy the solution. This repository is a collection of Terraform modules that aim to make it easier and faster for customers to configure observability for Amazon EKS clusters with AWS observability services.
Step 1: Cloning the repository
First, clone the repository:
Step 2: Generating a Grafana API Key
Before we deploy the Terraform example, we’ll log in to an existing Amazon Managed Grafana workspace and create an API key.
Follow these steps to create the key:
- Use your SAML/SSO credential to log in to the Amazon Managed Grafana workspace.
- Hover to the left-side control panel, and select the API keys tab under the gear icon.

Figure 1. Configuring API keys to programatically access Amazon Managed Grafana.
- Select Add API key, fill in the field, and select the Role as Admin.
- Fill in the Time to live field. It’s the API key life duration. For example, 1d to expire the key after one day. Supported units are: s,m,h,d,w,M,y
Next, grant admin role to the Amazon Managed Grafana API key with time to live as 1 day
- Select Add
- Copy and keep the API key safe, as we’ll use this Key in our next step

Figure 3: Copying the API key to be used by terraform module
We’ll configure the Terraform variable file to use the created API key in the next step.
Step 3: Configuring the environment
Next, we’ll configure the environment to deploy the Terraform module. Before deploying, let’s review the resources that will be created:
- AWS EKS Add-on for ADOT operator and ADOT collector with appropriate scrape configuration to ingest metrics to Amazon Managed Service for Prometheus
- kube-state-metrics to generate Prometheus format metrics based on the current state of the Kubernetes native resource
- Node_exporter to collect infrastructure metrics, such as CPU, Memory, and Disk size
- Amazon Managed Service for Prometheus workspace
- Recording and Alerting rules in the Amazon Managed Service for Prometheus Workspace
- Grafana datasource of Amazon Managed Service for Prometheus
- Observability accelerator dashboards folder within the Amazon Managed Grafana workspace (specified in the terraform variable file) that deploys 5 Grafana dashboards which displays the metrics collected by Amazon Managed Service for Prometheus
Now, that we have a good understanding of the resources being provisioned, let’s configure the variable file to specify the existing Amazon EKS cluster, and Amazon Managed Grafana workspace.
Step 4: Deploying the Terraform modules
Deploying the Terraform module involves the following steps:
- Plan(Optional): Terraform plan creates an execution plan and previews the infrastructure changes
- Apply: Terraform executes the plan’s action and modifies the environment
First, initialize the working directory using the terraform init command.
Additionally, we can execute the terraform validate command to evaluate the configuration files in a directory.
Figure 6. Validating the terraform configuration.
Next, run the terraform plan command to create an execution plan, which lets you preview the Terraform infrastructure changes.
The plan command alone won’t carry out the proposed changes. Therefore, you can use this command to check whether the proposed changes match with what you expect before applying the changes or share the changes with your team for a broader review.
Finally, run the terraform apply command to provision the resources. It takes about 10 minutes to complete. After the deployment is successful, we should be able to see the Recording rules in the Amazon Managed Service for Prometheus console and the dashboards being created in the Amazon Managed Grafana console.

Figure 8. Deploying terraform module
We can validate the successful execution of the terraform module by exploring the Amazon Managed Service for Prometheus console and click the rules management and alert manager tab. As you can see, the rules have been successfully created.
Furthermore, we can explore the dashboard section in Amazon Managed Grafana and find the dashboards created by terraform module
Next, let’s explore the Amazon EKS console under the Add-on tab to confirm the creation of the ADOT add-on. Let’s also examine the deployments in the Amazon EKS cluster. We should be able to see the components like ADOT collector, Kube-state-metrics and node-exporter successfully deployed in the cluster. This confirms the successful deployment of the Terraform module.
Step 6: Visualizing the metrics on Amazon Managed Grafana
To visualize the various metrics collected by the AWS ADOT operator, log in to the Amazon Managed Grafana workspace.
- Select Dashboards and choose Browse

Figure 12. Overview of dashboards on Amazon Managed Grafana.
- Select the “Observability Accelerator Dashboards“ folder and let us explore few dashboards :
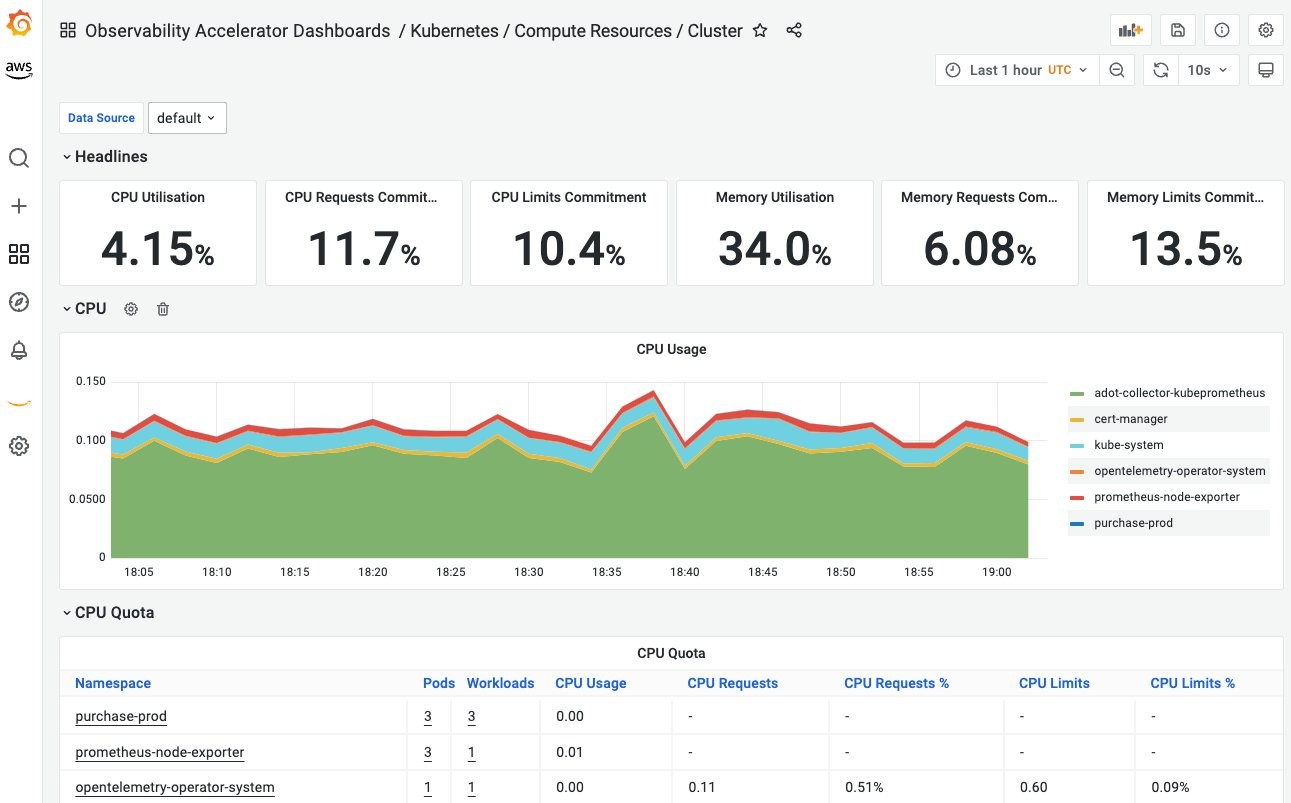
- Below dashboard shows the CPU, Memory utilizations at the Amazon EKS cluster level:

Figure 13. CPU, Memory Utilization of the Amazon EKS cluster.
-
- Below dashboard shows the utilization by the worker nodes of the Amazon EKS cluster:

Figure 14. CPU, Memory Utilizations by Worker Nodes.
-
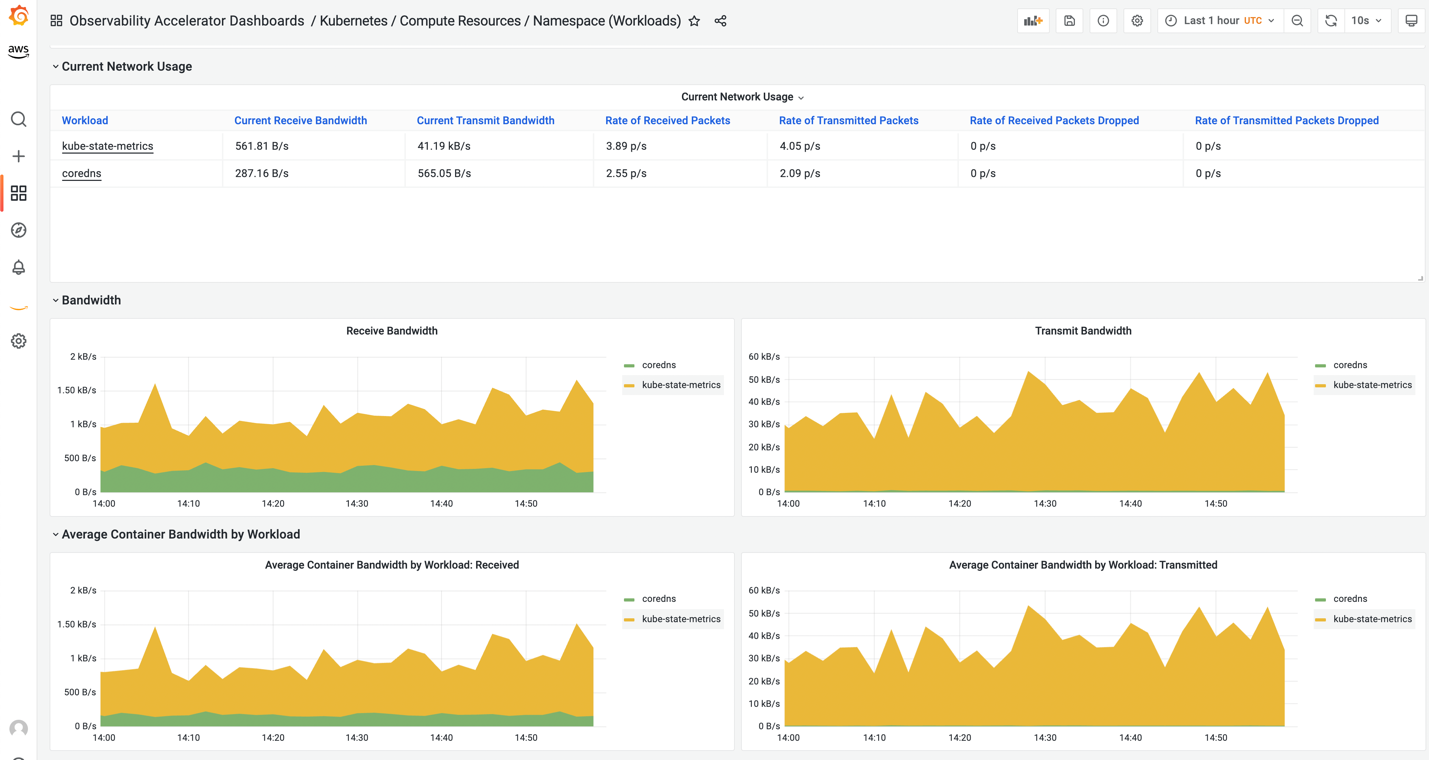
- Below dashboard shows the network utilization by namespace level configured on the Amazon EKS cluster:

Figure 15. Network Utilization by Namespace.
We can use the namespace filter to select a different namespace. For example, in a multi-tenant environment, customers can analyze the performance of the workloads running on a specific namespace.
-
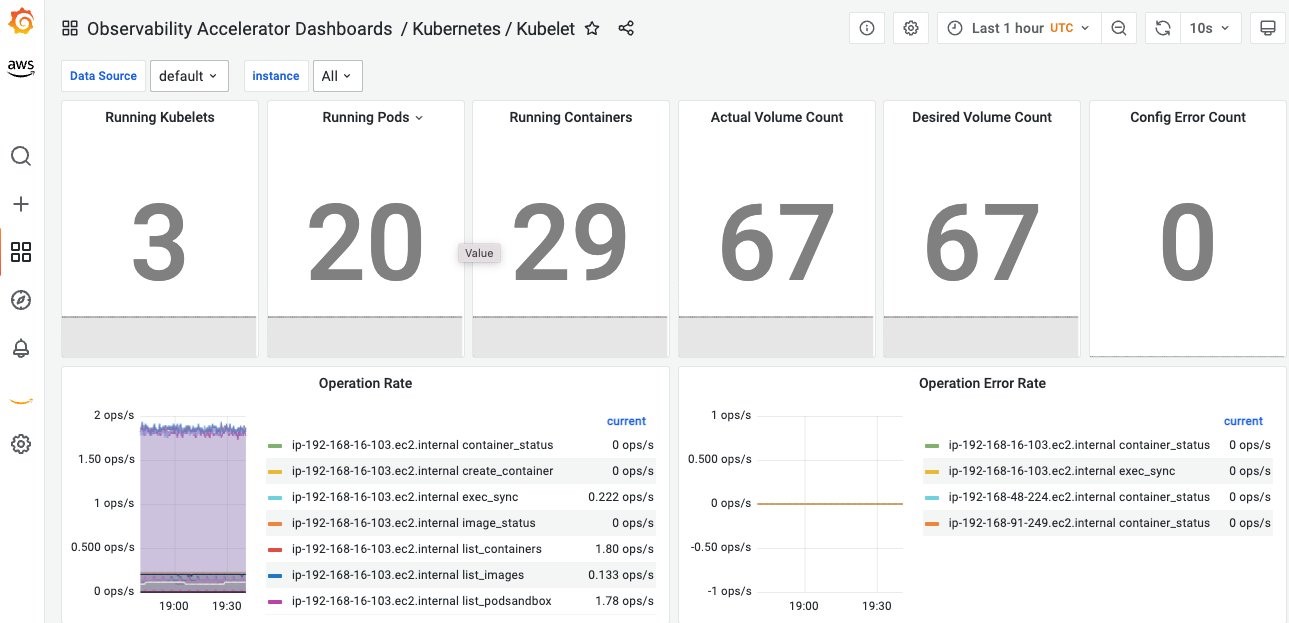
- The dashboard below shows the Kubelet information and the operations rate of the Kubelet
Cleaning up
You will continue to incur costs until you delete the infrastructure that you created for this post. Use the following commands to clean up the created AWS resources.
Conclusion
The AWS Observability Accelerator for Terraform uses a flexible set of Terraform modules customers can integrate in their Terraform configurations and customize to their needs. We will continue to add other modules to support other types of workloads. Customers can leverage the AWS Observability Accelerator modules to deploy AWS Distro for OpenTelemetry to collect metrics, store them in a secure and scalable fashion on Amazon Managed Service for Prometheus, and use Amazon Managed Grafana dashboards to achieve end-to-end Amazon EKS cluster monitoring.
Next steps
We are excited about AWS Observability Accelerator and would love to get your feedback. We have more features in our roadmap like the full automation of Amazon Managed Grafana’s API key which is a current limitation. We also plan to support of other orchestration platforms like Amazon ECS. Visit the issues section of our Github repository for all the upcoming features. You can also contribute by submitting bugs, new features or even contributions pull-requests!
About the authors:


