AWS Cloud Operations Blog
Create metrics and alarms for specific web pages with Amazon CloudWatch RUM
Amazon CloudWatch RUM makes it easy for AWS customers to access real-world performance metrics from web applications, thereby giving insights into the end-user experience. These user experiences are quantified into discrete metrics that you can then create alarms for. But what if you must have different load time alarms for certain pages? Or you’re testing a specific component of your application with a specific web browser? How can CloudWatch RUM be used to instrument a single web page or dimension differently from the rest of your application?
The telemetry data from CloudWatch RUM can be delivered to Amazon CloudWatch Logs, and from there we can extract datapoints that are important for your application. A classic example is a payment page on an ecommerce site. Although you may have a target page load time of less than two seconds for most parts of your application, it can typically take much longer than this to process a payment card transaction. What if you must have a CloudWatch alarm that triggers only when payment page loads take longer than 10 seconds?
In our approach, application telemetry comes from real web browsers and is received by CloudWatch RUM, where it is analyzed, indexed, parsed, and the data then optionally delivered to a CloudWatch Logs log group. By using a combination of CloudWatch RUM, CloudWatch Logs, and CloudWatch metric filters, we can achieve exactly this goal of alerting us when our application performance is abnormal and our business outcomes at risk. The flow of data in my example is visualized in figure one.
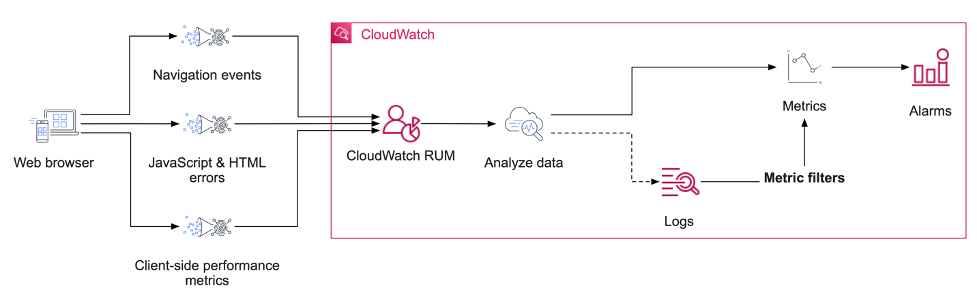
Figure 1: An architectural diagram of services used in this solution.
Exporting data from CloudWatch RUM to CloudWatch Logs
To perform your own granular data inspection, alarms, and metrics based on arbitrary parts of your web application, you must enable the storing of your CloudWatch RUM data in CloudWatch Logs. This can be done when creating your application monitor with the data storage option, or afterward by editing the application configuration in your console.
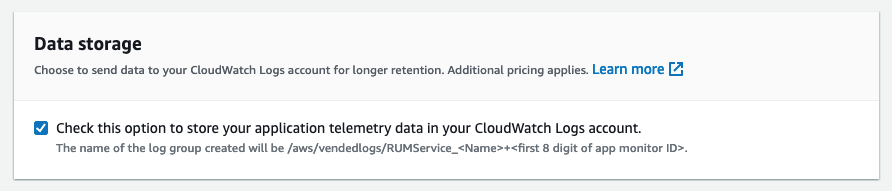
Figure 2: The data storage option enables the storage of CloudWatch telemetry directly into CloudWatch Logs.
With the logging to CloudWatch Logs now enabled, you will see a new log group that has /aws/vendedlogs/RUMService prefixed to it.
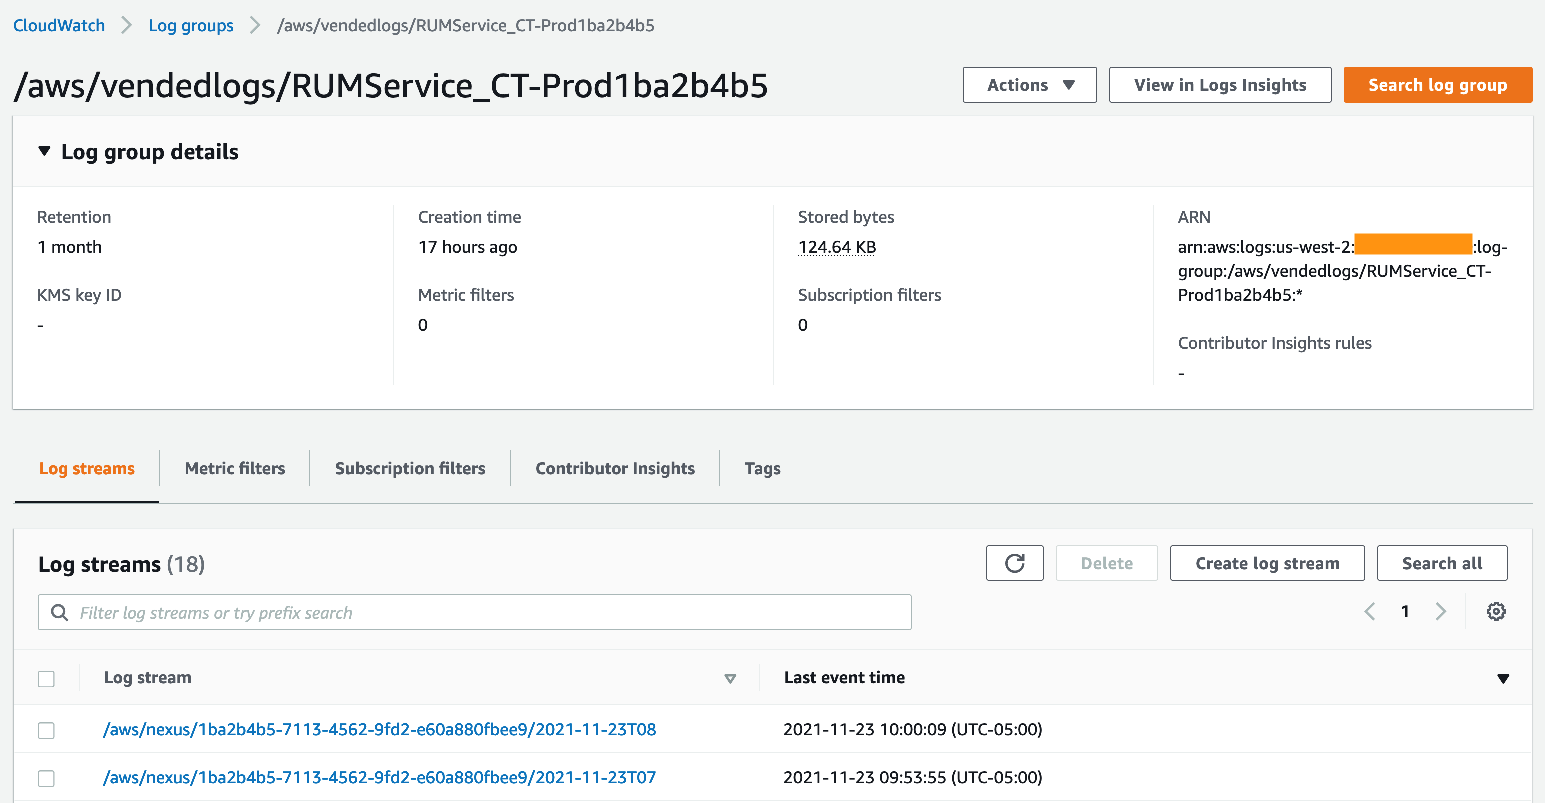
Figure 3: Logs from CloudWatch RUM now appear as a log group.
Examining a single event from a stream will show a great deal of telemetry that has been emitted by the web client. Here, we see an example of a performance event:
There is a lot of data to unpack here from this one event, and there are many other event types that we can discuss. However, for the moment, let’s focus on this being an event that tracks the time to fetch a specific resource. I will focus on the highlight.pack.js resource for this example. In this specific instance, the resource required 72 ms to be retrieved by the web browser.
Using Amazon CloudWatch Logs Insights, we can search for all occurrences of highlight.pack.js being retrieved. This is a good step to perform before creating a metric filter, thereby making sure that our data is present and displayed as expected. Our query is as follows:
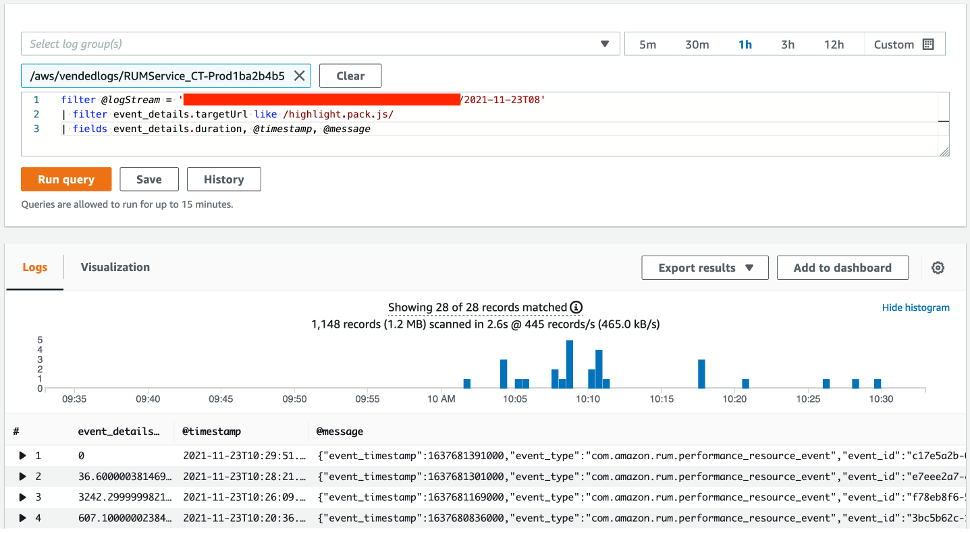
Figure 4: Searching through CloudWatch Logs Insights is performed often through the AWS console.
In this example, you will see that one of the events has a duration of zero milliseconds. This was a cache hit from the local browser and is normal behavior.
Creating metric filters from CloudWatch RUM
Metric filters are a powerful feature of CloudWatch Logs that can count pattern matches in CloudWatch log streams, and even extract values from these logs. Each log entry for the com.amazon.rum.performance_resource_event type can be converted into a metric using a metric filter, and then you can create alarms and even anomaly detection models based on this data.
In our example, we will create a new metric filter specifically for the highlight.pack.js resource, and maintain a metric with the load time of non-zero (i.e., not cached) duration. To this we:
- Visit the log group in the CloudWatch Logs console
- Then, select the vended log group (which starts with
/aws/vendedlogs/RUMService_) - Select Metric filters
- Finally, select Create metric filter
Our next step is to create the filter pattern. The metric filter query syntax is different from CloudWatch Logs Insights, though still easily accessible. For this resource, we will use this specific query:
Now, select the Select log data to test drop-down and choose a log stream. Then, select Test pattern. If you have data that matches, then it will appear in the following Results window.
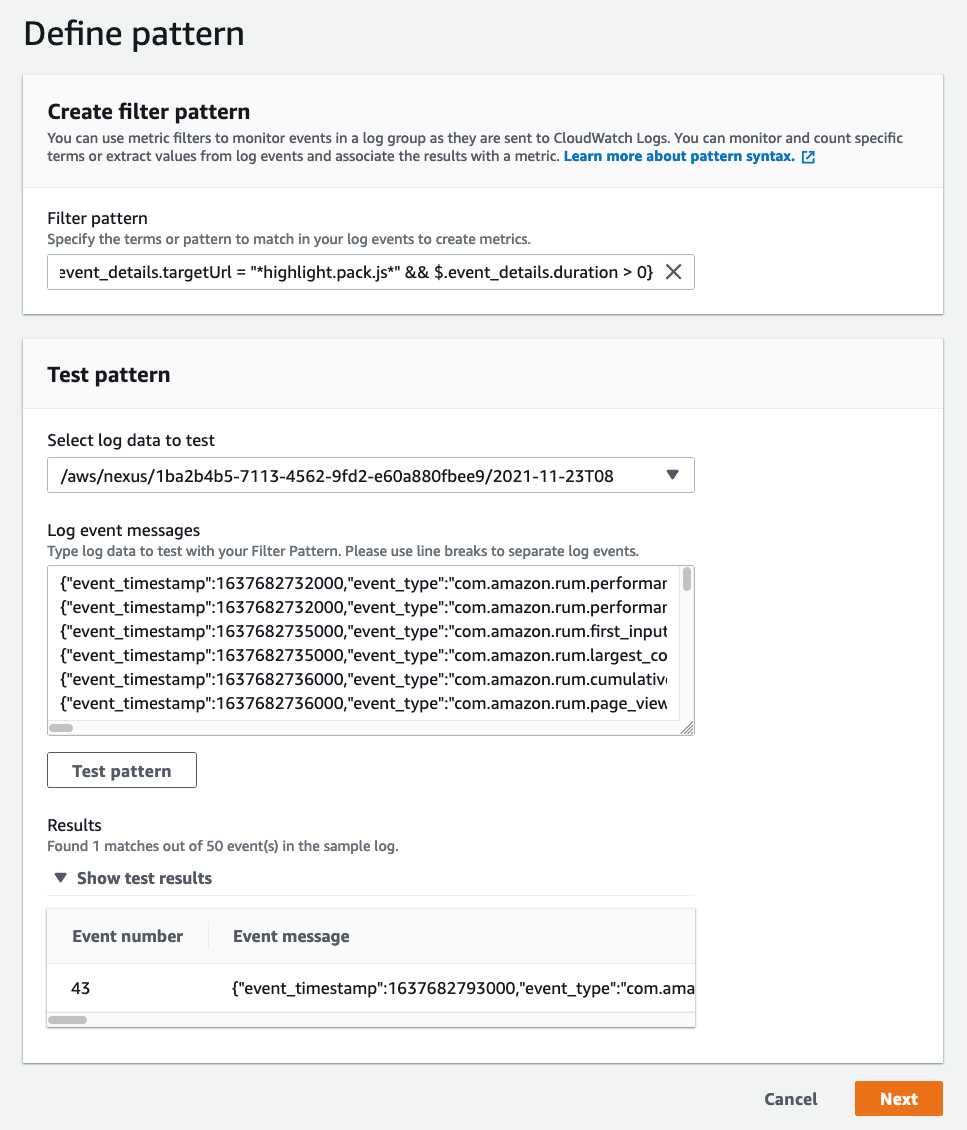
Figure 5: This is an example of the metric filter creation process from the CloudWatch console.
Select Next to proceed to the next step. Now, give the metric filter a name, assign it to a namespace (or create a new one), and name the metric itself (in our example we use highlight.pack.js duration). The Metric_value follows the same JSON matching syntax as the previous step. In this case, it will be $.event_details.duration. Change the Unit to Milliseconds, and then select Next.
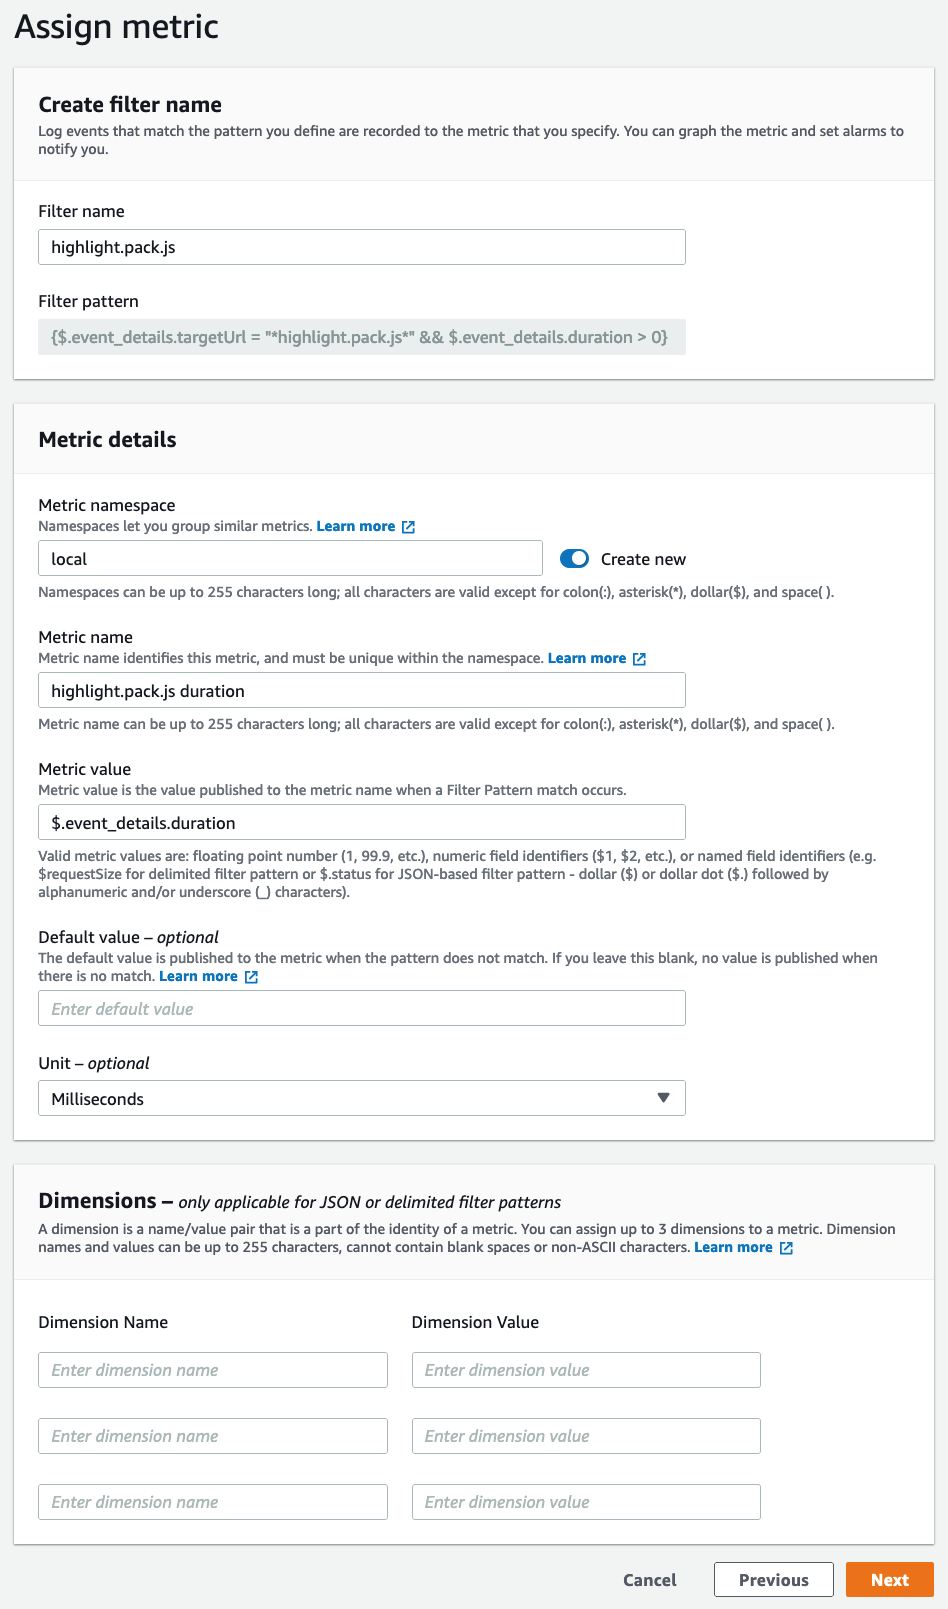
Figure 6: The second step of the metric filter creation process.
On the final page, select Create metric filter. Note that this process can also be performed using the AWS CLI or AWS CloudFormation.
After a few minutes, your metric filter will create your new metric, and now you can view the results of the end-user load time for the highlight.pack.js resource!
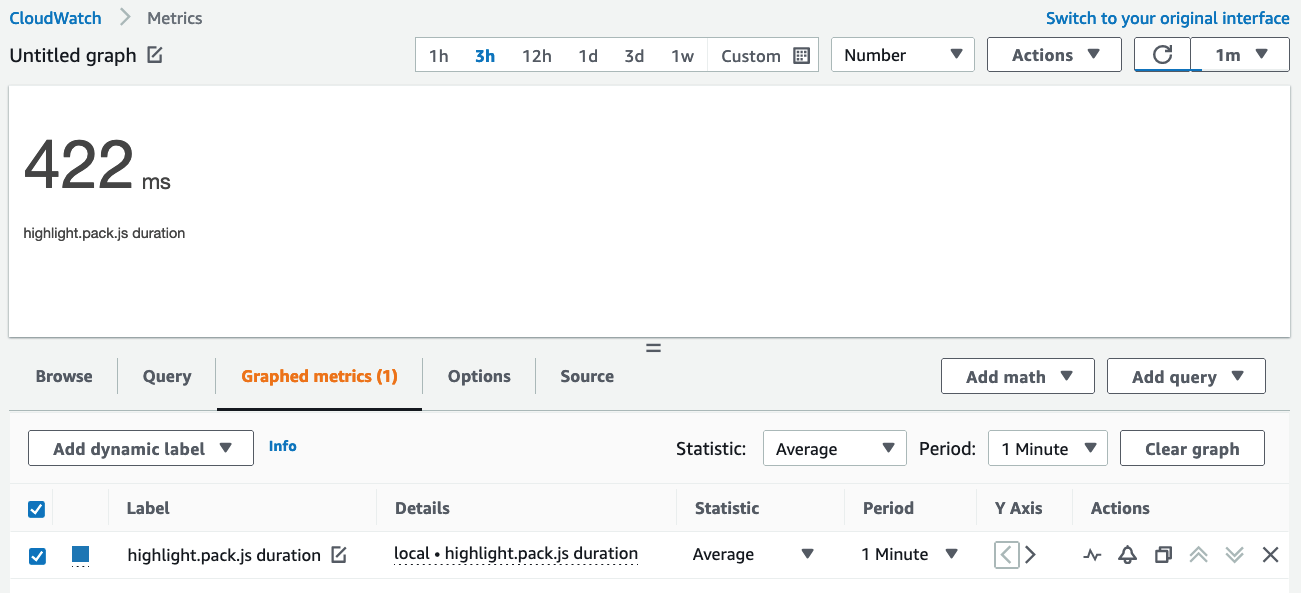
Figure 7: The metrics for our resource load time are now available.
Creating alarms
Now that we have created a metric that reflects the load time for this particular resource, we can use CloudWatch alarms to alert us when the average response time exceeds a reasonable threshold.
You can even filter your data with more granularity if you wish, and target specific browser or device types. A good example is different alarm thresholds for mobile devices, as they may be on networks of varying speeds. Country and subdivision (e.g., US, and Washington State) are also available, and you may wish to target traffic from two regions for a comparative analysis.
For our newly-created metric, we can create an alarm by first selecting the alarm icon in the metrics view:
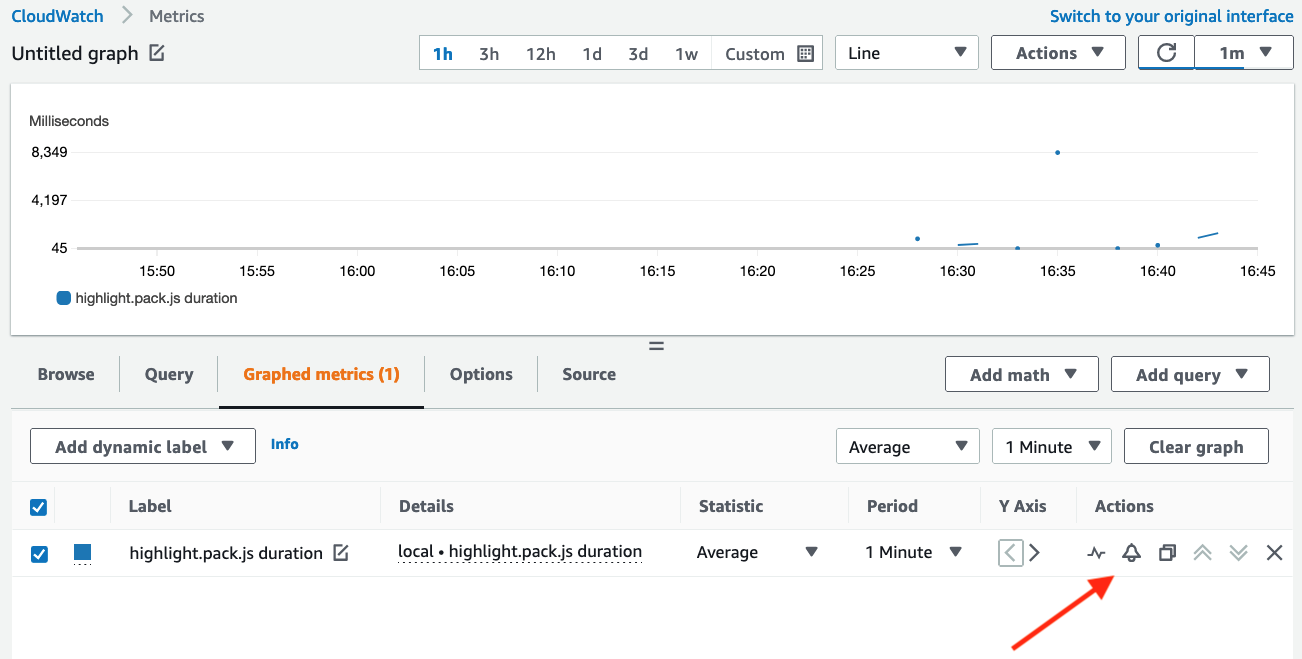
Figure 8: Create alarms by clicking on the alarm icon.
Now you can create your alarm with a threshold value that makes sense for your workload, and even use an anomaly detection model to learn your normal application behavior. This removes the need for you to know these thresholds in advance!
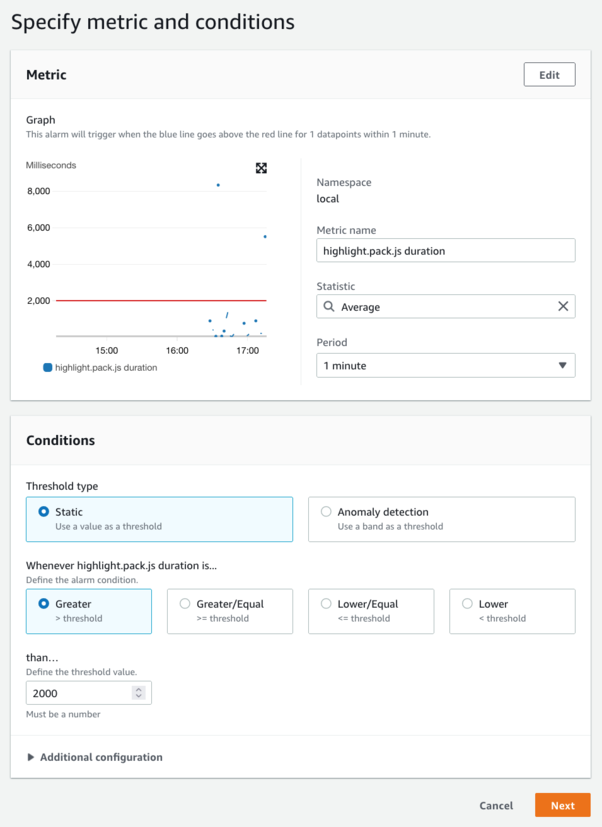
Figure 9: Create an alarm based on load time.
Conclusion
CloudWatch RUM creates a powerful new mechanism to measure the quality of your web applications as they are experienced by users in the real world. When combined with CloudWatch Logs, metric filters, and alarms, you have almost unlimited possibilities for observing and alerting on actual user experience with a new degree of granularity. What we described here only scratches the surface of what you can gain visibility into and build.
Additional resources
You can find additional information about CloudWatch RUM through our official documentation, our launch announcement, and by example through the One Observability Workshop.