AWS Cloud Operations Blog
Gain actionable business insights with monitoring of Amazon MSK with Amazon Managed Service for Prometheus and Amazon Managed Grafana
Introduction
Monitoring is a critical aspect of maintaining the health and performance of any distributed system. In the case of Apache Kafka-based applications, configuring robust monitoring on kafka clusters becomes more crucial due to the real-time nature of data processing. This blog is intended for individuals or organizations utilizing Apache Kafka-based applications, specifically those facing the challenge of configuring robust monitoring on their Kafka clusters. The blog offers solutions for gaining operational insights into the performance of Amazon MSK cluster, proactive issue detection, enhanced troubleshooting capabilities, and effective capacity planning and forecasting. By exploring an integrated solution that combines Amazon Managed Streaming for Apache Kafka, Amazon Managed Service for Prometheus, and Amazon Managed Grafana, you will discover how to streamline monitoring process and gain actionable business insights.
In this blog post, we will walk you through the steps to leverage Amazon Managed Service for Prometheus and Amazon Managed Grafana with Amazon MSK open monitoring, providing comprehensive insights into the performance and health of your Kafka clusters.
Solution Overview
The architecture diagram in Figure 1 below shows an Apache Kafka MSK cluster and an Amazon EC2 Instance running the Prometheus Server. We will scrape the metrics exposed by Amazon MSK through Open Monitoring, ingest metrics to Amazon Managed Service for Prometheus Workspace and visualize using a custom dashboard on Amazon Managed Grafana to monitor the health and performance of the cluster. When creating an Amazon MSK cluster, you should specify how many broker nodes you want Amazon MSK to create in each Availability Zone. A broker instance is a worker node that helps to manage the Kafka cluster. Amazon MSK also creates the Apache ZooKeeper nodes for you. Apache ZooKeeper is an open-source server that enables highly reliable, distributed coordination.
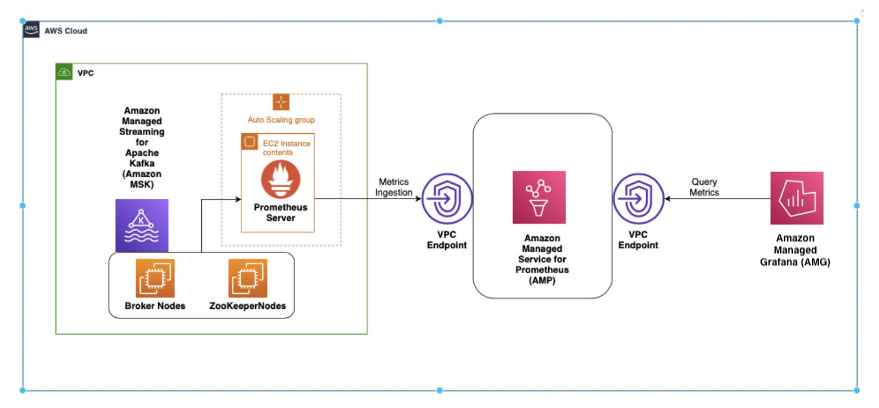
Figure 1: Solution with broker and zookeeper nodes that send the JMX and node metrics
Figure 1 displays how metrics are scraped by a Prometheus server inside the EC2 instance and ingested to Amazon Managed Service for Prometheus through Amazon Virtual Private Cloud (VPC) endpoint. Then, Grafana monitors the metrics from Prometheus. The solution we will build in this blog post combines the capabilities of Amazon MSK, Amazon Managed Service for Prometheus, and Amazon Managed Grafana to enable open monitoring for Amazon MSK clusters. By following the steps outlined below, you will be able to set up a comprehensive monitoring system for your Kafka-based applications:
- Create an Amazon MSK cluster
- Create an Amazon Managed Service for Prometheus workspace
- Set up a Prometheus host on an Amazon EC2 instance
- Monitoring and Analysis
Prerequisites
Before diving into the setup, ensure you have the following prerequisites in place:
- An AWS account
- AWS CLI version 2
- An existing Amazon Managed Grafana Workspace
Create an Amazon MSK cluster
Provision an Amazon MSK cluster, which serves as the backbone of our Kafka-based system. This fully managed service ensures high availability, scalability, and security for your Kafka workloads. Use the following commands to create MSK cluster.
export AWS_REGION=us-east-2
export MSK_CLUSTER="MSKCluster"
export id1=$(aws ec2 describe-subnets --query 'Subnets[0].SubnetId' --output text)
export id2=$(aws ec2 describe-subnets --query 'Subnets[0].SubnetId' --output text)
export id3=$(aws ec2 describe-subnets --query 'Subnets[0].SubnetId' --output text
Start with creating Amazon MSK cluster, using the command:
Create json file for broker Node group configuration
jq -nc --arg id1 "$id1" --arg id2 "$id2" --arg id3 "$id3" '{InstanceType: "kafka.m5.xlarge", BrokerAZDistribution: "DEFAULT", ClientSubnets: [$id1 , $id2 , $id3] }' | jq . > brokernodegroupinfo.jsonCreate Kafka Cluster using the below command:
aws kafka create-cluster --cluster-name $MSK_CLUSTER --kafka-version 2.8.1 --number-of-broker-nodes 3 --broker-node-group-info file://brokernodegroupinfo.jsonGet ARN and Wait for the cluster to be active:
export MSK_ARN=$(aws kafka list-clusters --cluster-name-filter $MSK_CLUSTER --query "ClusterInfoList[].ClusterArn" --output text --region $AWS_REGION)

while true; do
STATUS=$(aws kafka describe-cluster --cluster-arn $MSK_ARN)
   if [[ "${STATUS}" == "ACTIVE" ]]; then break; fi
   sleep 1
   echo -n '.'
 done
The cluster will take a few minutes to create and will be created in the default virtual private cloud (VPC), with the default VPC security group.
After the cluster creation is complete, navigate to the Properties section under the details tab as shown in Figure 2 below.
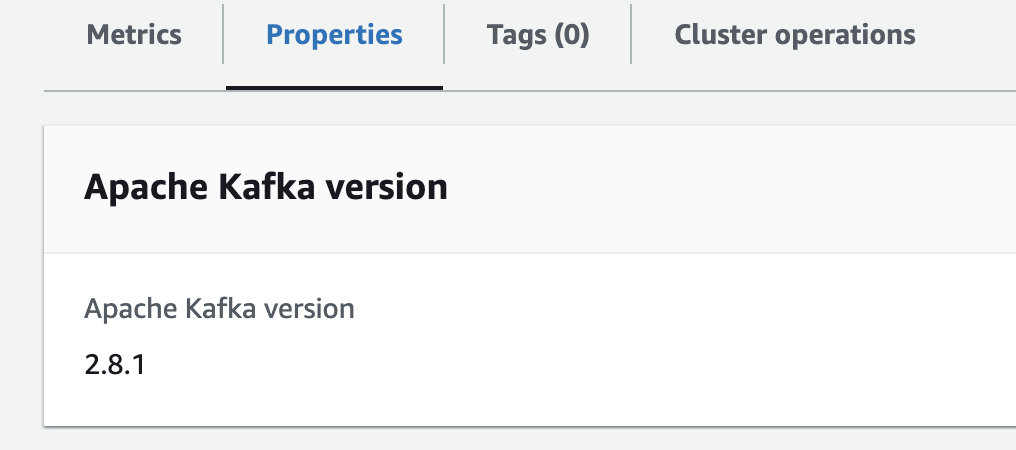
Figure 2: Properties section in MSK details tab
Next, go to Monitoring metrics section, and edit the Monitoring section as shown in Figure 3 below.
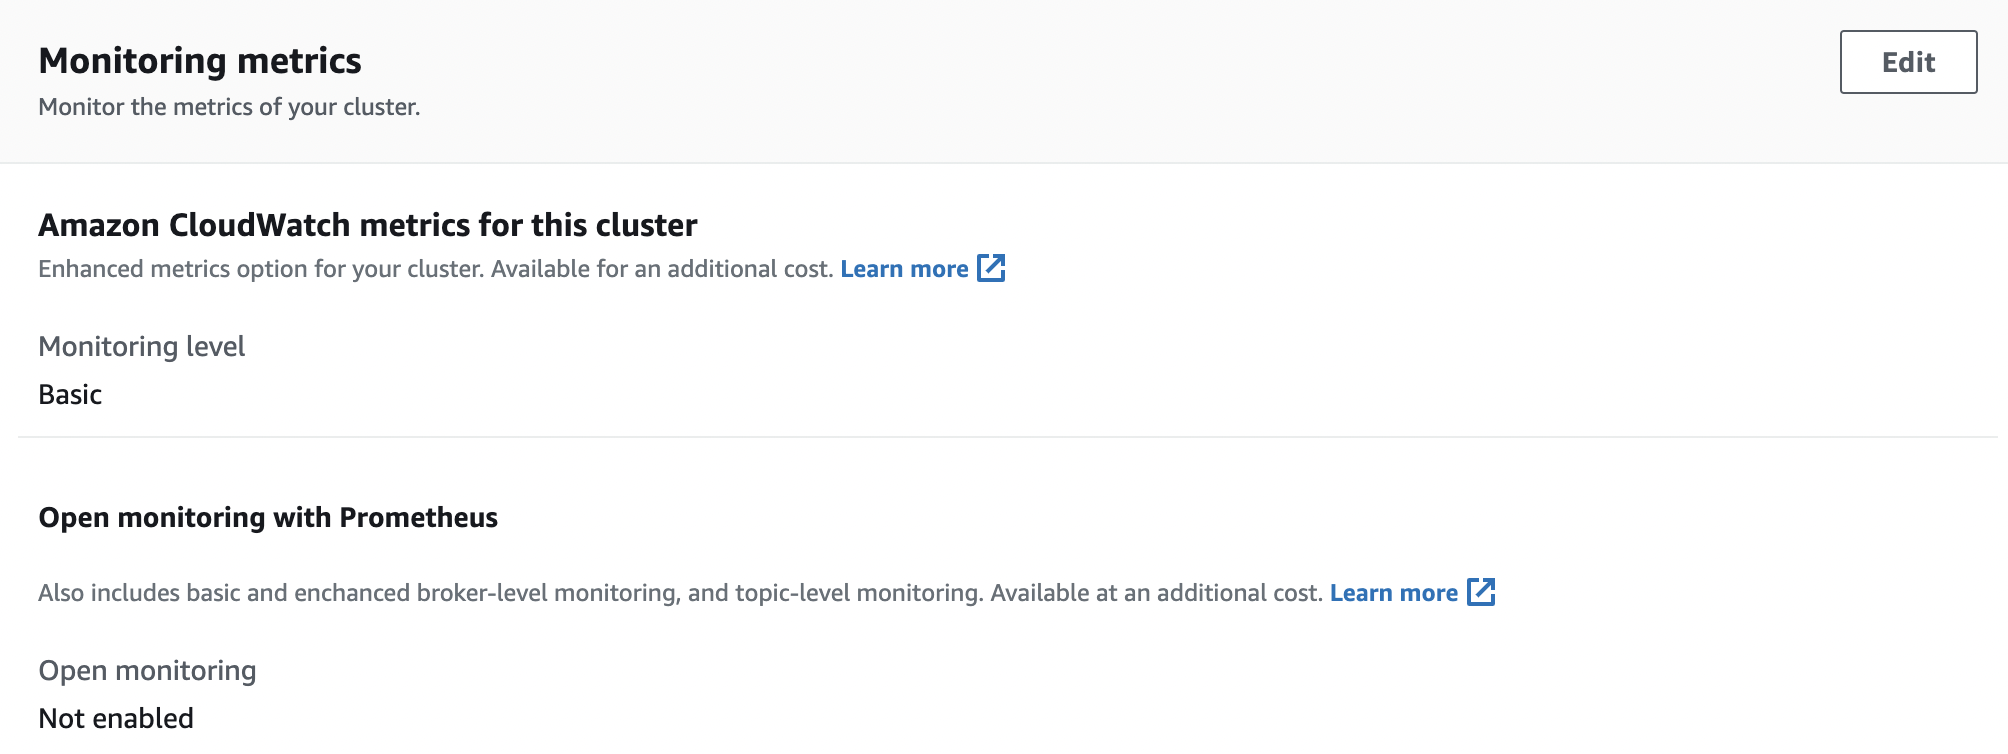
Figure 3: Monitoring metrics section
Once in the edit section, select “Enable open monitoring with Prometheus” checkbox and keep the defaults and then click on “Save changes” as shown in Figure 4 below. Enabling “Open monitoring with Prometheus” will run JMX exporter (to expose Apache Kafka JMX metrics) and Node Exporter (to expose CPU and Disk Metrics) on the broker nodes.
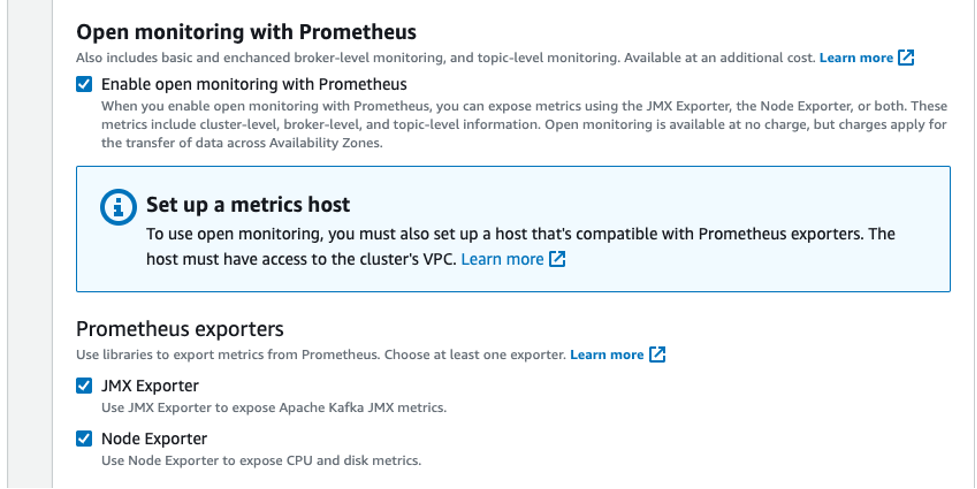
Figure 4: Enable Open Monitoring with Prometheus
Create an Amazon Managed Service for Prometheus workspace
Next, we create an Amazon Managed Service for Prometheus workspace, which serves as the Centralized Monitoring Service for storing and analyzing the collected metrics. Use the following commands to create the Prometheus workspace.
aws amp create-workspace –alias $AMP_ALIAS –region $AWS_REGIONStore the Prometheus workspace ID.
export AMP_WORKSPACE_ID=$(aws amp list-workspaces –query “workspaces[].workspaceId” –output text)Next, as an optional step, create an interface VPC endpoint to securely access the managed service from resources deployed in your VPC. A public endpoint for Amazon Managed Service for Prometheus is also available. Using the VPC endpoint ensures that traffic between the EC2 instance and the Amazon Managed Service for Prometheus workspace does not leave the VPC in your AWS account. Follow the AWS CLI commands below to set this up.
Export the environment variables as below, including VPC ID, Security Groups ID and Subnet IDs:
export AMP_ALIAS=”MSK-AMP”
export PROMETHEUS_HOST=PrometheusEC2Host
export VPC_ID=$(aws ec2 describe-vpcs –filter “Name=isDefault,Values=true” –query  “Vpcs[].VpcId” –output text –region $AWS_REGION)
export SECURITY_GROUP_IDS=$(aws ec2 describe-security-groups –filter “Name=vpc-id,Values=$VPC_ID” “Name=group-name,Values=default”  --query ‘SecurityGroups[*].[GroupId]’ –output text)
export SUBNET_IDS=$(aws ec2 describe-subnets –filter “Name=vpc-id,Values=$VPC_ID” –query ‘Subnets[].SubnetId’ –output text)
Create the VPC endpoint using the below command:
aws ec2 create-vpc-endpoint –service-name com.amazonaws.$AWS_REGION.aps-workspaces –vpc-id $VPC_ID –vpc-endpoint-type InterfaceSet up a Prometheus host on an Amazon EC2 instance
In this section, we will deploy a Prometheus host on an Amazon EC2 instance to collect metrics from the MSK brokers and forward them to the Prometheus workspace. By enabling Open Monitoring with Prometheus, we can collect and scrape detailed metrics from the Amazon MSK cluster. This feature leverages JMX exporter and Node Exporter to expose a rich set of metrics, including Kafka-specific metrics, CPU utilization, and disk metrics. Below, we are using the AWS CloudFormation template from the msk-open-monitoring repository to create Prometheus host on EC2 instance and extract the downloaded file to a directory and go to that directory. We are using AWS CLI as shown here.
Get the Amazon MSK ARN as below:
export MSK_ARN=$(aws kafka list-clusters –cluster-name-filter $MSK_CLUSTER –query “ClusterInfoList[].ClusterArn” –output text –region $AWS_REGION)Get Amazon Managed Service for Prometheus workspace ID:
export AMP_WORKSPACE_ID=$(aws amp list-workspaces –alias $AMP_ALIAS –query “workspaces[].workspaceId” –output text –region $AWS_REGION)Export the environment variables including VPC and SubnetIds as below:
export VPC_ID=$(aws ec2 describe-vpcs –filter “Name=isDefault,Values=true” –query “Vpcs[].VpcId” –output text –region $AWS_REGION)
export SUBNET_IDS=$(aws ec2 describe-subnets –filter “Name=vpc-id,Values=$VPC_ID” –query “Subnets[].SubnetId” –output text –region $AWS_REGION) export TEMP_SUBNET_LIST=$(echo $SUBNET_IDS | tr “\t” “,”)
export SUBNET_LIST=$(sed ‘s/,/\\,/g’ $TEMP_SUBNET_LIST )
Since we set the variables required, lets run CFN:
git clone https://github.com/aws-samples/msk-open-monitoring.git
cd msk-open-monitoring
aws cloudformation create-stack –stack-name $PROMETHEUS_HOST –template-body file://prometheus-setup-cft.yaml –capabilities CAPABILITY_NAMED_IAM –parameters ParameterKey=Subnets,ParameterValue=$SUBNET_LIST ParameterKey=AMPWorkspaceId,ParameterValue=$AMP_WORKSPACE_ID ParameterKey=AmazonMSKClusterArn,ParameterValue=$MSK_ARN
It will take some time for the CFN to complete
while true; do
 STATUS=$(aws cloudformation describe-stacks –stack-name $PROMETHEUS_HOST –query ‘Stacks[].StackStatus’ –output text)
 if [[ “${STATUS}” == “CREATE_COMPLETE” ]]; then break;
 sleep 1
 echo -n ‘.’
done
We have now created a Prometheus host on EC2 instance, and will scrape metrics from MSK brokers that we created earlier and ingest metrics to the Amazon Managed Service for Prometheus workspace.
Monitoring and analysis
To set up visualization and analysis, create Amazon Managed Grafana workspace by following the instructions here . Now, we need to add the Amazon Managed Service for Prometheus workspace as the data source in Grafana. Click on the Datasource and choose Prometheus (Amazon Managed Service for Prometheus) data source as shown in Figure 5 below. Then you can choose the region where your Amazon Managed Service for Prometheus is running and it should display the message “Data source is working”.
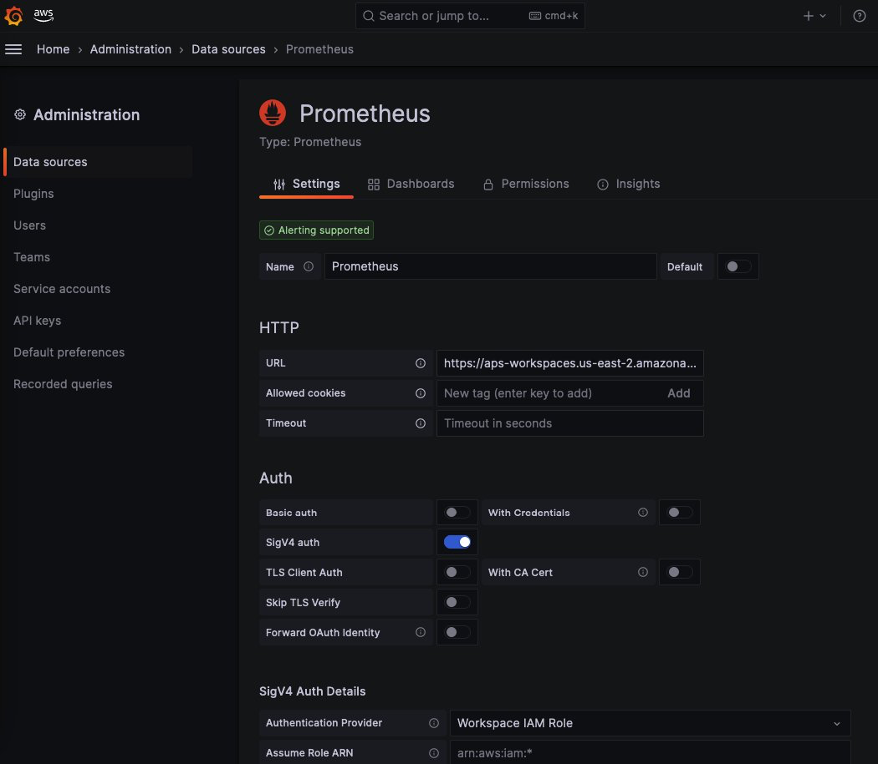
Figure 5: Adding Amazon Managed Service for Prometheus Workspace as data source in Grafana
The kafka dashboard is available as part of your Git clone. Click on the Dashboards link and create new dashboard by clicking Import option from the drop down. Then you could upload the MSK Grafana Dashboard json you got from Github and upload as shown in Figure 6 below.
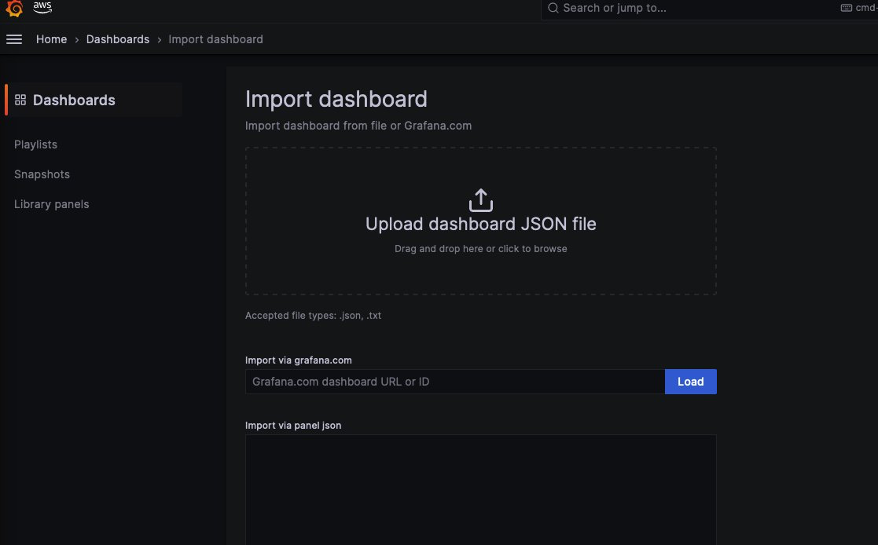
Figure 6: Importing Pre-built Kafka dashboard into Grafana
- Import pre-built Kafka dashboard to get a quick overview of your Amazon MSK cluster. Ensure the name of the datasource to be Prometheus
- Dashboard as shown in Figure 7 below provides a set of panels that display essential metrics and insights.
- Customize and expand upon this dashboard to suit your specific monitoring needs.
- You can monitor the real-time metrics of your Amazon MSK cluster. This includes monitoring topics, partitions, consumer lag, broker health network throughput, and more.
- By leveraging the visualization capabilities of Grafana, you gain deep insights into the performance and behavior of your Kafka-based applications.
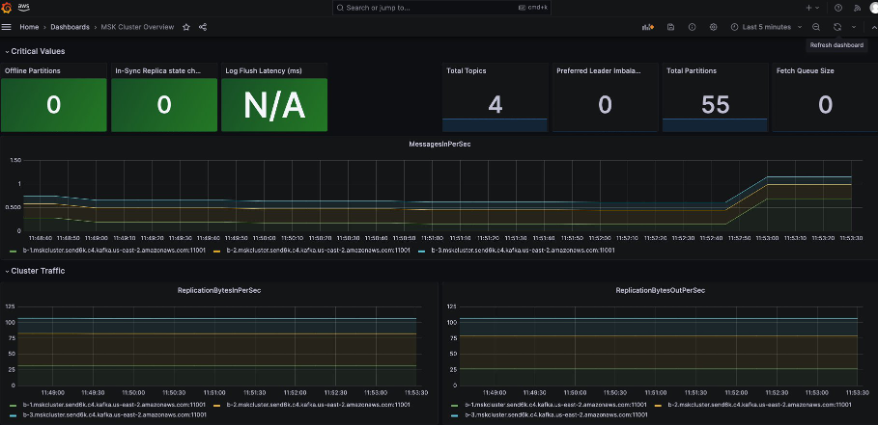
Figure 7: MSK Customer overview dashboard in Grafana portal
Note (optional step): If you need to monitor the node metrics, you can do so by using the Node exporter dashboard as shown in Figure 6 below. You can import this dashboard by using 1860 as the Dashboard ID into Amazon Managed Grafana. Once complete, this will be would be similar to as presented in Figure 8 below.
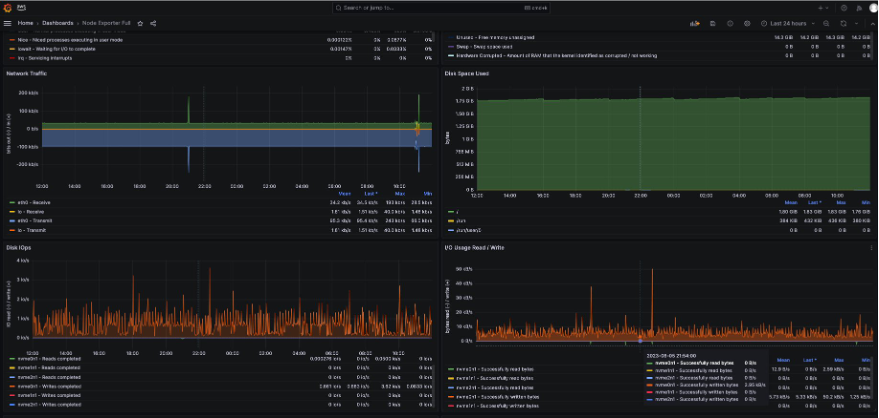
Figure 8: Node Exporter dashboard in Grafana
Clean up
In this step, we clean up by deleting the Amazon Managed Service for Prometheus workspace, Prometheus EC2 host, Amazon Managed Grafana workspace, and the Amazon MSK cluster.
aws grafana delete-workspace --workspace-id $WORKSPACE_ID
aws iam detach-role-policy --role-name AMG-role --policy-arn arn:aws:iam::aws:policy/AmazonPrometheusFullAccess
aws iam delete-role --role-name AMG-role
aws cloudformation delete-stack --stack-name $PROMETHEUS_HOST
aws amp delete-workspace  --workspace-id $AMP_WORKSPACE_ID
aws kafka delete-cluster --cluster-arn $MSK_ARN
Conclusion
In this blog post, we explained the process to enable open monitoring for Amazon MSK using Amazon Managed Prometheus and Amazon Managed Grafana. With Prometheus, you can scrape JMX metrics from your Amazon MSK cluster, giving you more granular visibility into the internal operations of Kafka.
This helps you identify potential bottlenecks, optimize resource utilization, and fine-tune the configuration of your cluster. Amazon Managed Service for Prometheus automatically scales the ingestion, storage, and querying of metrics as your workloads scale up and down.
This ensures that you have a robust and scalable monitoring solution without the need for manual intervention. In conclusion, this blog post provides a step-by-step guide to enable open monitoring for Amazon MSK using Amazon Managed Service for Prometheus and Amazon Managed Grafana.
To learn more about Observability in AWS, explore the “One Observability Workshop” for a hands-on experience.