AWS Cloud Operations Blog
Get visibility into application health with Amazon CloudWatch Application Insights for .NET and SQL Server
To provide a reliable service to your customers, you need to make sure that your business-critical applications are healthy. If you have ever been involved in the monitoring process, you’re probably already aware of its complexity. You need to identify and configure the right set of monitors for various parts of your application and infrastructure, and set up appropriate thresholds to determine potential problems. You visualize, analyze, and correlate relevant pieces of information to get to the root cause and fix the problem, before it affects your end users.
As a Windows DevOps engineer, you are also required to build additional expertise into effectively monitoring are important parts of your technology stack, such as Microsoft IIS Server and SQL Server. For example, think of a situation where you get informed of an issue related to your application crashing and blocking critical tasks. To figure out what’s happening, you look at your dashboards to see if any of the metrics that you are monitoring are at an alarming state. You notice that there are 4XX and 5XX errors on your frontend Application Load Balancer and high empty responses in your SQS queues.
With that incomplete information, you try to get the root cause by sifting through your IIS, application, and SQL Server logs, only to realize that your database wasn’t backing up. While tackling this issue, you conclude that this process makes detecting application problems and keeping applications healthy laborious and time-consuming. Sound familiar?
Amazon CloudWatch Application Insights for .NET and SQL Server
To make monitoring and troubleshooting process easy while offering visibility into your application health, AWS has launched Amazon CloudWatch Application Insights for .NET and SQL Server, enabling you to set up, monitor, and analyze the metrics, logs and alarms for your .NET applications and underlying resources to detect problems. It is designed to provide an easy getting started experience. It recognizes and sets up important monitors, intelligently detects application problems using Amazon SageMaker, and creates Amazon CloudWatch automated dashboards for detected problems, summarizing the problem details, including problem severity, source, related alarms, and log errors.
The insights provided help you isolate the ongoing issue faster and reduce the mean time to resolution. For detected problems, you can take remedial actions, add your feedback for the analysis that would in turn improve the feature’s future findings, or choose to debug further.
Detecting and troubleshooting application problems
Using the previous example, we will explore the detection and troubleshooting process using Amazon CloudWatch Application Insights for .NET and SQL Server. By default, it generates Amazon CloudWatch Events when it detects a problem, so that you can be notified.
To view more details about the detected problem, you go to the CloudWatch console to view the list of alarms that are dynamically set and updated by Amazon CloudWatch Application Insights. An example dashboard is shown in the following screenshot.
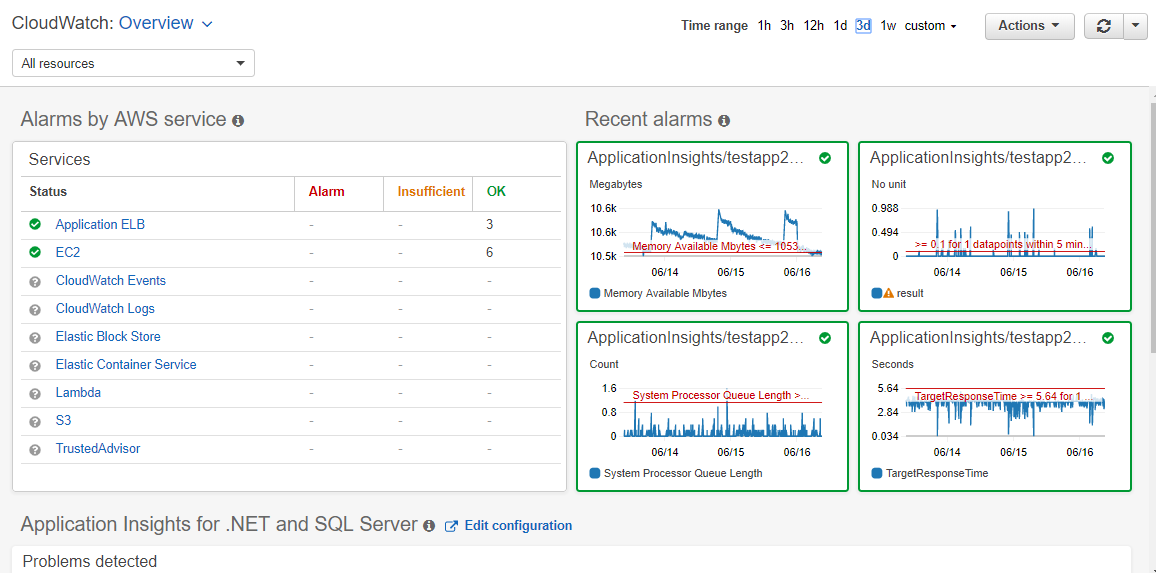
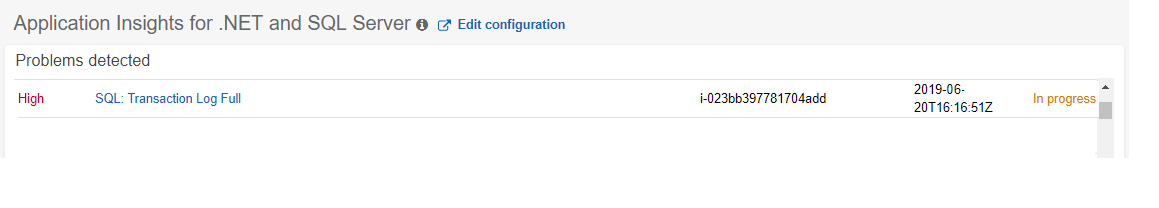
Under the Application Insights for .NET and SQL Server section, you see that the problem with the application is due to the SQL Server transaction log being full.
 To view more details, you select the problem description. An automated dashboard contextualizes the problem, as shown in the following screenshot.
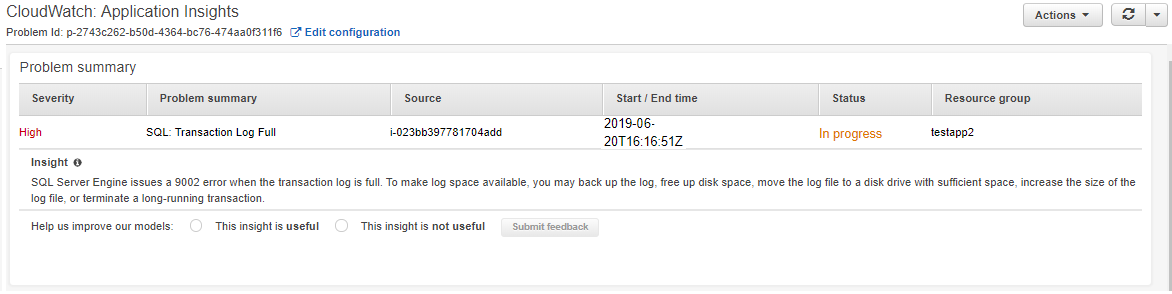
Amazon CloudWatch Application Insights for .NET and SQL Server provides a summary of what’s really happening with the application. You get an overview of the type of problem, severity, probable source of the problem, and additional insights with potential next steps.
It also analyzes and groups together all the individual metric alarms, such as 4XX and 5XX errors on the web frontend. It pulls up log errors from the IIS and SQL Server error logs in the dashboard, so that you don’t have to deal with individual errors or correlate them to get to a conclusion and resolution. The following screenshot shows an example correlation.
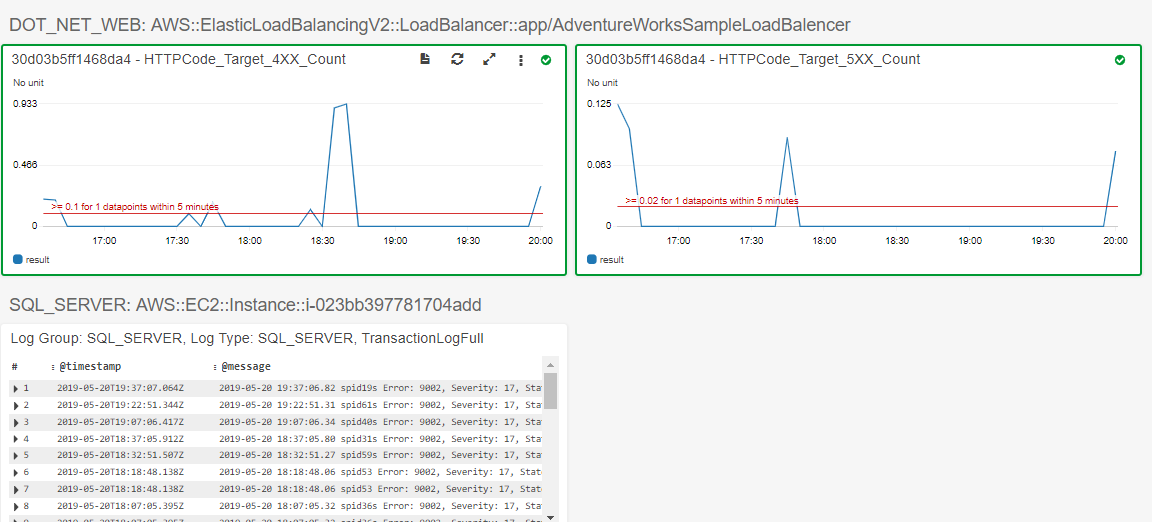
In this example, the SQL Server transaction log was full due to a missing or broken back up. To remediate this issue, you run a SQL Server backup using AWS Systems Manager Automation.
Onboarding your application
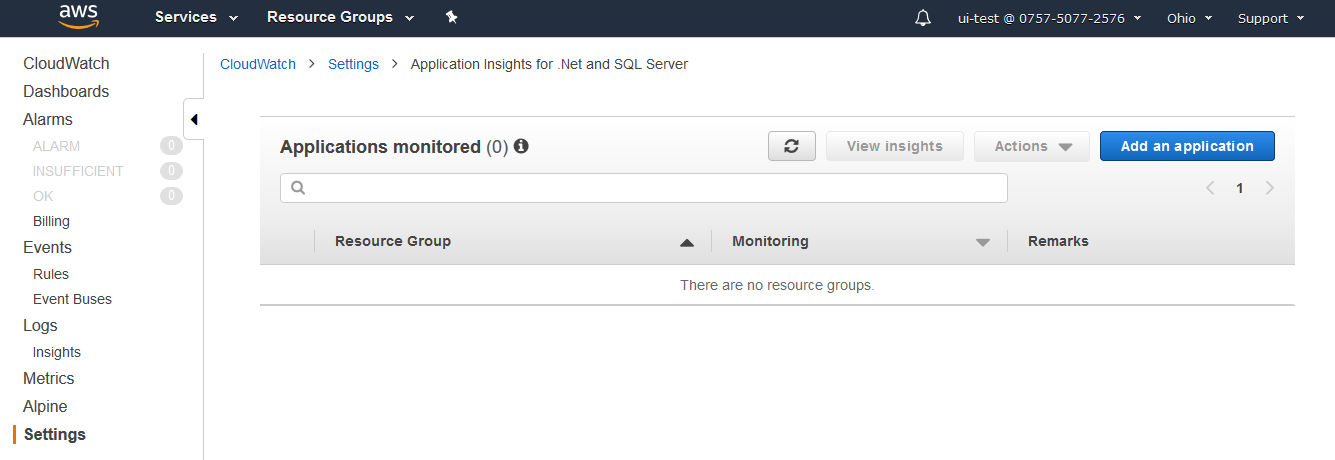
Getting started with CloudWatch Application Insights for your .NET and SQL Server applications is easy. In the CloudWatch console Settings, choose Application Insights for .NET and SQL Server, and then Add Application.
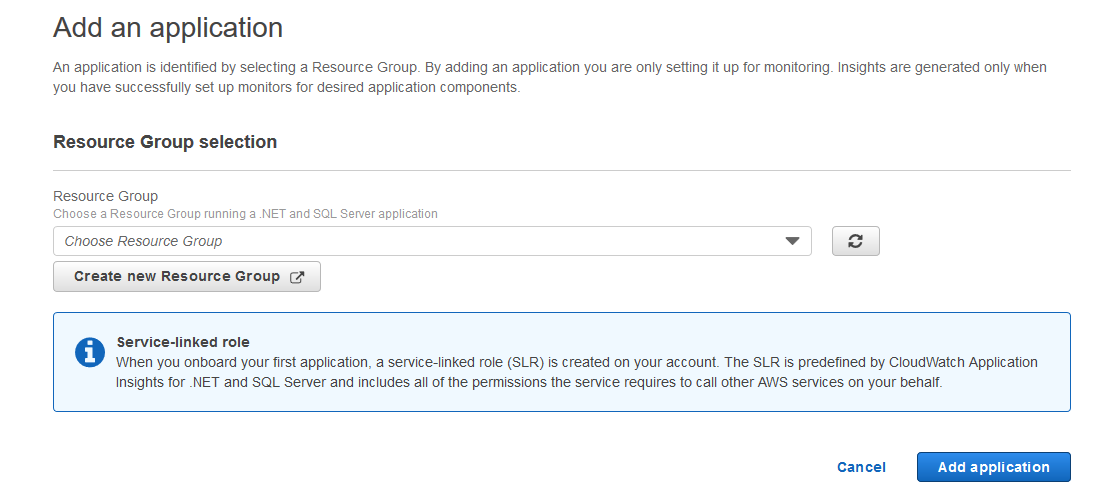
Next, select an AWS resource group that is running your application, including the resources running your backend SQL Server cluster, frontend IIS web servers and.NET worker-tier.
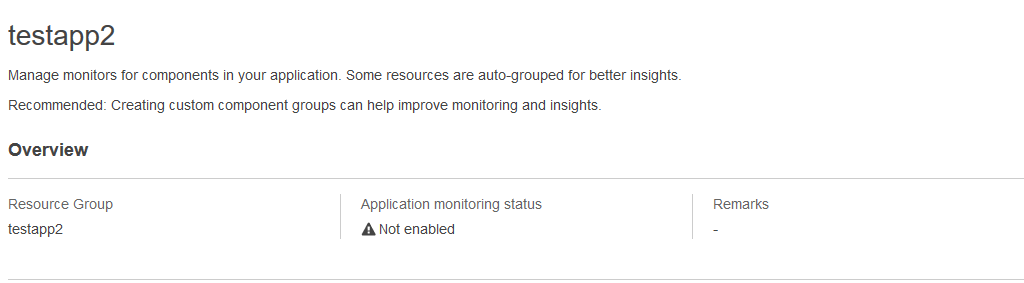
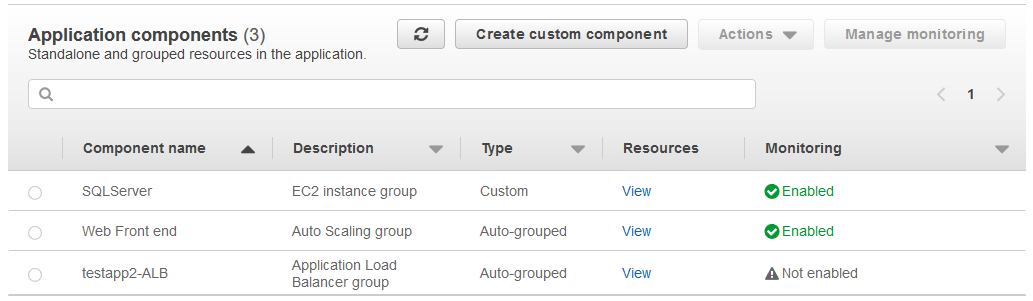
After you select the resource group, Amazon CloudWatch displays a list of potential application components, making it easy to set up monitors for similar resources and to group insights. These components are resources or groups of resources that are running a particular function or sub-service in your application.
For example, your .NET application has a set of EC2 instances in an Auto Scaling group, all of which are listed as an auto-grouped component. Using Amazon CloudWatch Application Insights, you can choose similar monitors for all of them and view them together.
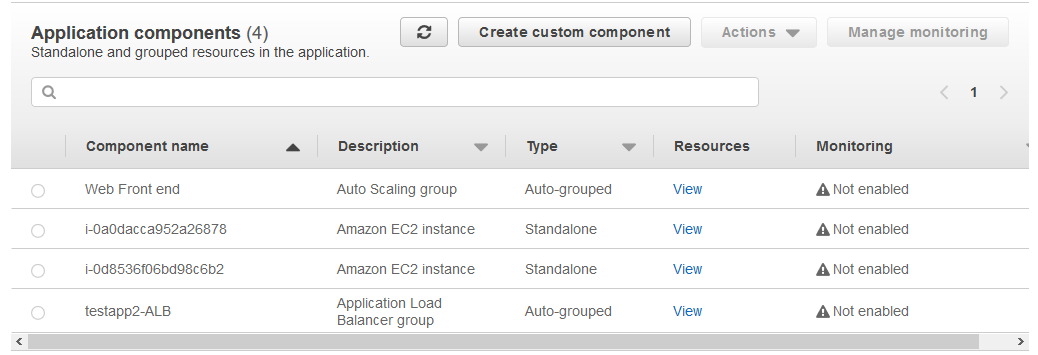
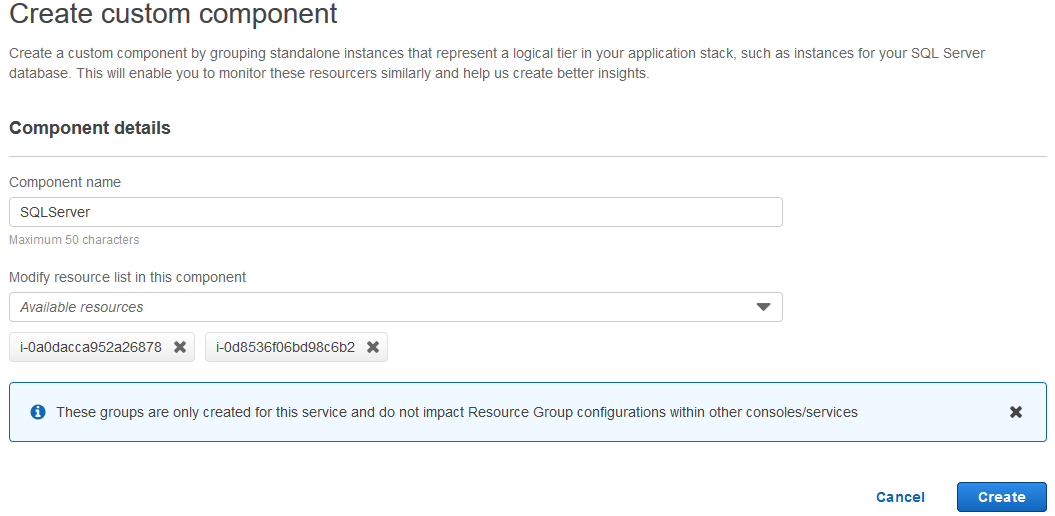
You can also create custom components by grouping similar resources.
To enable monitors for your application, you can select specific application components and manage monitoring for them.
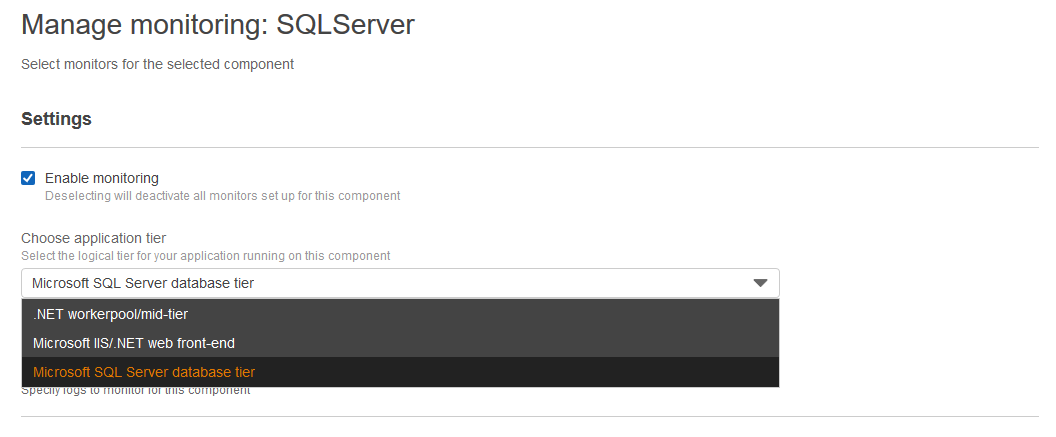
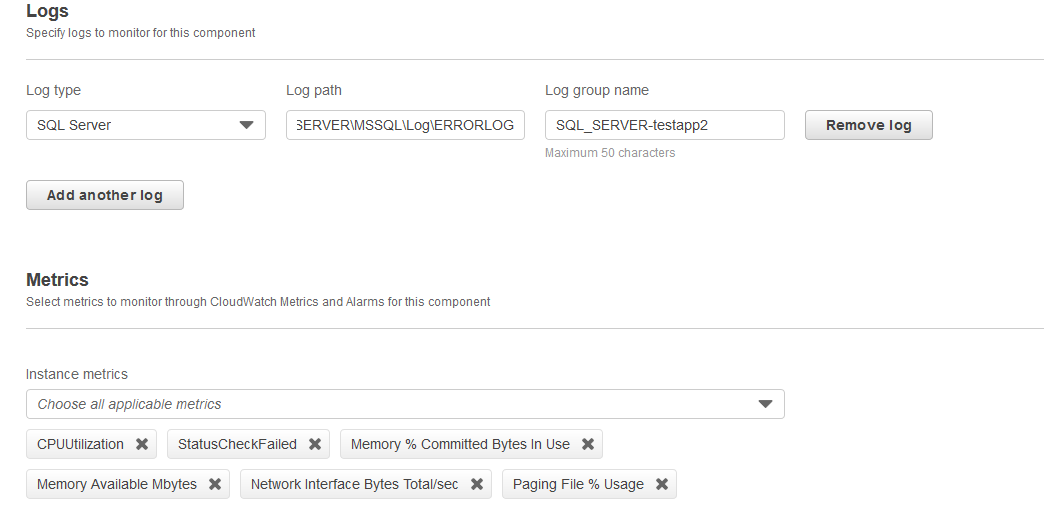
When you tell Amazon CloudWatch Application Insights the logical application tier represented by the selected component, it offers you a recommended, customizable list of logs, and metrics for underlying resources.
After you have saved monitors for your relevant application components, Amazon CloudWatch Application Insights automatically starts setting these up for you. You don’t need to log into the instance and update the Amazon CloudWatch Agent Configuration file manually.
It also sets up relevant alarms for the selected metrics using CloudWatch alarms and automatically updates them based on past metric patterns and how your application has been using underlying resources.
In fact, when your application scales up at any point, Amazon CloudWatch Application Insights automatically takes care of monitoring of the added resources for you!
Get started right away
CloudWatch Application Insights for .NET and SQL Server is now available in all commercial AWS Regions. There is no price for the monitoring assistance and analysis, but you pay the usual price for the monitoring data (metrics, logs, and alarms) as per public CloudWatch pricing.
For more information, see Getting Started with Amazon CloudWatch Application Insights for .NET and SQL Server.
About the author
 Purvi Goyal is a senior product manager with the Amazon EC2 team, where she strives to enhance the cloud experience of AWS Enterprise customers. Outside of work, she enjoys outdoor activities like hiking and kayaking.