AWS Cloud Operations Blog
How to Monitor Databricks with Amazon CloudWatch
This post was written by Lei Pan and Sajith Appukuttan from Databricks.
In this post, we look closely at monitoring and alerting systems – both critical components of any production-level environment. We’ll start with a review of the key reasons why engineers should build a monitoring/alerting system for their environment, the benefits, as well as the central components of a robust monitoring system.
We’ll also dig into the different ways to build a monitoring and alerting system on Databricks, with Amazon CloudWatch being one of them. In the last part, we’ll explain the reasons/benefits for choosing CloudWatch and the specific steps that engineers must follow to build a monitoring system on Databricks with CloudWatch.
Databricks Lakehouse Platform combines the best elements of data lakes and data warehouses – delivering data management and performance typically found in data warehouses with the low-cost, flexible object stores offered by data lakes. Thousands of customers use Databricks on AWS to run continuous data pipelines. Furthermore, job monitoring is a mission critical element to running these pipelines. You can learn more about Databricks on AWS here.
Why monitor and alert?
A robust monitoring and alerting system lets DevOps and engineering teams proactively answer the following questions to help maintain a healthy and stable production environment:
1) Health check: Are your jobs and your core/golden signals healthy?
2) Real-time alerting: Is something broken or about to be broken?
3) Ad hoc retrospective analysis: “Our jobs ran really slow last night; what happened around the same time?”
4) Experiment configurations: “Were my jobs running slower last week? Should we add more CPU or memory to improve performance?”
Core components in a Databricks monitoring and alerting system
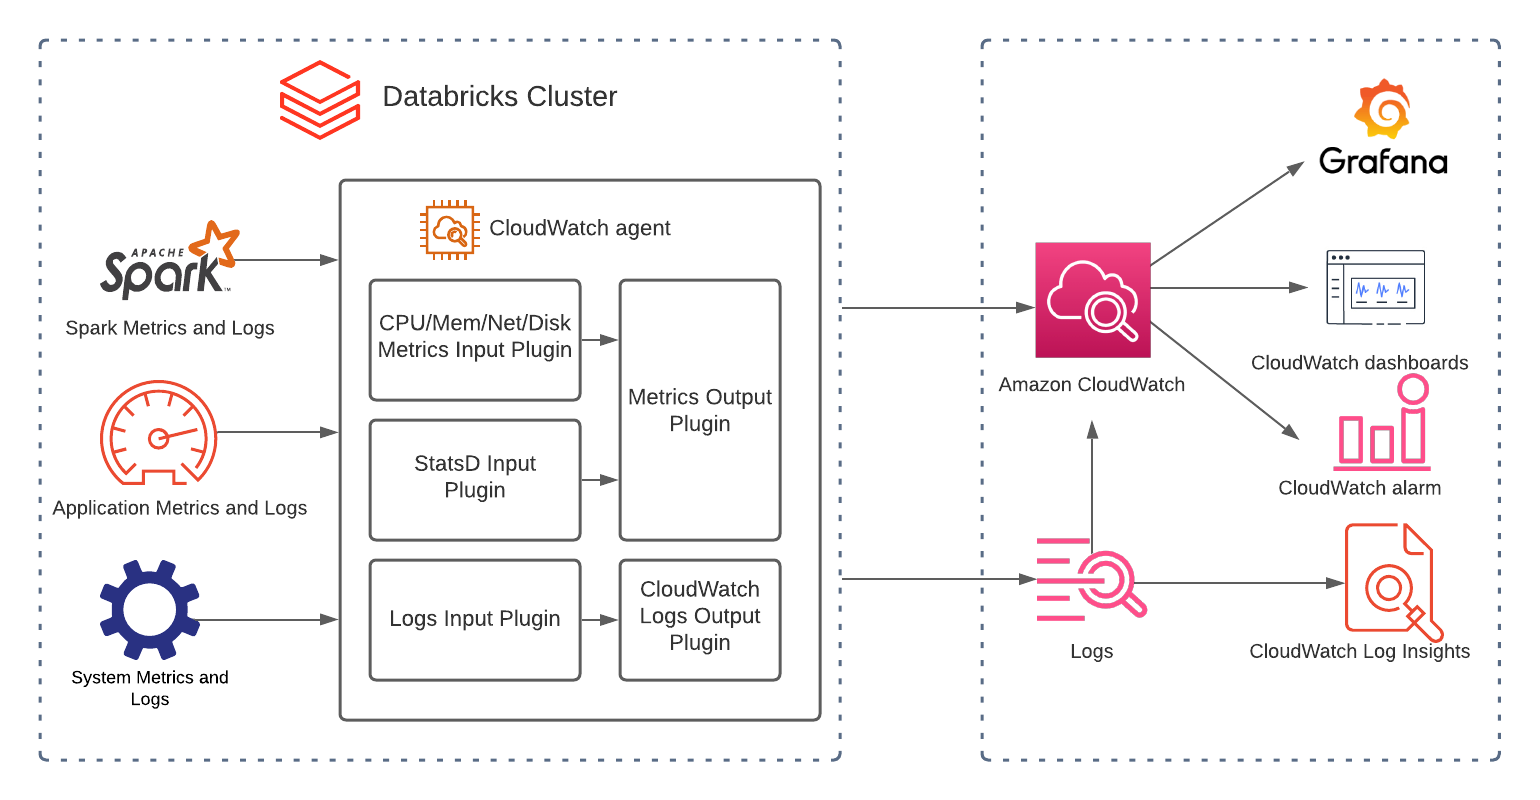
1) Metrics: Metrics are numbers that describe activity or a particular process measured over a period of time. Here are different types of metrics on Databricks:
- System resource-level metrics, such as CPU, memory, disk, and network.
- Application Metrics using Custom Metrics Source,
StreamingQueryListener, andQueryExecutionListener, - Spark Metrics exposed by
MetricsSystem.
2) Logs: Logs are a representation of serial events that have happened, and they tell a linear story about them. Here are different types of logs on Databricks:
- Event logs
- Audit logs
- Driver logs: stdout, stderr, log4j custom logs (enable structured logging)
- Executor logs: stdout, stderr, log4j custom logs (enable structured logging)
3) Traces: Stack traces provide end-to-end visibility, and they show the entire flow through stages. This is useful when you must debug to identify which stages/codes cause errors/performance issues.
4) Dashboards: Dashboards provide a great summary view of an application/service’s golden metrics.
5) Alerts: Alerts notify engineers about conditions that require attention.
Why Amazon CloudWatch?
Native solutions, such as Ganglia UI and Log Delivery, are great solutions for collecting system metrics and querying Apache Spark™ metrics. However, some areas can be improved:
- Ganglia doesn’t support alerts.
- Ganglia doesn’t support creating metrics derived from logs (e.g., ERROR log growth rate).
- You can’t use custom dashboards to track SLO (Service Level Objectives) and SLI (Service Level Indicators) related to data-correctness, data-freshness, or end-to-end latency, and then visualize them with ganglia.
Integrating Databricks with CloudWatch and enabling structured logging can help improve those areas. CloudWatch Application Insights can help you automatically discover the fields contained in the logs, and CloudWatch Logs Insights provides a purpose-built query language for faster debugging and analysis.
How to integrate Amazon CloudWatch with Databricks
Step 1:
Create IAM role with the following permissions:
- CloudWatchAgentServerPolicy
- ec2:DescribeTags – as we must fetch the cluster name in the init script from ec2 instance tags

Follow the steps similar to Using IAM Roles with an AssumeRole Policy so that the clusters can assume the new IAM role created above.
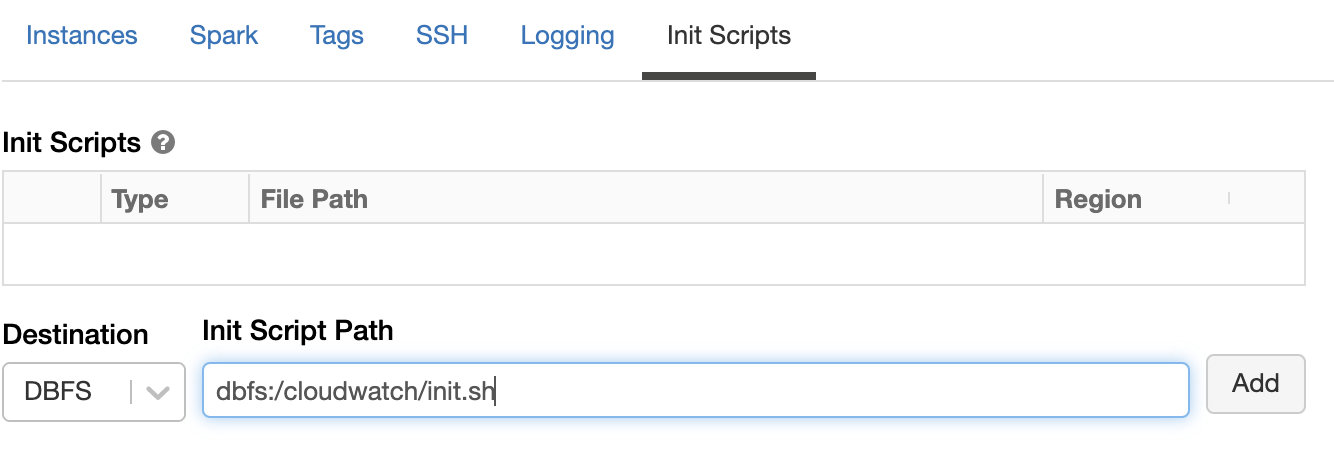
Step 2:
- Launch the clusters with the following init script:
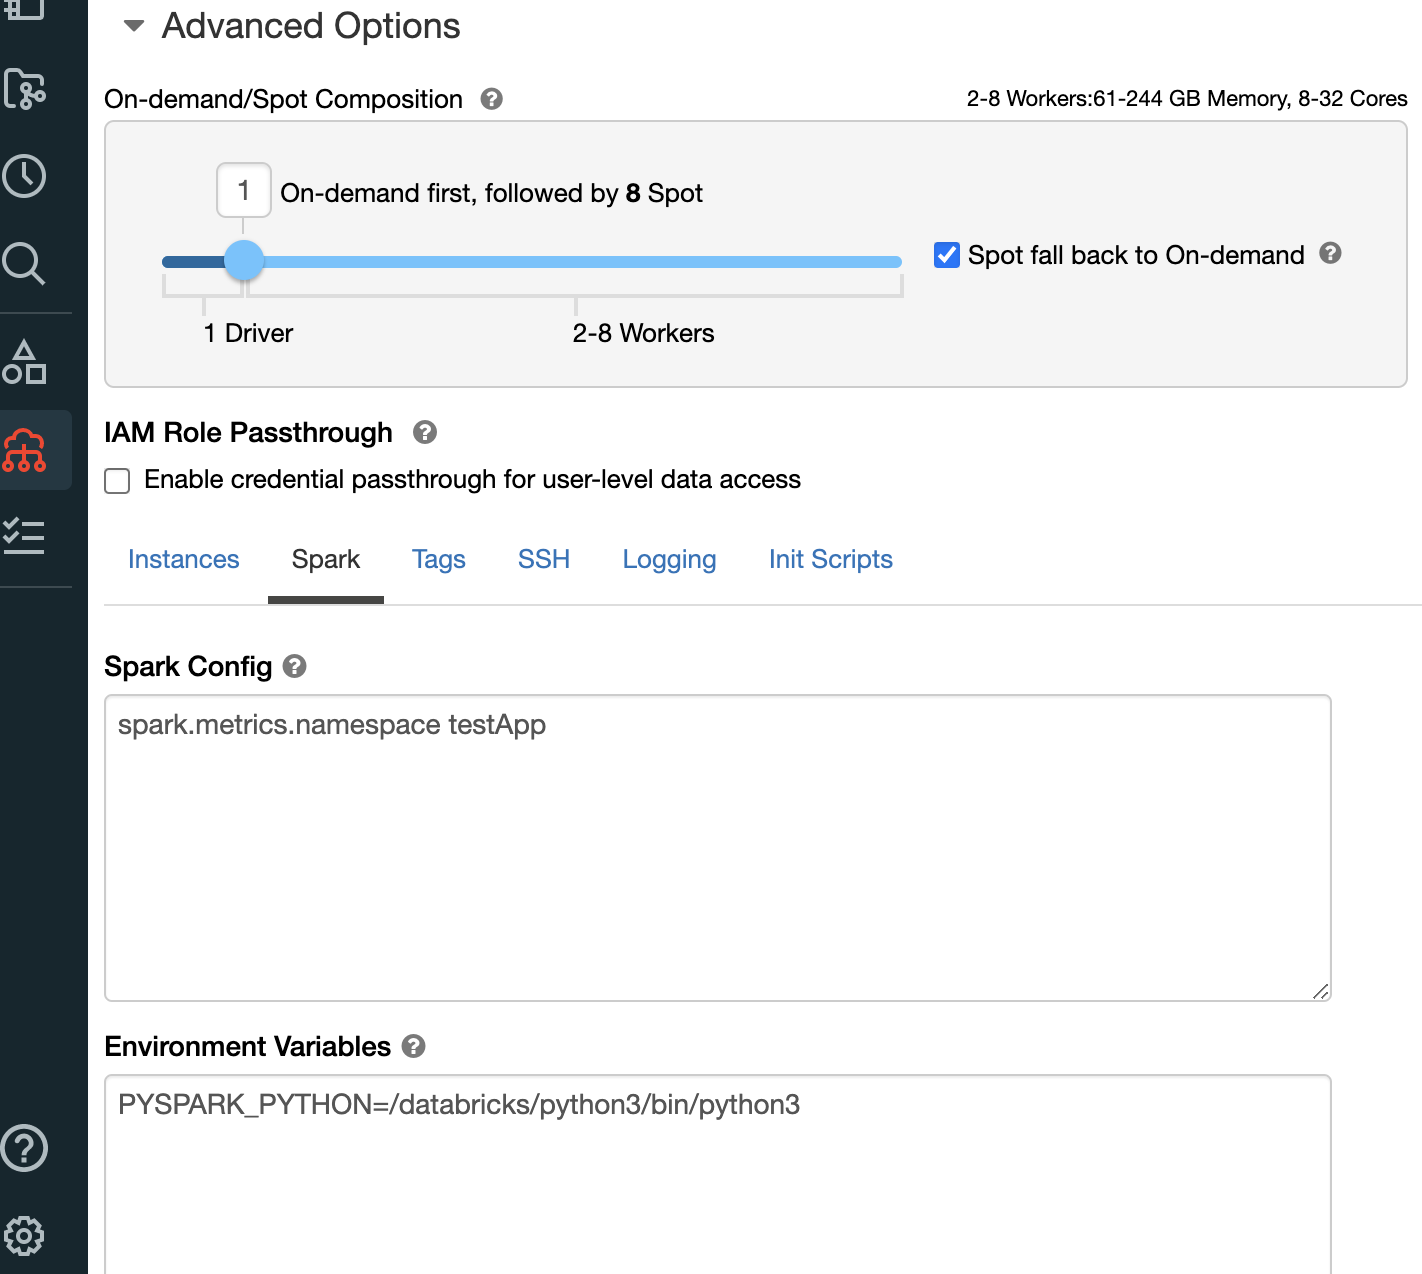
- Under Spark Config, set metrics.namespace <app-name> so that the application-id won’t be prefixed to the metrics.
Step 3:
- Confirm that the agent is running by running the following command:
%sh ps -ef |grep cloudwatch | grep agent
- The output of the above command will display the running PID.
Step 4:
- Configure Dashboards, Log metrics, and Alerts in the AWS Console. You can create dashboards by using the console, the AWS Command Line Interface (CLI), or the PutDashboard API.

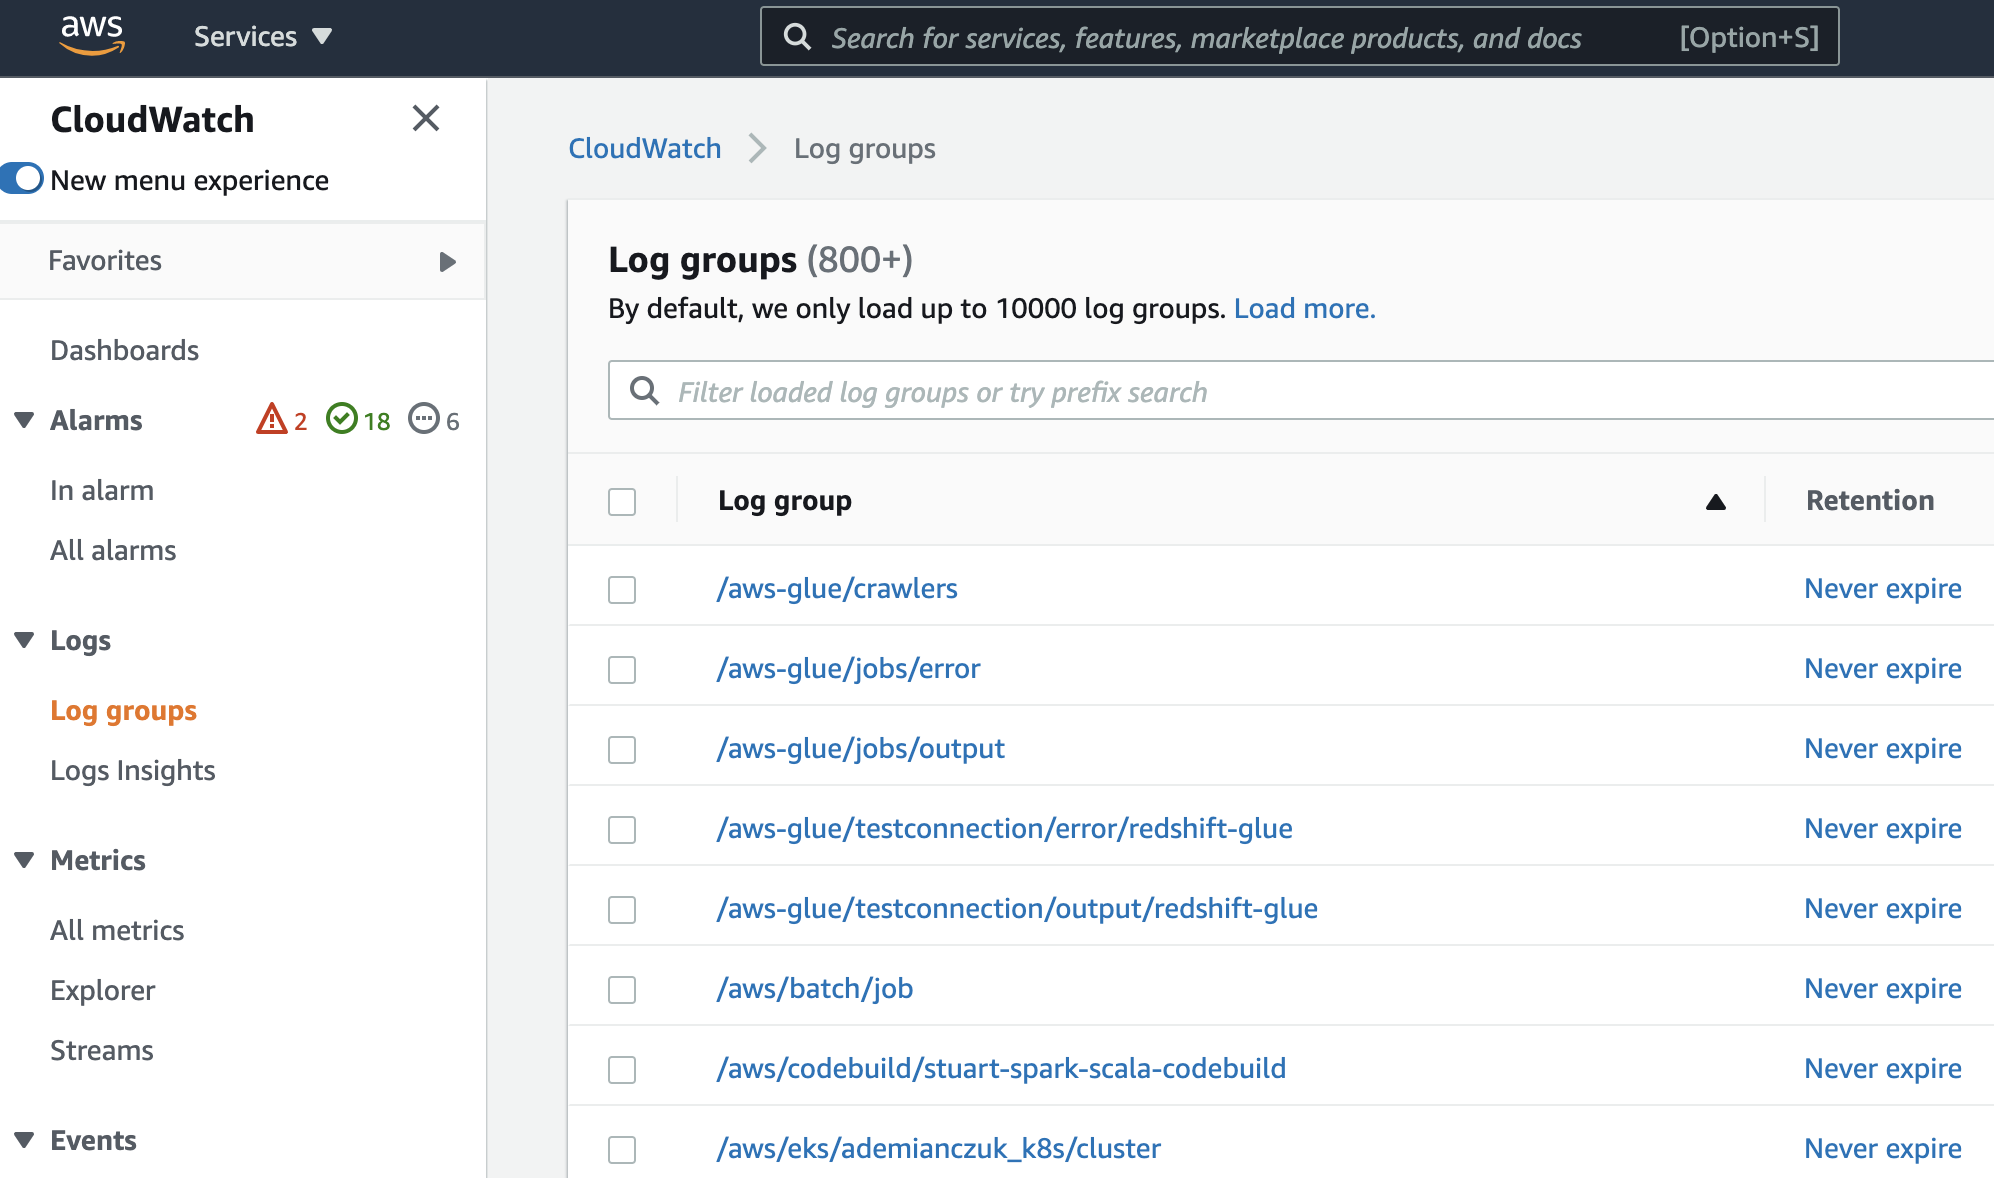
You can use the unified CloudWatch agent to create logs. This helps collect both logs and advanced metrics with one agent.
- You can add alarms to CloudWatch dashboards and monitor them visually.
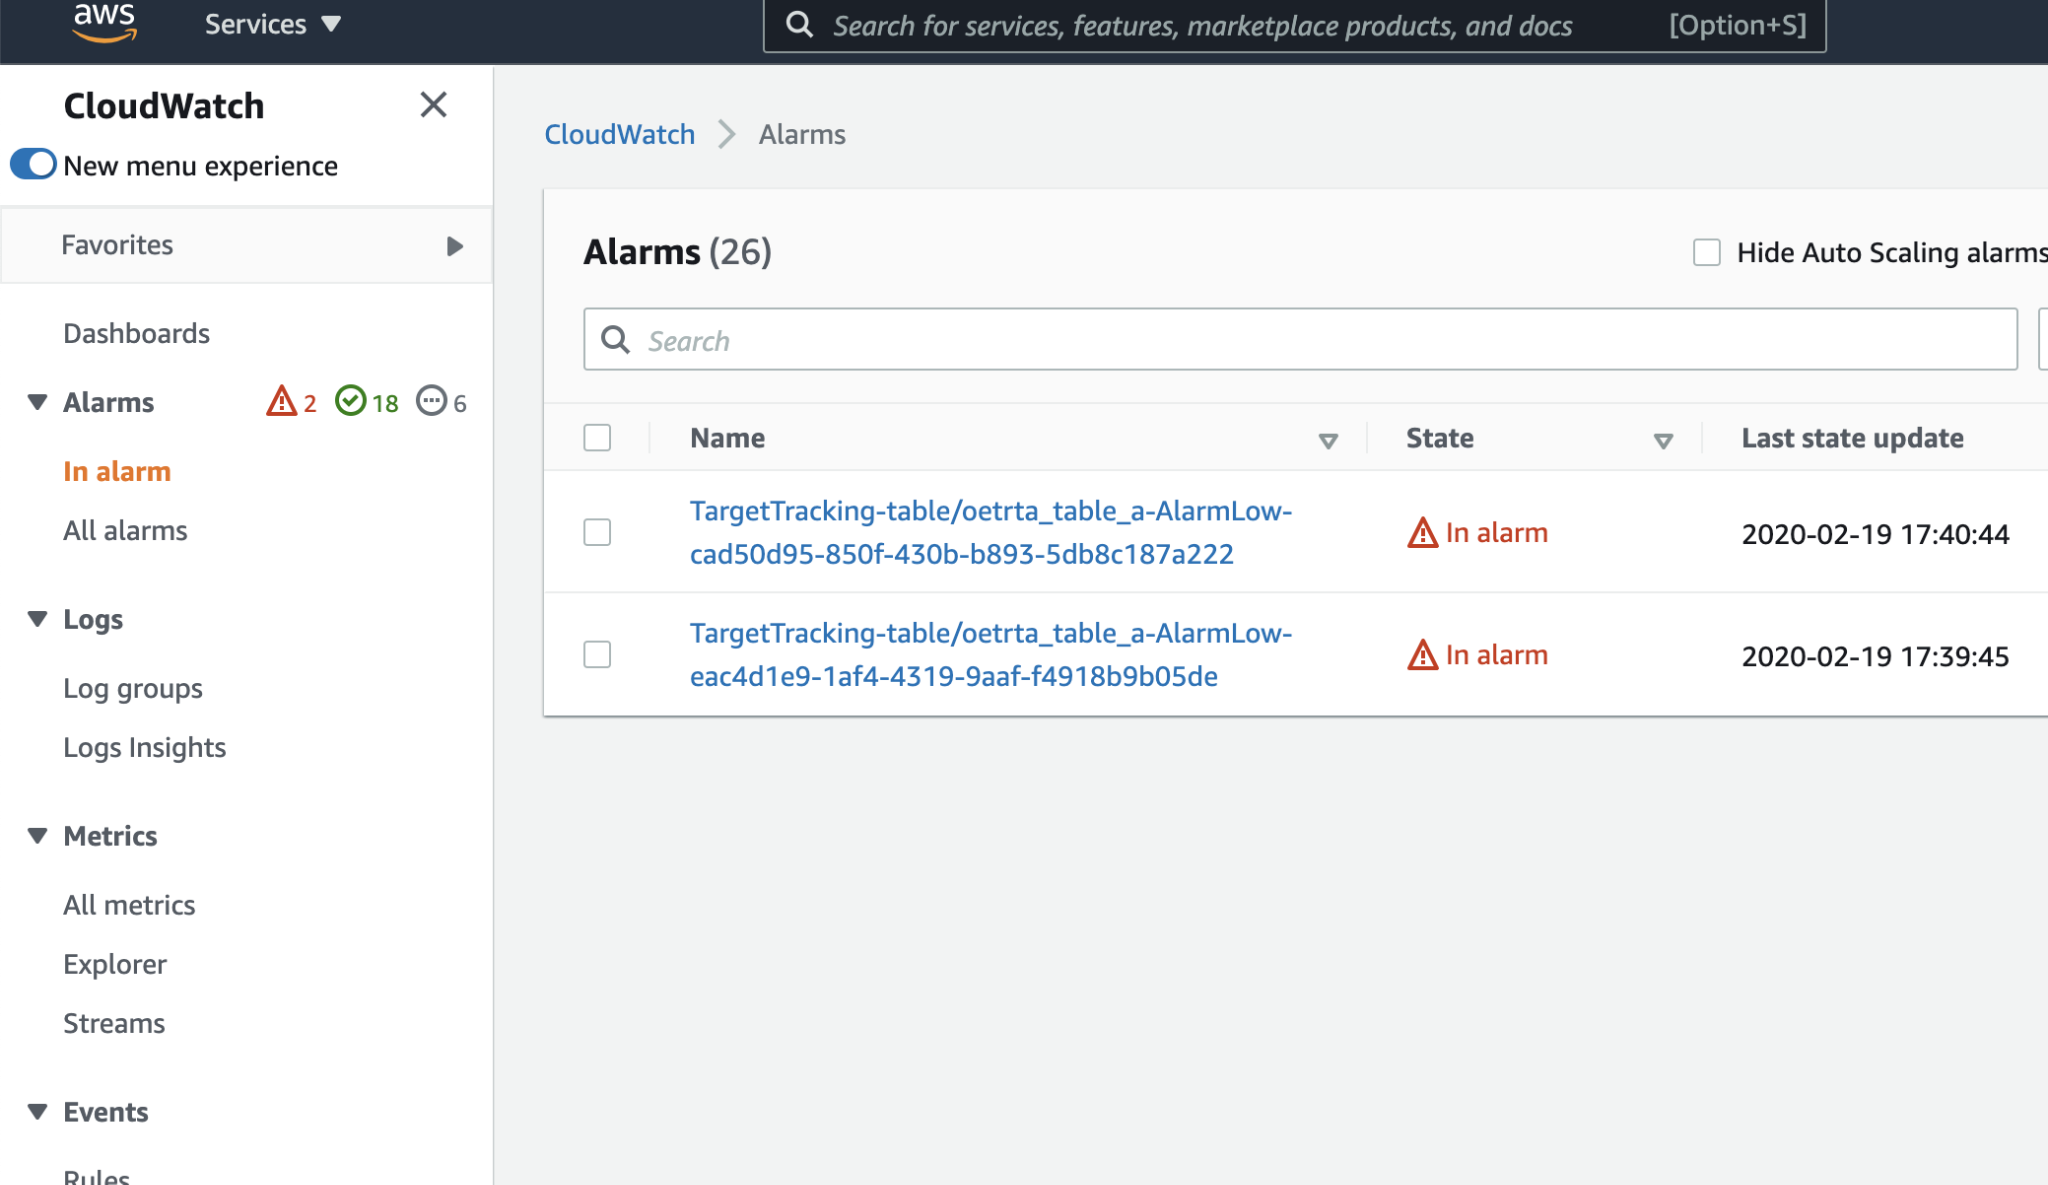
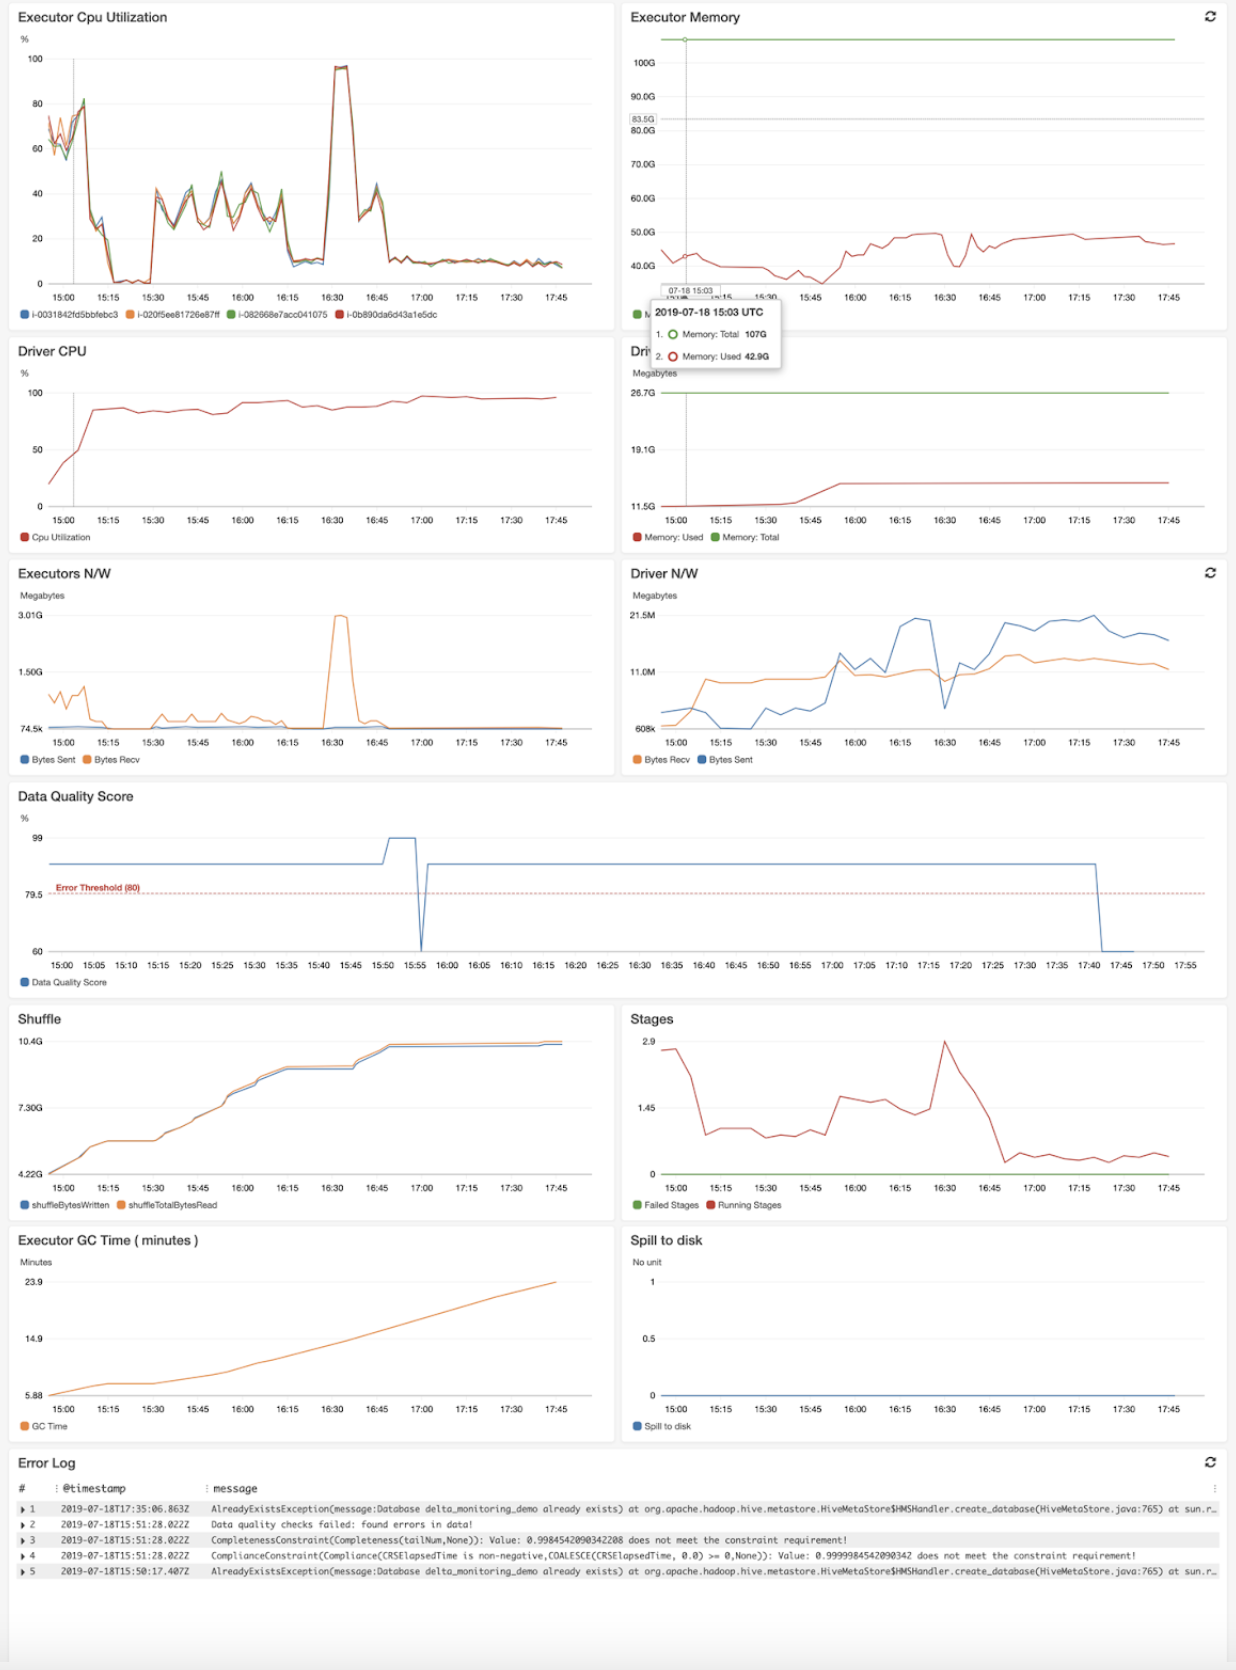
- Sample Dashboard and config are as follows:
Reliable Data Pipelines and Data Science Jobs
With monitoring and alerting in place, you can get ahead of issues in your data pipelines. By spotting slow jobs and failed jobs, you can address the issues that are causing them before they impact your entire organization. Whether it is identifying bad code, recognizing larger data sets, or finding regional outages, monitoring and alerting will let you pinpoint these issues to keep your data pipelines flowing
We give huge thanks to the solutions architects who have written excellent internal documentation on this topic. We’ve learned a lot from those internal documents.
What’s Next
- Try Databricks on AWS free for 14 days.
- Get started with Databricks notebooks, training, or schedule a demo.
- Learn more about at Amazon CloudWatch.