AWS Cloud Operations Blog
Introducing the ACK controller for Amazon Managed Service for Prometheus
We’re excited to announce that the Amazon Managed Service for Prometheus ACK controller is now generally available for the Workspace, Alert Manager and Ruler resources. The Amazon Managed Service for Prometheus ACK controller lets you take advantage of Prometheus using custom resource definitions (CRDs) and native Kubernetes objects without having to define any resources outside of your cluster.
When we first launched ACK, it supported six AWS services. Today we support over 20 AWS services, and that list is continually growing. One thing we continually hear from our customers running Amazon Elastic Kubernetes Service (Amazon EKS) is that they don’t want to use multiple tools to manage their infrastructure. Many Kubernetes operators find it a natural fit to use their clusters to manage all of their AWS infrastructure, allowing Kubernetes to be the single ‘source of truth’ for a resource’s desired state. In this post, I’ll show you how to configure Amazon Managed Service for Prometheus resources via ACK, and how to migrate a Prometheus workload to use these newly provisioned resources.
Prerequisites
For this blog post you will need:
- An Amazon EKS cluster
- Helm, the package manager for Kubernetes
- Control plane metrics with Prometheus
- Permission to create Amazon Identity and Access Management (IAM) roles
Deploying a workspace via ACK
For this example, I’ve set up an Amazon EKS cluster and I’ve configured control plane metrics with Prometheus, which I’ve deployed via Helm. When calling kubectl get --raw /metrics, I can see raw metrics in a Prometheus format. Next, deploy Amazon Managed Service for Prometheus resources via ACK.
To begin, it’s recommended to use Helm to install an ACK service controller on your cluster. Set the SERVICE and AWS_REGION environment variables to make sure that the Prometheus controller is installing in the current region.
export SERVICE=prometheusservice
export RELEASE_VERSION=`curl -sL https://api.github.com/repos/aws-controllers-k8s/$SERVICE-controller/releases/latest | grep '"tag_name":' | cut -d'"' -f4`
export ACK_SYSTEM_NAMESPACE=ack-system
export AWS_REGION=us-east-1

aws ecr-public get-login-password --region us-east-1 | helm registry login --username AWS --password-stdin public.ecr.aws
helm install --create-namespace -n $ACK_SYSTEM_NAMESPACE ack-$SERVICE-controller \
  oci://public.ecr.aws/aws-controllers-k8s/$SERVICE-chart --version=$RELEASE_VERSION --set=aws.region=$AWS_REGION
Run the command and after a few moments you should see the following message:
You are now able to create Amazon Managed Service for Prometheus (AMP) resources!
The controller is running in "cluster" mode.
The controller is configured to manage AWS resources in region: "us-east-1"
The ACK controller has been successfully installed and ACK can now be used to provision an Amazon Managed Service for Prometheus workspace. You can also verify the installation by running the following command:
helm list --namespace $ACK_SYSTEM_NAMESPACE -o yamlThis returns output that shows the controller has been deployed:
Next, begin creating AWS resources. For these steps to succeed, you must make sure that you have an IAM OIDC provider configured for your cluster. This lets you use IAM roles for your service accounts. The role that you use to provision Prometheus resources via ACK must have the arn:aws:iam::aws:policy/AmazonPrometheusConsoleFullAccess role.
First, create a workspace. The following is the YAML configuration used to create a workspace via native Kubernetes objects.
apiVersion: prometheusservice.services.k8s.aws/v1alpha1
kind: Workspace
metadata:
  name: my-amp-workspace
spec:
  alias: my-amp-workspace
  tags:
    ClusterName: EKS-demo
Save this to a file called workspace.yaml.
Use the following command to create the workspace:
kubectl apply -f workspace.yaml -n $ACK_SYSTEM_NAMESPACEAfter a few moments, I can see the new workspace is active within my account.
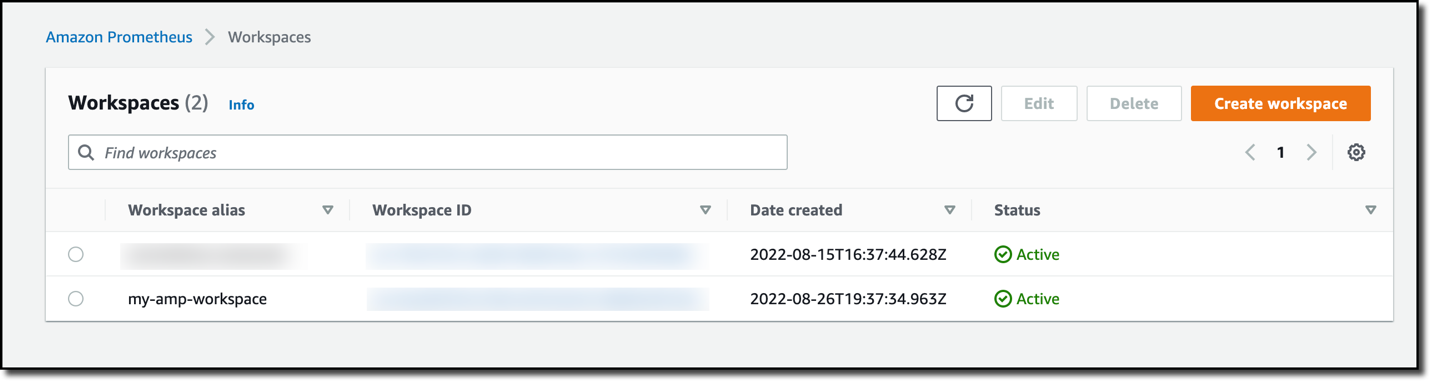
Figure 1. The AMP workspaces page shows a new workspace called “my-amp-workspace”, which was created by the AWS Controller for Kubernetes.
If you have an existing workspace or resource that you would like to manage using a controller, then this can be done by adopting the resource using the controller.
To view the details and status of your workspace, you can run the following command:
This command will provide the workspace ID of the newly created workspace, which is required to configure Alert Manager and Ruler in the next steps.
Next, follow the same steps as above to set up rule groups and an alert manager definition.
Save this YAML configuration as rulegroup.yaml. See RuleGroupsNamespaceData structure for the format of this file.
apiVersion: prometheusservice.services.k8s.aws/v1alpha1
kind: RuleGroupsNamespace
metadata:
  name: default-rule
spec:
  workspaceID: WORKSPACE-ID
  name: default-rule
  configuration: |
    groups:
    - name: example
      rules:
      - alert: HostHighCpuLoad
        expr: 100 - (avg(rate(node_cpu_seconds_total{mode="idle"}[2m])) * 100) > 60
        for: 5m
        labels:
          severity: warning
          event_type: scale_up
        annotations:
          summary: Host high CPU load (instance {{ $labels.instance }})
          description: "CPU load is > 60%\n  VALUE = {{ $value }}\n  LABELS = {{ $labels }}"
      - alert: HostLowCpuLoad
        expr: 100 - (avg(rate(node_cpu_seconds_total{mode="idle"}[2m])) * 100) < 30
        for: 5m
        labels:
          severity: warning
          event_type: scale_down
        annotations:
          summary: Host low CPU load (instance {{ $labels.instance }})
          description: "CPU load is < 30%\n  VALUE = {{ $value }}\n  LABELS = {{ $labels }}"
Replace WORKSPACE-ID with the Workspace ID of the new workspace that was created.
Save this YAML configuration as alertmanager.yaml. See AlertManagerDefinitionData structure for the format of this file.
apiVersion: prometheusservice.services.k8s.aws/v1alpha1
kind: AlertManagerDefinition
metadata:
  name: alert-manager
spec:
  workspaceID: WORKSPACE-ID
  configuration: |
    alertmanager_config: |
      route:
         receiver: default_receiver
      receivers:
        - name: default_receiver
          sns_configs:
          - topic_arn: TOPIC-ARN
            sigv4:
              region: REGION
            message: |
              alert_type: {{ .CommonLabels.alertname }}
              event_type: {{ .CommonLabels.event_type }}
Replace WORKSPACE-ID with the Workspace ID of the new workspace, TOPIC-ARN with the ARN of an Amazon Simple Notification Service (Amazon SNS) topic where you want to send the alerts, and REGION with the current region of the workload. Make sure that your workspace has permissions to send messages to Amazon SNS.
Apply these changes by issuing the following commands:
kubectl apply -f rulegroup.yaml -n $ACK_SYSTEM_NAMESPACE

kubectl apply -f alertmanager.yaml -n $ACK_SYSTEM_NAMESPACE
Again, after a few moments, both the new rule group and the alert manager configuration are ready within the workspace.
To update a resource, for example to change an alerting rule, then use the controller to make this change. To update any resource managed by the ACK controller, you can call:
Where the <resource type> is Workspace, AlertManagerDefinition, or RuleGroupsNamespace, the <resource name> is the name specified in the custom resource metadata name field.
You can also edit the original file that contains the custom resource, save the changes, and then apply it:
Finally, you can delete resources managed by the controller by issuing the following command:
kubectl delete <resource type> <resource name> -n $ACK_SYSTEM_NAMESPACEConfiguring Prometheus to remote write
Now that a workspace has been successfully created and configured, you just need to update the Prometheus configuration of the workload to remote write to the new workspace. As a first step, make sure that you have set up the necessary IAM roles for your service accounts. As part of this step, make sure that you have an IAM role called amp-iamproxy-ingest-role created.
Save the following YAML configuration as prometheus-config.yaml
serviceAccounts:
        server:
            name: "amp-iamproxy-ingest-service-account"
            annotations:
                eks.amazonaws.com/role-arn: "arn:aws:iam::ACCOUNT-ID:role/amp-iamproxy-ingest-role"
server:
    remoteWrite:
        - url: WORKSPACE-REMOTE-WRITE-URL
          sigv4:
            region: REGION
          queue_config:
            max_samples_per_send: 1000
            max_shards: 200
            capacity: 2500
Replace ACCOUNT-ID with your account ID, WORKSPACE-REMOTE-WRITE-URL with the remote write URL of your workspace, and REGION with the current region of the workload.
Next, find the Helm chart name and version of the workload by using the following command:
helm ls --all-namespacesWe named the Prometheus chart as well as the namespace to prometheus. We use chart version 15.12.0.
Finally, enter the following command:
Where PROMETHEUS-CHART-NAME is the name of the chart found in the previous step, PROMETHEUS-NAMESPACE is the namespace found in the previous step, and PROMETHEUS-CHART-VERSION is the version of the chart from the previous step.
The call in your environment should look similar to the following:
helm upgrade prometheus prometheus-community/prometheus -n prometheus -f prometheus-config.yaml --version 15.12.0After a few minutes, you’ll get a message that the upgrade was successful.
You can validate that metrics are coming through successfully by querying the AMP endpoint via awscurl:
awscurl --service="aps" --region="REGION" "https://AMPENDPOINT/api/v1/query?
query=node_cpu_seconds_total"
Conclusion
In this post, we demonstrated how to use the ACK controller inside an Amazon EKS cluster to manage Amazon Managed Service for Prometheus resources. With the ACK controller, you can use CRDs to configure Workspaces, and Alert Manager and Ruler via native Kubernetes objects. You can use the controller to manage all of your Amazon Managed Service for Prometheus resources directly from the cluster that you’re monitoring, allowing Kubernetes to act as your ‘source of truth’ for your workload’s desired state.
Get started today by installing an ACK controller on your Amazon EKS cluster so you can begin managing AWS cloud resources via Kubernetes.
About the authors: