AWS Cloud Operations Blog
Monitoring and Visualizing Amazon EKS signals with Kiali and AWS managed open-source services
Microservices architecture enables scalability and agility for modern applications. However, distributed systems can introduce complexity when troubleshooting issues across services on different machines. To gain observability into microservices environments, operators need tools to monitor, analyze, and debug the interconnected services.
Istio service mesh connects, secures, and observes microservices communications. It provides a way to manage and monitor microservices landscapes. Kiali offers a graphical console to view and control Istio configurations by visualizing the service mesh topology, displaying metrics, and validating configurations. Kiali integrates with Prometheus to analyze the mesh and surface insights.
Amazon Managed Service for Prometheus is a fully-managed monitoring and alerting service compatible with Prometheus. It allows easy monitoring of containerized applications at scale by auto-scaling ingestion, storage, alerting, and querying as workloads change.
Also, we’ll explore integrating Kiali with Amazon Managed Service for Prometheus to query Prometheus metrics. We’ll also look at adding Amazon Managed Grafana for advanced querying and custom Istio dashboards. This allows you to build insightful dashboards that provide visibility into the performance and health of your Istio-enabled services.
Architecture
The following diagram shows the architecture for deploying and configuring Kiali, Amazon Managed Service for Prometheus, AWS Distro for OpenTelemetry (ADOT) collector and Amazon Managed Grafana:

Figure 1 – Architecture for deploying and configuring Kiali, Amazon Managed Service for Prometheus, ADOT collector and Amazon Managed Grafana
1. The ADOT Collector scrapes Istio telemetry metrics from the containerized application running on Amazon Elastic Kubernetes Services (Amazon EKS).
2. The metrics data scraped by the ADOT Collector is sent to Amazon Managed Prometheus by the ADOT’s Prometheus Remote Write Exporter.
3. Kiali visualizes the Istio telemetry metrics from Amazon Managed Service for Prometheus. Before Kiali can query the Istio metrics in Amazon Managed Service for Prometheus, it needs to authenticate with the service. Since Kiali does not natively support AWS Signature Version 4 (AWS Sigv4) authentication, an AWS Sigv4 proxy is used to enable Kiali to authenticate. AWS SigV4 is the process to add authentication information to Amazon API requests sent by HTTP header. Also, Kiali relies on the default metrics set provided by Istio, so these metrics must be available in Prometheus.
4. Kiali dashboards provide direct links to Amazon Managed Grafana for advanced analysis and queries Istio Dashboards. To enable these links, the Amazon Managed Grafana URL and preconfigured Istio dashboards must be configured in Kiali.
5. With Amazon Managed Grafana, you can leverage querying and data transformation features to customize Istio dashboard panels and create visualizations tailored to your needs. The advanced queries and customization settings enable you to fine-tune graphs and charts to focus on the most relevant Istio metrics and data for your system. When accessing Amazon Managed Grafana via the Kiali links, Amazon Managed Grafana retrieves the Istio dashboards from Amazon Managed Prometheus. And Amazon Managed Service for Prometheus is configured as data source in Amazon Managed Grafana.
Solution overview
Prerequisites
● AWS Command Line Interface (AWS CLI)
● eksctl
● kubectl
● Create an Amazon EKS Cluster
● Create an Amazon Managed Service for Prometheus Workspace
● Create an IAM OIDC identity provider for your EKS cluster
● Install AWS Distro for OpenTelemetry (ADOT) Collector on EKS cluster
● Istio installation; If you don’t have Istio already installed on your EKS cluster, please refer to Istio Getting Started Guide, ensure successful installation of sample application and verify external access.
Step 1: Configure AWS Identity and Access Management (IAM) role and Service Account for Kiali Proxy
Kiali has two main components: a back-end application running in a container, and a front-end UI application. The Kiali back-end needs access to Amazon Managed Service for Prometheus in order to query Istio metrics.
To enable this access, you need to create an IAM Service Account with an IAM role that has the AmazonPrometheusQueryAccess policy attached. This IAM role should then be associated with the EKS cluster that is running Kiali. Attaching this IAM role to the EKS cluster allows the Kiali back-end pod to authenticate with Amazon Managed Service for Prometheus using the credentials from the Service Account, and query Prometheus metrics.
Then, you need to enable IAM as OIDC Provider for EKS Cluster as it is not enabled by default. You should have done this as part of prerequisite. If already exists, below commands will not create new OIDC provider.
export EKS_CLUSTER=<Your EKS Cluster Id>
eksctl utils associate-iam-oidc-provider --cluster=$EKS_CLUSTER --approve
Create new Service Account and IAM role to query Amazon Managed Service for Prometheus from Kiali.
export AMP_SIGV4_IAM_ROLE=amp-sigv4-proxy-query-role
eksctl create iamserviceaccount \
--name $AMP_SIGV4_IAM_ROLE \
--namespace istio-system \
--cluster $EKS_CLUSTER \
--attach-policy-arn arn:aws:iam::aws:policy/AmazonPrometheusQueryAccess \
--approve \
--override-existing-serviceaccounts
Step 2: Configure AWS Sigv4 authentication for querying Amazon Managed Service for Prometheus
AWS Sigv4 is a process to add authentication information to requests made to AWS APIs using HTTP header. The AWS CLI and the AWS SDKs already use this protocol to make calls to the AWS APIs. Amazon Managed Service for Prometheus requires the API calls to have sigv4 authentication, and since Kiali doesn’t support sigv4, we will be deploying a sigv4 proxy service to act as a gateway for Kiali to authenticate and access the query endpoint of the Amazon Managed Service for Prometheus.
Execute the following commands to deploy the sig-v4 proxy pod on your EKS cluster:
export AWS_REGION=us-west-2 # Update AWS region as per your use case
cat << EOF > kiali-sigv4.yaml
---
apiVersion: apps/v1
kind: Deployment
metadata:
  labels:
    app: kiali-sigv4
  name: kiali-sigv4
  namespace: istio-system
spec:
  replicas: 1
  selector:
    matchLabels:
      app: kiali-sigv4
  template:
    metadata:
      labels:
        app: kiali-sigv4
      name: kiali-sigv4
    spec:
      serviceAccountName: ${AMP_SIGV4_IAM_ROLE}
      containers:
      - name: aws-kiali-iamproxy
        image: public.ecr.aws/aws-observability/aws-sigv4-proxy:1.7
        args:
          - --name
          - aps
          - --region
          - ${AWS_REGION}
          - --host
          - aps-workspaces.${AWS_REGION}.amazonaws.com
        ports:
          - containerPort: 8080
---
apiVersion: v1
kind: Service
metadata:
  name: kiali-sigv4
  namespace: istio-system
spec:
  ports:
  - port: 80
    targetPort: 8080
  selector:
    app: kiali-sigv4
---
EOF
# Create Kiali Sigv4 proxy pod
$ kubectl apply -f kiali-sigv4.yaml
You should see Kiali Sigv4 proxy pod running as shown below:
$ kubectl get pods -A | grep 'kiali-sigv4'
istio-system kiali-sigv4-749dfd8694-rpt8c 1/1 Running 0 55s
Step 3: Update Kiali add-on config to point to Amazon Managed Service for Prometheus
Go to your Kiali add-on config under /samples/addons/kiali.yaml in your Istio deployment folder.
By default, Kiali assumes that Prometheus is available at the URL of the form http://prometheus.<istio_namespace_name>:9090, which is the case if you are using the Prometheus Istio add-on. Since, in this case we are using Amazon Managed Service for Prometheus workspace to query metrics, you must manually provide the endpoint. For more information, see Prometheus configuration for Kiali.
Note: If you already have any existing Kiali add-on, you can also edit kiali configmap for the same to apply configuration changes for ‘external services’ section as discussed above and restart the kiali pod.
Update the Amazon Managed Service for Prometheus URL with Workspace ID:
WORKSPACE_ID=$(aws amp list-workspaces --alias observability-workshop | jq .workspaces[0].workspaceId -r)
AMP_URL="http://kiali-sigv4.istio-system.svc.cluster.local:80/workspaces/$WORKSPACE_ID/"
Let’s update external services section in kiali.yaml file to include Amazon Managed Service for Prometheus URL. Use sed command to update external_services section as below. Make sure you are in your Istio deployment folder in path samples/addons.
# AMP_URL will be updated as environmental variable
sed -i "/external_services:/a\ prometheus:\n url: \""${AMP_URL}"\"\n custom_metric_url: \""${AMP_URL}"\"\n thanos_proxy:\n enabled: true\n retention_period: "7d"\n scrape_interval: "30s" " kiali.yaml
Note: Ensure to use gsed when running this command on macOS.
The updated code snippet looks like below:
external_services:
      prometheus:
        url: "http://kiali-sigv4.istio-system.svc.cluster.local:80/workspaces/ws-334fc448-e889-479d-83aa-b44f01d3xxxx/"
        custom_metric_url: "http://kiali-sigv4.istio-system.svc.cluster.local:80/workspaces/ws-334fc448-e889-479d-83aa-b44f01d3xxxx/"
        thanos_proxy:
          enabled: true
          retention_period: "7d"
          scrape_interval: "30s"
Step 4: Install Kiali add-on for Istio
Now, make sure you are in your Istio deployment folder and then run below to deploy Kiali add-on pod:
$ kubectl apply -f samples/addons/kiali.yaml
serviceaccount/kiali created
configmap/kiali created
clusterrole.rbac.authorization.k8s.io/kiali-viewer created
clusterrole.rbac.authorization.k8s.io/kiali created
clusterrolebinding.rbac.authorization.k8s.io/kiali created
role.rbac.authorization.k8s.io/kiali-controlplane created
rolebinding.rbac.authorization.k8s.io/kiali-controlplane created
service/kiali created
deployment.apps/kiali created
$ kubectl get pods -A | grep 'kiali'
istio-system kiali-5db6985fb5-h6n5z 1/1 Running 0 3m39s
istio-system kiali-sigv4-749dfd8694-rpt8c 1/1 Running 0 14m
Let’s validate Kiali configmap to ensure configuration have been applied correctly. You should see similar to the following:
$ kubectl describe cm kiali -n istio-system | grep url
url: "http://kiali-sigv4.istio-system.svc.cluster.local:80/workspaces/ws-3ef85564-bb57-48bc-8acb- xxxxxxxxxx/"
custom_metric_url: "http://kiali-sigv4.istio-system.svc.cluster.local:80/workspaces/ws-3ef85564-bb57-48bc-8acb-xxxxxxxxxx/"
You can validate logs to ensure there are no errors for Kiali pod:
# Validate Logs for any error
export kp=$(kubectl -n istio-system get pod -l app=kiali -o jsonpath='{.items[0].metadata.name}')
kubectl logs -f $kp -n istio-system
Step 4: Generate traffic to collect telemetry data (optional)
To view the view telemetry data, you need to generate the traffic by accessing the application multiple times, open a new terminal tab and use these commands to send a traffic to the mesh:
export GATEWAY_URL=$(kubectl -n istio-system get service istio-ingressgateway -o jsonpath='{.status.loadBalancer.ingress[0].hostname}')
watch --interval 1 curl -s -I -XGET "http://${GATEWAY_URL}/productpage"
The above command sends the request for every 1 second and recommended to keep in running for at least 30 minutes to visualize the dashboard with sufficient data.
Step 5: Launch Kiali
Open a new terminal tab and launch Kiali dashboard by executing the following command
# Port Forward
export ks=$(kubectl -n istio-system get service -l app=kiali -o jsonpath='{.items[0].metadata.name}')
kubectl port-forward -n istio-system svc/$ks 20001:20001
http://localhost:20001/kiali
Optionally, if you are using AWS Cloud9 instance as your local environment, associate IPv4 address for port forwarding and update security rules for access.
kubectl port-forward -n istio-system svc/$ks 20001:20001 --address 0.0.0.0
http://$cloud9IP:20001/kiali
Now, let’s take a look at the Kiali console. Kiali dashboards provide valuable insights into your service mesh’s health, including the infrastructure and application services. It enables configuration, updates, and validation of your Istio service mesh. Kiali monitors various components of the service mesh, such as Istio-ingressgateway and Istio-egressgateway, to identify any underlying issues. Kiali offers multiple ways to examine mesh topology, with the Kiali Graph providing a powerful visualization of mesh traffic for quick issue identification. Additionally, Kiali performs semantic validations on Istio objects, ensuring coherence across objects and even across namespaces based on the runtime status of the service mesh. Overall, Kiali dashboards are a comprehensive tool for monitoring, visualization, and validating Istio service mesh metrics.
For example, in the following Workloads dashboard, you can view the Istio standard metrics of your application such as Request volume, Request duration, Request throughput and Response throughput.
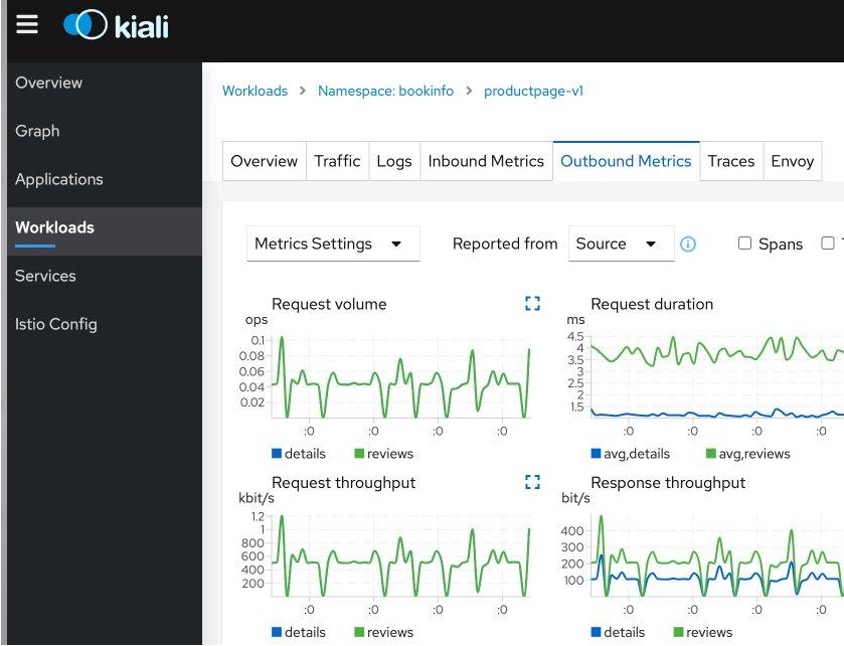
Figure 2 – Kiali Dashboard – Workloads
Note: If you have installed your sample application bookinfo in default namespace select default namespace to view workload metrics.
Step 6: (Optional) Kiali Integration with Amazon Managed Grafana
Amazon Managed Grafana enables you to instantly query, correlate, and visualize operational metrics, logs, and traces for their applications from multiple data sources. You can integrate Amazon Managed Grafana with Kiali if you are looking for advanced querying options and highly customizable settings for Istio dashboards.
Refer to Amazon Managed Grafana – Getting Started for information on how to configure and setup Amazon Managed Grafana. Amazon Managed Grafana lets you to configure user access through AWS IAM Identity Center or other SAML based Identity Providers (IdP). In this post, we’re using the AWS IAM Identity Center option with Amazon Managed Grafana. To set up Authentication and Authorization, follow the instructions in the Amazon Managed Grafana User Guide for enabling AWS IAM Identity Center. Refer Monitor Istio blog post to import Istio dashboards and query metrics from Amazon Managed service Prometheus workspace.
Kiali relies on Istio’s default being metrics set. Therefore, it is recommended to add Istio Dashboards in the Import via grafana.com text box in Amazon Managed Grafana. A few curated Istio dashboards you can leverage are – Service Dashboard, Workload Dashboard, Mesh Dashboard, Control Plane Dashboard, Performance Dashboard and Wasm Extension Dashboard.
Since you have already updated Kiali add-on in step 3, now update the configuration for adding Grafana link in Kiali dashboard in the file /samples/addons/kiali.yaml in your Istio deployment folder on EKS cluster.
Kiali uses Amazon Grafana API Key as token to access Grafana. Let’s first get the Grafana API key from Amazon Managed Grafana workspace.
$ export GRAFANA_API_KEY=$(aws grafana create-workspace-api-key --key-name "kiali_access_key3" \
--key-role "ADMIN" --seconds-to-live 432000 \
--workspace-id "<Grafana workspace_id>" | jq '.key') # Update with your Grafana workspace ID
$echo $GRAFANA_API_KEY
Now, update the Grafana_API_key from preceding and update your Grafana_workspace_URL. Update kiali.yaml as shown in the following code block. For more information on the detailed Kiali configuration for Grafana link refer Kiali documentation.
# kiali.yaml
external_services:
      custom_dashboards:
        enabled: true
      grafana:
        auth:
          type: "bearer"
          token: "<Grafana_API_key>" # update Grafana API Key
        enabled: true
        in_cluster_url: "<Grafana_workspace_URL>" # Update Grafana Workspace URL
        url: "<Grafana_workspace_URL>"
        dashboards:
        - name: "Istio Service Dashboard"
          variables:
            namespace: "var-namespace"
            service: "var-service"
        - name: "Istio Workload Dashboard"
          variables:
            namespace: "var-namespace"
            workload: "var-workload"
        - name: "Istio Mesh Dashboard"
        - name: "Istio Control Plane Dashboard"
        - name: "Istio Performance Dashboard"
        - name: "Istio Wasm Extension Dashboard"
After updating the kiali.yaml , re-deploy the Kiali add-on for Istio.
$ kubectl apply -f samples/addons/kiali.yaml
serviceaccount/kiali created
configmap/kiali created
clusterrole.rbac.authorization.k8s.io/kiali-viewer created
clusterrole.rbac.authorization.k8s.io/kiali created
clusterrolebinding.rbac.authorization.k8s.io/kiali created
role.rbac.authorization.k8s.io/kiali-controlplane created
rolebinding.rbac.authorization.k8s.io/kiali-controlplane created
service/kiali created
deployment.apps/kiali created
Now, navigate to Kiali Dashboard as explained in Step 5, you should be able to view clickable link as View in Grafana in Workloads > Outbound Metrics tab.

Figure 3 – Kiali Dashboard with Grafana link
After clicking on Grafana link, you will be redirected to Amazon Managed Grafana Dashboard (Istio Workload Dashboard) which looks like below:

Figure 4 – Amazon Managed Grafana Dashboard (Request Volume, Request Duration)
You can view the same Istio metrics on both Kiali dashboard (below) as well as Amazon Managed Grafana. You notice that Request Volume around 0.75-1 ops/sec and Request Duration (Percentile 50) around 3ms.

Figure 5 – Kiali Dashboard (Request Count, p50)
For example, from Kiali Workloads dashboard your Grafana link will take you to ‘Istio Workload Dashboard’ and similarly Services to ‘Istio Service Dashboard’. You can view General, Inbound workloads and Outbound Services Istio metrics of workloads and services in Amazon Managed Grafana dashboard.
Recommendations for Prometheus Resource Optimization
Metric Thinning
Istio and Envoy generate a large amount of telemetry for analysis and troubleshooting. It can result in significant resources required to ingest and store the telemetry and to support queries into the data. If you use the telemetry specifically to support Kiali, you can drop unnecessary metrics and labels on the required metrics.
Applying metric_relabel_configs in Prometheus configuration should reduce the number of stored metrics by about 20% and the number of attributes stored on many remaining metrics.
Scrape Interval
The Prometheus globalScrapeInterval is a vital configuration option. The scrape interval can have a significant effect on metrics collection overhead. It affects storage for the data points and impacts query results (the more data points, the more processing and aggregation). Users should think carefully about their configured scrape interval. Note that the Istio addon for Prometheus configures it to 15s. It is suitable for demos but may be too frequent for production scenarios. The recommendation for Kiali is to set the longest interval while still providing a useful granularity. The longer the interval, the fewer data points scraped, thus reducing processing, storage, and computational overhead. But the impact on Kiali should be understood. It is essential to realize that request rates (or byte rates, message rates, etc.) require at least two data points. For Kiali to show anything useful in the graph or anywhere rates are used (many places), the minimum duration must be >= 2 x globalScrapeInterval.
Clean-up
Use the following commands to clean up the created AWS resources for this demonstration.
# Delete Amazon Managed Grafana
aws grafana delete-workspace --workspace-id $AMG_WORKSPACE_ID
# Delete Amazon Managed Prometheus
export AMP_WORKSPACE_ID=$(aws amp list-workspaces --alias observability-workshop | jq .workspaces[0].workspaceId -r)
aws amp delete-workspace --workspace-id $AMP_WORKSPACE_ID
# Uninstall ADOT Collector
kubectl delete -f ./otel-collector-prometheus.yaml
# Cleaning up bookinfo application and istio
kubectl -n bookinfo delete -f ./samples/bookinfo/networking/bookinfo-gateway.yaml
kubectl -n bookinfo delete -f ./samples/bookinfo/platform/kube/bookinfo.yaml
kubectl delete ns istio-system
# Delete EKS Cluster
eksctl delete cluster --name <YOUR_EKS_CLUSTER> --region <AWS_REGION>
Conclusion
Kiali dashboards provide visibility into Istio service mesh metrics and can be used to monitor, visualize, and validate your application. This blog post demonstrates how to set up and access the Kiali dashboard to query Istio metrics in Amazon managed Prometheus. It also shows how to integrate Kiali with Amazon Managed Grafana to build customized dashboards and visualize metrics. Best practices are provided for optimizing metric usage, including reducing the number of stored metrics and adjusting the scrape interval. Overall, the post is a step-by-step guide to using Kiali, Amazon Managed Service for Prometheus and Amazon Managed Grafana to gain visibility into Istio service mesh metrics and build effective monitoring dashboards.
To learn more AWS observability services, check out One Observability Workshop. This workshop provides hands-on experience with Amazon CloudWatch, AWS X-Ray, Amazon Managed Service for Prometheus, Amazon Managed Grafana, and AWS Distro for OpenTelemetry (ADOT).
About the authors: