AWS Cloud Operations Blog
Perform A/B testing and dark launches of your IoT applications using AWS IoT Core and Amazon CloudWatch Evidently
Update (October 2025) – After careful consideration, we have made the decision to discontinue CloudWatch Evidently, effective 10/17/2025. For full details, see the official deprecation notice.
The development of Internet of Things (IoT) applications is accelerating as companies build and maintain these applications at a faster pace to meet the needs of their customers and to continuously deliver valuable business results. In addition to scheduled updates pushed to IoT devices, feature flags allow you to activate dormant code present in your applications to incrementally release new features using a data-driven approach. For example, a manufacturer of a smart thermostat could remotely activate pre-deployed machine learning algorithms to adjust the heating automatically, and then measure their success by observing the number of manual adjustments made by human operators over a predefined experimentation timeframe.
With Amazon CloudWatch Evidently, a capability within CloudWatch, developers can incorporate experiments and feature management into their application code. Using Evidently, developers can carry out A/B testing, and perform dark launches.
This post shows how you can use Evidently with AWS IoT Core and AWS Lambda to activate a feature flag embedded in your IoT application code, measure the success of each new feature variant using controlled experiments, and use this information to launch the best performing feature variant more widely across your fleet of devices.
Solution overview
This is a fully serverless solution consisting of AWS IoT Core, Lambda and Evidently.
The design uses a pub-sub model based on the lightweight MQTT protocol for frontend integration with IoT devices. This approach maximizes interoperability and abstracts the feature management capabilities provided by Evidently. The AWS IoT Core device shadow service is used to store device state, and house the current (reported) and expected (desired) feature flag statuses in the cloud.
Once the solution is deployed, Evidently is used to run experiments and launches.
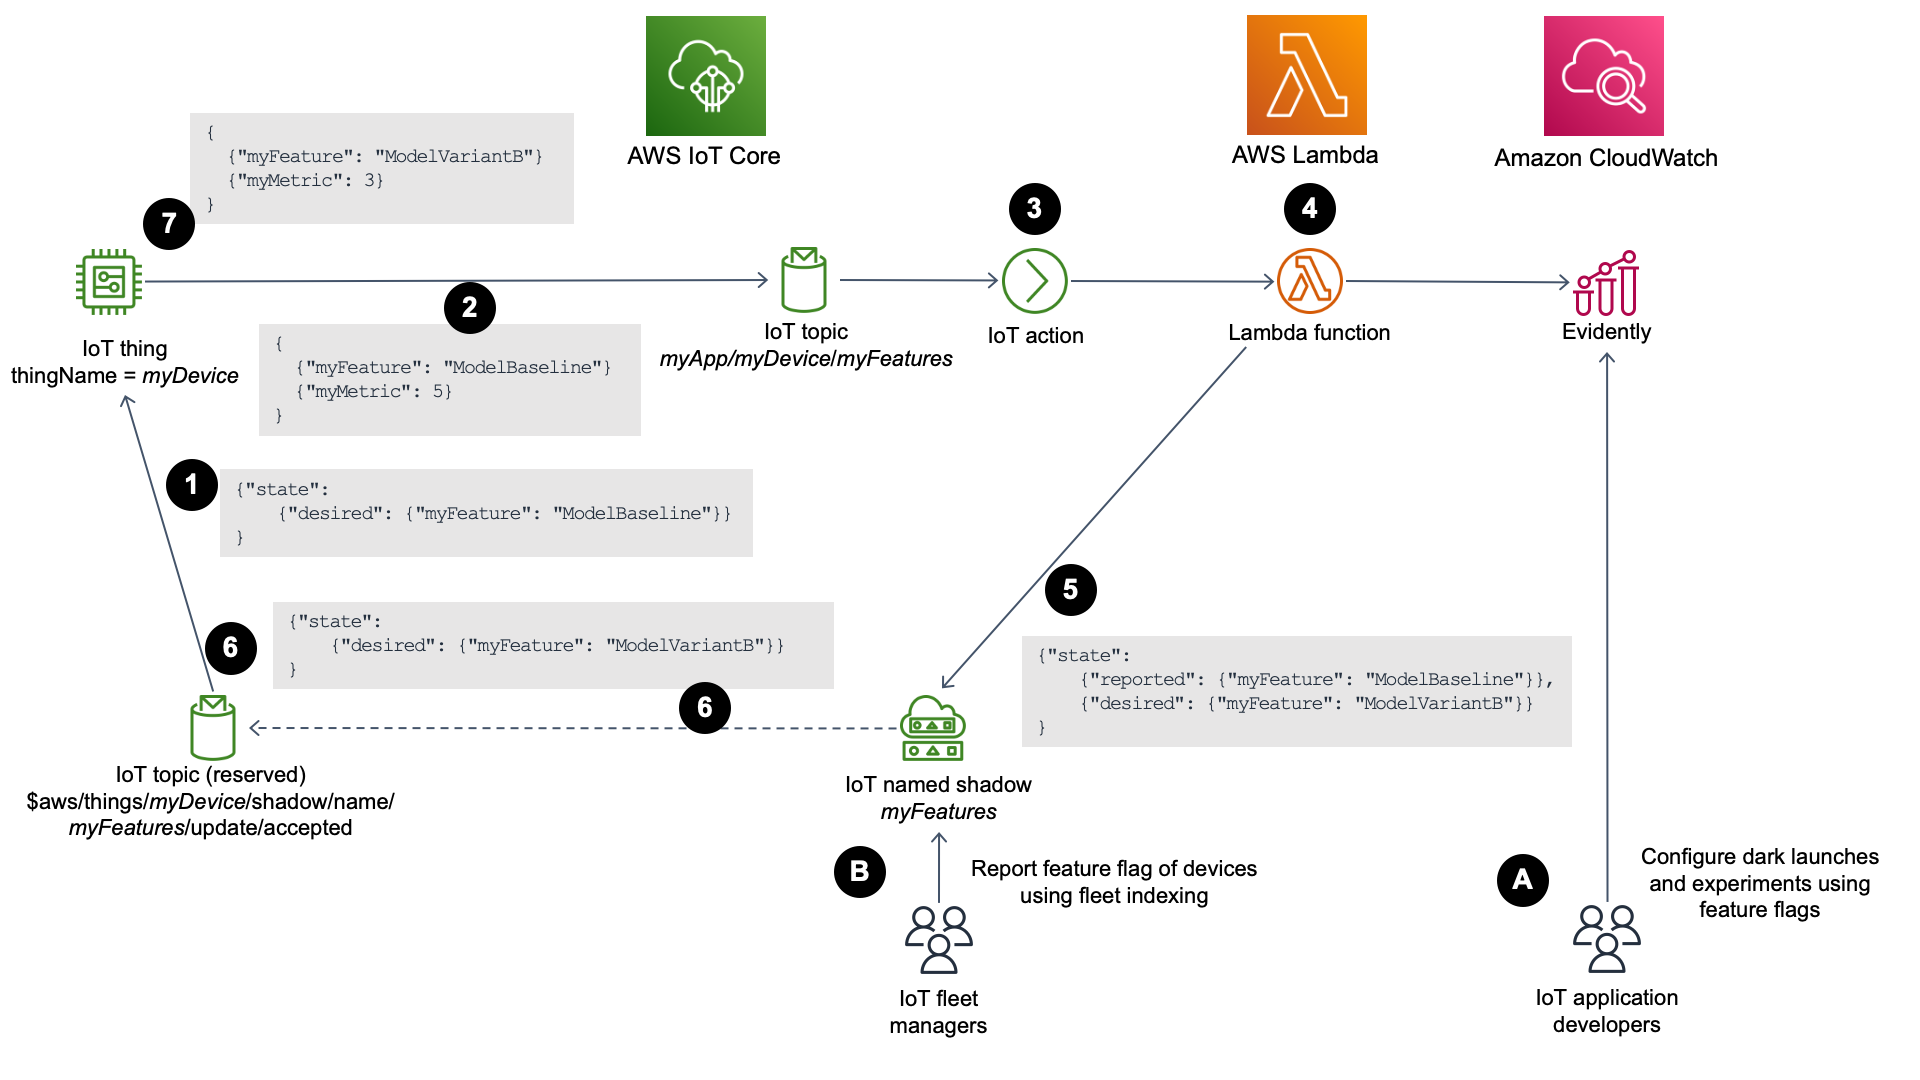
Figure 1: Solution architecture
The solution is aimed at the following personas:
- IoT application developers develop and release new features. Their objective is to ensure that their code delivers business value. IoT application developers are looking for answers to questions such as “which of the newly activated machine learning models successfully reduces the number of human adjustments made on the smart thermostat over the past 24 hours and therefore leads to a better customer experience?”
- IoT fleet managers monitor technical characteristics of IoT devices. They gather operational insights into the deployed devices, including their current firmware versions and feature sets. IoT fleet managers are looking for answers to questions such as “which smart thermostats owned by our customers have a specific machine learning feature currently activated?”
How the solution works
- An AWS IoT Core device (
myDevice) subscribes to an AWS IoT Core reserved topic ($aws/things/myDevice/shadow/name/myFeatures/update/accepted) so that it is actively notified of successful updates made to the device’s named shadow (myFeatures). This mechanism instructs the IoT device of its desired feature flag status through the lightweight MQTT protocol. - The device periodically publishes a message to an AWS IoT Core topic (
myApp/myDevice/myFeatures). This MQTT telemetry payload in JSON format consists of the current feature flag status (myFeature) and a custom metric (myMetric). The custom metric is a key performance indicator (KPI) for the feature. For example, with a smart thermostat, a meaningful KPI we could monitor and aim to drive down would be the number of manual human adjustments made over the past 24 hours. Depending on the objectives of the release, the KPIs could track multiple other measurable characteristics, such as battery drain rate, user satisfaction score, or average daily use. - Every message published to this topic invokes a Lambda function through a configured AWS IoT Core rule and corresponding action.
- The Lambda function calls the Evidently
EvaluateFeatureAPI, using the device’s thing name (myDevice) as theentityId. This returns the device’s desired feature flag, determined by the Evidently service. The function also uses thePutProjectEventsAPI to submit the custom metric for use in an Evidently experiment. Evidently encrypts data at rest by default using AWS owned keys. Refer to How CloudWatch Evidently collects and stores data to learn how Evidently secures metadata about projects, features, launches and experiments, as well as metric events and evaluation data. - The Lambda function also updates the device’s JSON named shadow object in AWS IoT Core to reflect the
reportedanddesiredfeature flag values. - After the successful update of the device’s named shadow, a new message is automatically published to the reserved topic by AWS IoT Core (
$aws/things/myDevice/shadow/name/myFeatures/update/accepted). This is received by the device through its subscription. - The device stores the desired feature flag value and activates the local code associated with the feature using a conditional statement.
The solution leverages two MQTT topics to carry out the integration between AWS IoT Core devices, and Evidently:
| MQTT topic | MQTT action by device | Description |
|---|---|---|
| myApp/myDevice/myFeatures | Publish | Topic used by the device to publish telemetry information. |
| $aws/things/myDevice/shadow/name/myFeatures/update/accepted | Subscribe | Reserved topic used by the device to subscribe to AWS IoT Core device shadow updates. |
Note: The naming convention for the MQTT topics has been chosen to simplify the demonstration of the concepts outlined in this blog. Refer to the Designing MQTT Topics for AWS IoT Core Whitepaper to learn how to name your MQTT topics in accordance with best practices.
The personas will interact with the solution using the following mechanisms:
- IoT application developers will create an Evidently project, feature and experiment. After starting the experiment, they can monitor its performance using custom metrics and make informed decisions about its effectiveness through A/B testing. Once satisfied with the results, they can launch the chosen feature across the device fleet in a controlled manner.
- AWS IoT Core fleet indexing is configured by IoT fleet managers to index and query the named shadows. This is done to create reports of the
reportedfeature flag values of the IoT devices.
Deploying the solution
An AWS CloudFormation template has been provided to deploy all AWS resources required by this solution. The template also provisions a single AWS IoT Core device so that you can manually simulate its interaction with Evidently.
Prerequisites
For this walkthrough, you should have the following prerequisites in place:
- An AWS account
- AWS IAM permissions to deploy the AWS resources using the CloudFormation template
- If you want to test this solution using your own IoT devices, you will be required to provision them separately using AWS IoT Core
Deploying the AWS CloudFormation template
To deploy the AWS IoT Core and Evidently environment described in this solution, we have provided a CloudFormation template which can be downloaded from our repository. This file should be downloaded to your local machine and deployed using CloudFormation.
Navigate to the CloudFormation service in the AWS Console and from the Stacks page select Create stack – With new resources (standard). Once the Create stack page is shown, verify that the AWS Region selected is where you want to deploy your resources. In addition, verify that all services leveraged by this solution are available in your chosen AWS Region. Service availability can be confirmed by reviewing the AWS Regional Services document. AWS Regional availability of the CloudWatch Evidently feature is listed in the Perform launches and A/B experiments with CloudWatch Evidently section of the Amazon CloudWatch User Guide.
Keep the Prerequisite – Prepare template setting as Template is ready. In the Specify template section select the Upload a template file radio button and then select Choose file. In the file browser select the template that you just downloaded and select Next.
On the Specify stack details page provide a unique Stack name (such as myIoTApp) and then update the default values for the parameters where necessary:
thingName(default:myDevice) – the naming suffix of the AWS IoT Core devicevariantModelBaseline(default:ModelBaseline) – the name of the baseline model used within EvidentlyvariantModelVariantA(default:ModelVariantA) – the name of the first model variant used within EvidentlyvariantModelVariantB(default:ModelVariantB) – the name of the second model variant used within Evidently
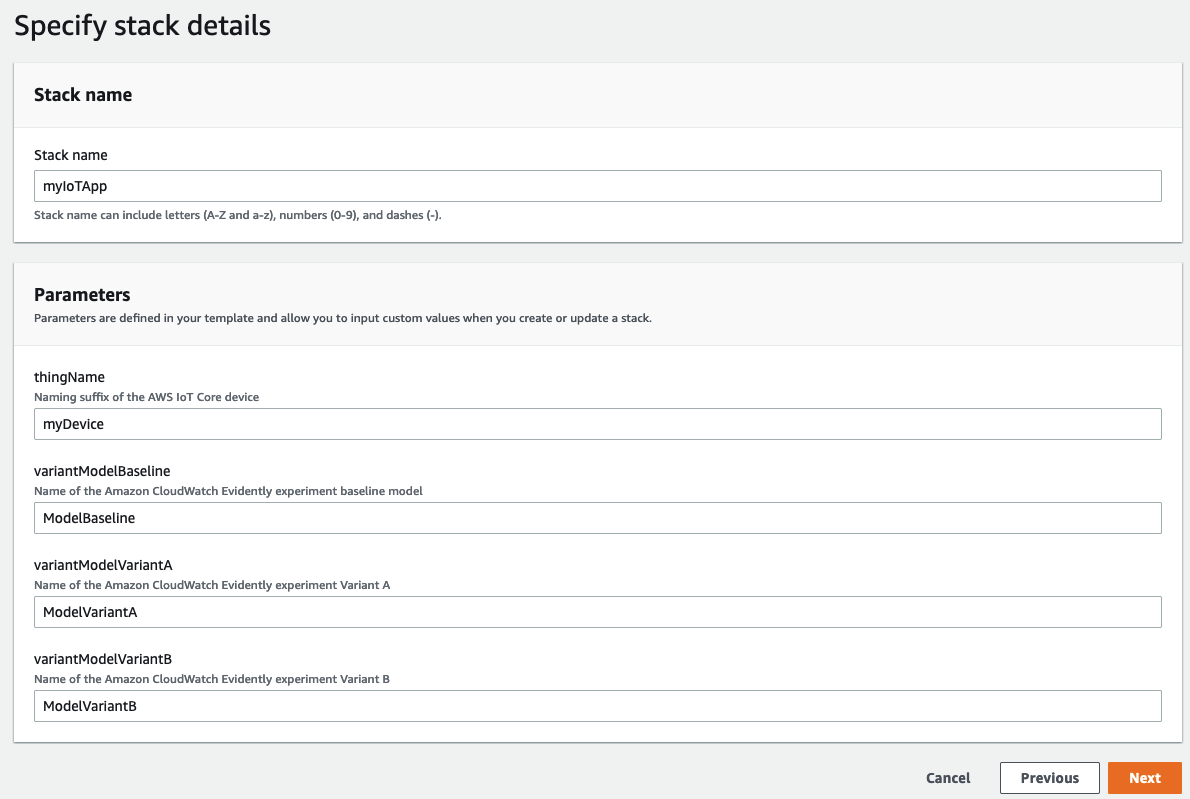
Figure 2: Specifying CloudFormation stack details
Once you have populated the Parameters fields select Next.
On the Configure stack option page leave the default values and select Next.
On the Review page verify the information displayed and then select the I acknowledge that AWS CloudFormation might create IAM resources with custom names checkbox at the bottom of the page and select Submit.
Once the CloudFormation stack has a status of CREATE_COMPLETE it has been fully deployed. The Outputs tab will include the following values that are required for testing. The stack creation will take approximately 3 minutes.
outputPublishToThisTopic([Stack name]/[Stack name]-EvidentlyIoT-[thingName]/myFeatures) – MQTT topic for this test device to subscribe to.outputSubscribeToThisTopic($aws/things/[Stack name]-EvidentlyIoT-[thingName]/shadow/name/myFeatures/update/accepted) – Reserved MQTT topic for the test device’s named shadow which the device will subscribe to. AWS IoT Core publishes a JSON response state document to this topic when it accepts a change to the device’s named shadow.outputThingName([Stack name]-EvidentlyIoT-[thingName]) – Thing name prefix used for devices. This is also the name of the test device.
Other values displayed in the CloudFormation stack’s Outputs section are used later by the optional load generator environment. The steps to deploy the load generator stack are described later in this post.
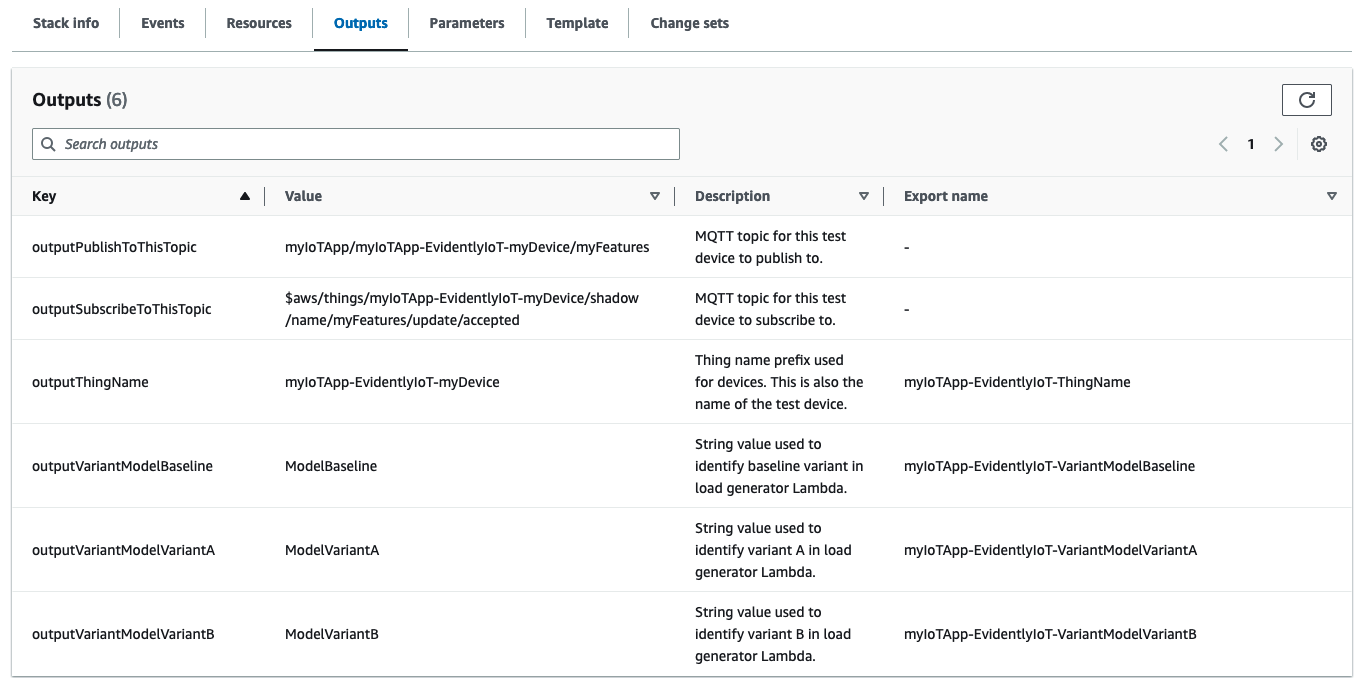
Figure 3: Reviewing the CloudFormation stack output
Interacting with the solution using a single test device
The MQTT test client in AWS IoT Core will be used to simulate a single IoT device’s interaction with the solution.
Navigate to the AWS IoT Core homepage in the AWS Console and select Test > MQTT test client from the left menu. In the Topic filter text box of the Subscribe to a topic tab, enter the value from the outputSubscribeToThisTopic CloudFormation output and then select Subscribe. You should now see your subscription in the Subscriptions list.
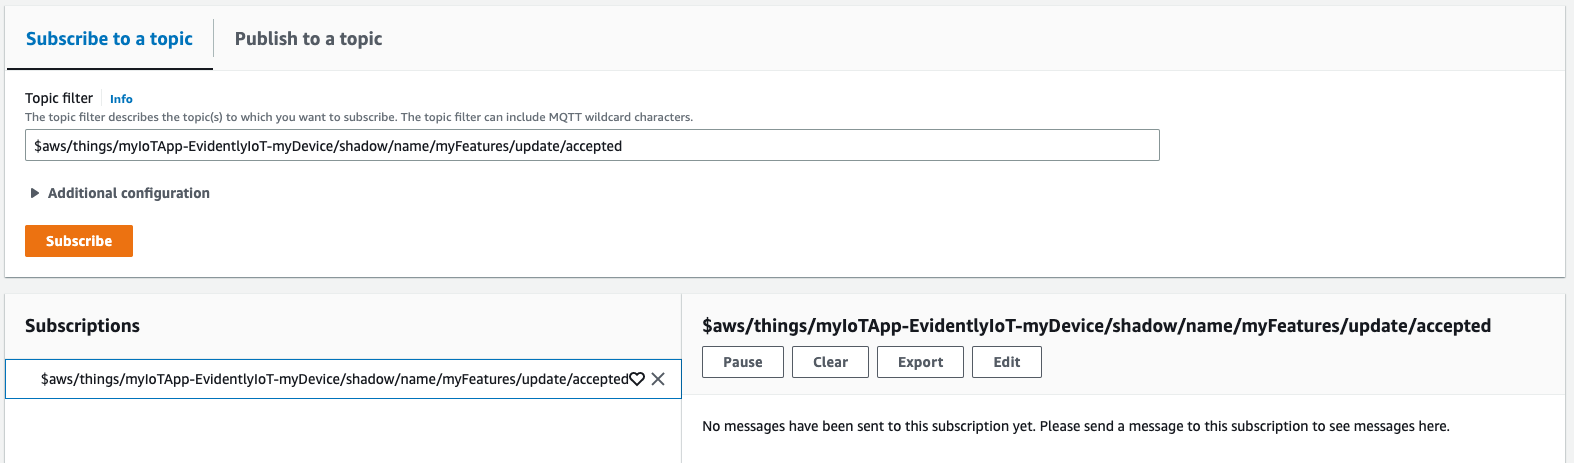
Figure 4: Subscribing to a topic
Navigate to the Publish to a topic tab, and in the Topic name text box, enter the value from the outputPublishToThisTopic CloudFormation output.
To simulate the publishing of a payload to the telemetry topic, the message should contain both myFeature and myMetric key-value pairs. An example payload is shown below.
{
    "myFeature": "ModelBaseline",
    "myMetric": 5
}
Enter this JSON payload into the Message payload text box and then select Publish.
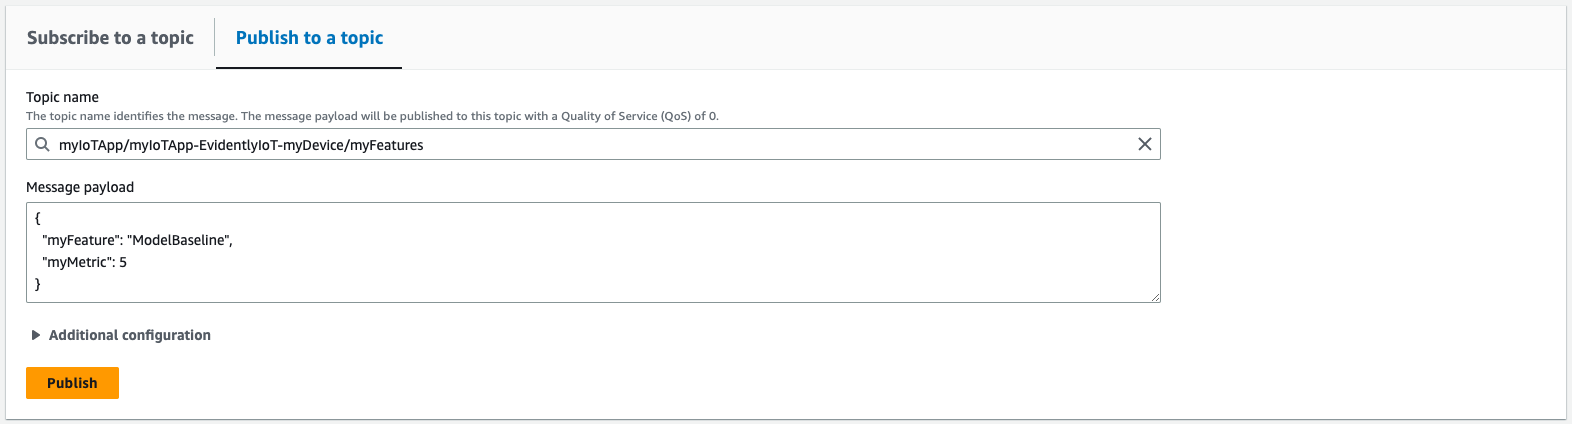
Figure 5: Simulating publishing of a payload to the telemetry topic
In this example, the myFeature value simulates the device reporting which feature is currently in use, while the myMetric value is used to report the custom metric.
The MQTT test client will return the contents of the named shadow’s JSON shadow document.
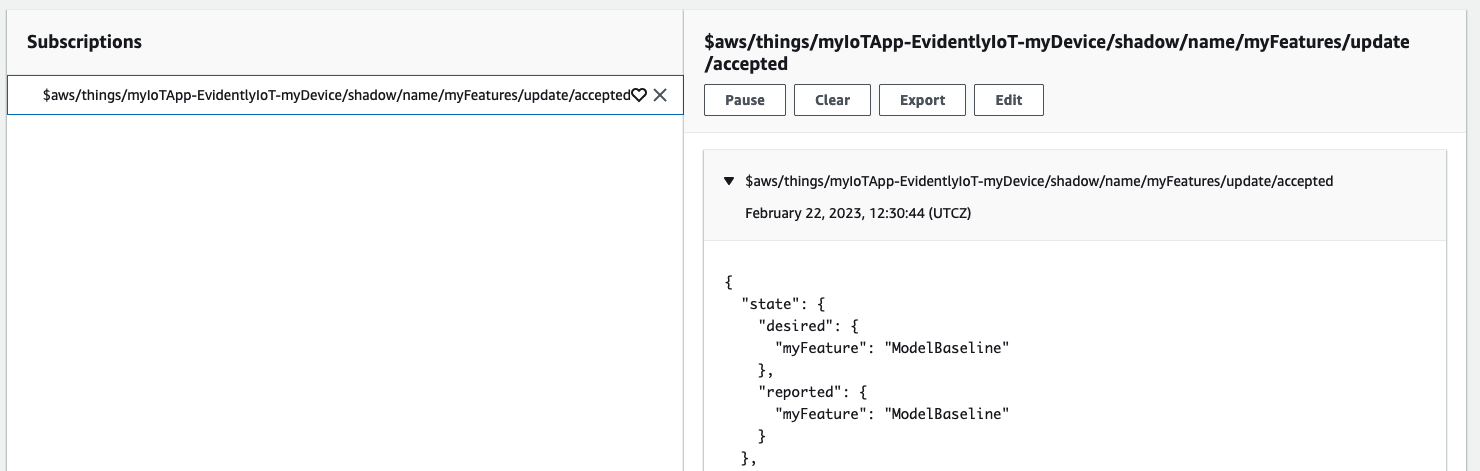
Figure 6: Named shadow contents
The desired value in the response is the feature flag that Evidently has allocated to this AWS IoT Core device. This will always be the default variant until the Evidently experiment starts. The reported value will match the value published previously through the Message payload during the test.
Device-side handling of feature information
In a real-life IoT application running on a device, its code would be required to process the received ["desired"]["myFeature"] key-value to enact the logic required to activate the feature.
Example device-side code is shown below:
if state["desired"]["myFeature"] == "ModelBaseline":
    print("This is my Baseline code!")
    # TODO: Baseline Model routine
elif state["desired"]["myFeature"] == "ModelVariantA":
    print("This is my Model Variant A code!")
    # TODO: Model Variant A routine
elif state["desired"]["myFeature"] == "ModelVariantB":
    print("This is my Model Variant B code!")
    # TODO: Model Variant B routine
    # TODO: Code to publish the myFeature value back as telemetry with the reported value
Running the Amazon CloudWatch Evidently experiment
The CloudFormation template created an Evidently project which already has the feature and experiment configured. The experiment initially has a status of Created. For Evidently to start allocating feature variants the Experiment must be started.
To start the experiment, first navigate to CloudWatch > Application monitoring > Evidently in the AWS Console. Under Projects you will see the project that has been created for you with the name [Stack name]-myEvidentlyProject. Select the project name to be taken to the Project page.
Select the Experiments tab, where you will see the experiment that has been created for you with the name [Stack name]-myEvidentlyExperiment. Select the experiment name to be taken to the Experiment page. Now select the Start experiment option under the Actions menu to start your experiment.
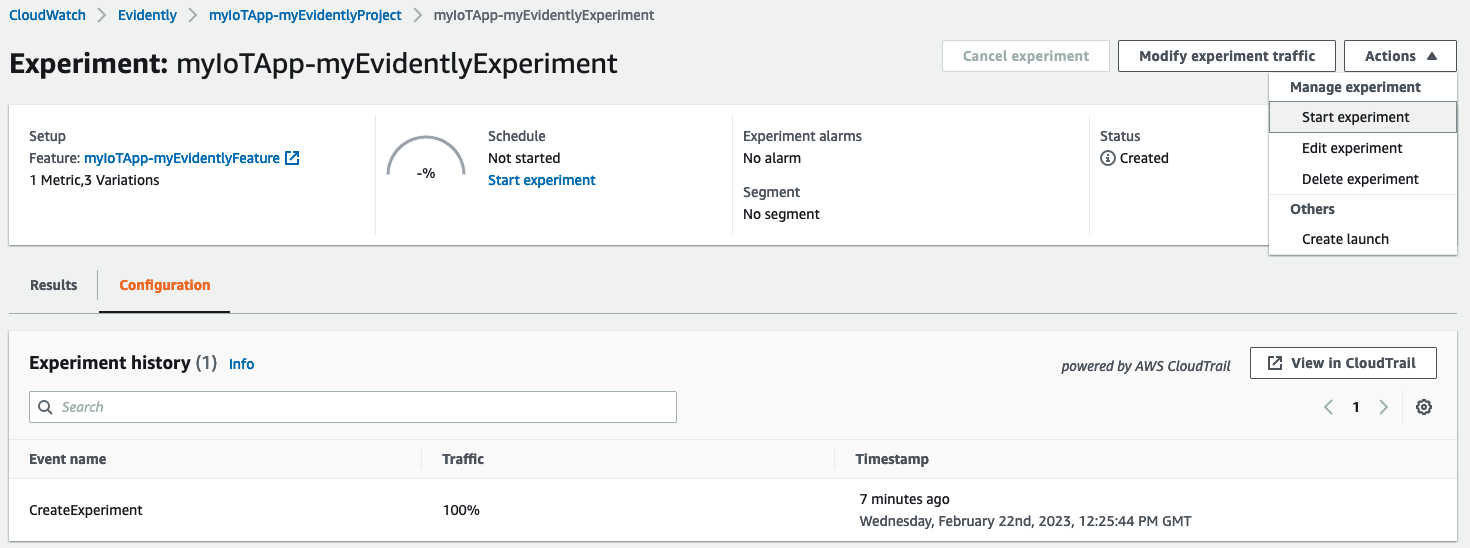
Figure 7: Starting the Evidently experiment
Here, you can define an end date for the experiment. In this example, we have decided to run the experiment over 4 days with a view to going live with the best performing feature afterwards.
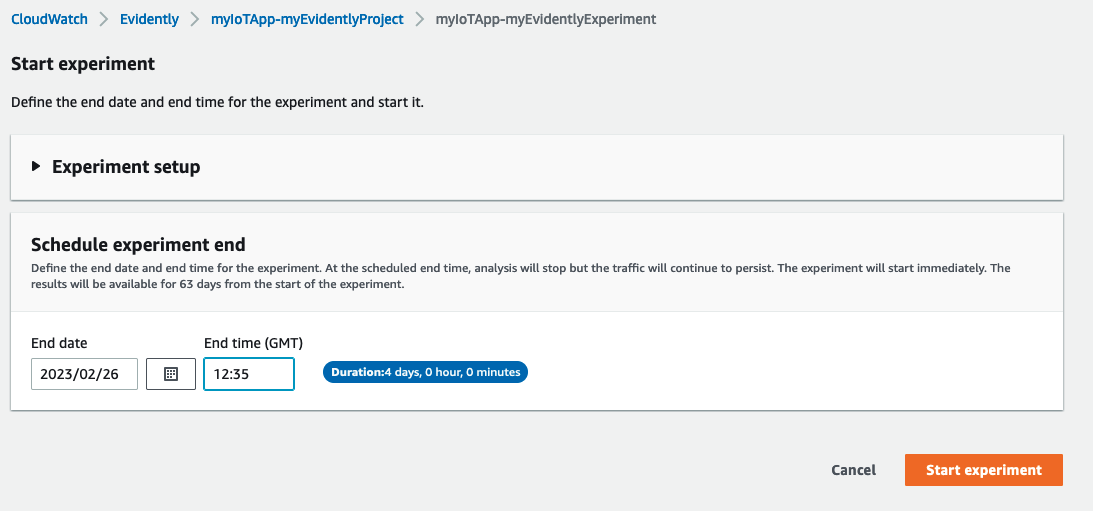
Figure 8: Setting the Evidently experiment schedule end date
Deploying the load generator
To allow you to view meaningful results from a simulated experiment, we have provided a separate load generator solution that provisions 50 AWS IoT Core things.
The template for the load generator can be downloaded from our repository and identical steps should be taken to the previous stack deployment to upload the file ready for deployment.
On the Specify stack details page, provide a unique name for you stack (such as myIoTAppLoadGen). The template will request 2 parameters which will be used to create the CloudFormation stack and configure the resources:
deviceCount(default:50) – the number of devices expected by the load generator Lambda function. Note that the provided CloudFormation template always creates 50 AWS IoT device objects but the Lambda code will only generate load for the number of devices specified in this parameter.loadInterval(default:1) – the frequency in minutes that the load generator Lambda function is invoked. For real-life IoT use cases, this value may be higher to reflect less frequent exchanges of information about the device’s feature flag.stackName– the name of the CloudFormation stack deployed earlier which houses your AWS IoT Core and Evidently solution. This is used to find resources created by the previous stack.
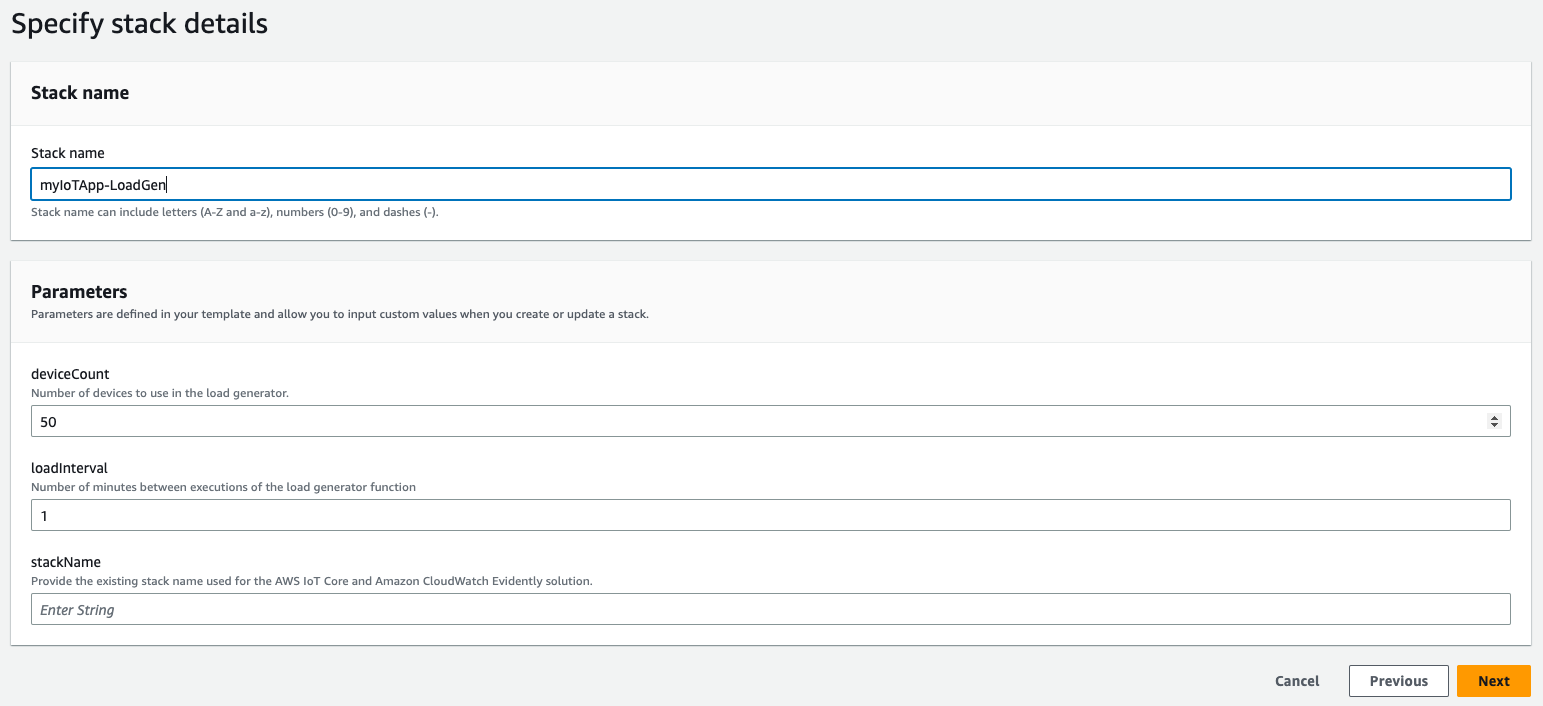
Figure 9: Inputting CloudFormation stack load generator parameters
Follow identical steps that were taken during the previous stack deployment to initiate the stack deployment. The deployment takes approximately 3 minutes to reach the status of CREATE_COMPLETE.
Using the load generator
The deployed CloudFormation stack has an Amazon EventBridge schedule that triggers a Lambda function to execute at the frequency entered in the loadInterval parameter (by default every 1 minute). As Lambda functions are stateless and short-lived, this code simulates device behavior by interacting directly with the AWS IoT Core service using the AWS SDK over HTTPS, and not using MQTT. The function also emits arbitrary metrics from ranges centered on baselines of 5 (baseline model), 8 (model A) and 3 (model B) to replicate how the device might respond to the activation of the 2 machine learning model variants. These values were chosen to intentionally demonstrate better and worse performing variants during the experiment.
To view the results of your experiment, navigate back to the experiment in Evidently, and select the Results tab. This page may take up to the number of minutes specified in the loadInterval parameter to populate as we wait for the EventBridge rule to trigger. If you are still not seeing any results, make sure that the time frame in the top right corner of the page is set to a range that covers your experiment.
You will notice that not all columns in the table or graphs are fully populated initially. For these statistical calculations to be populated, at least 100 events need to have been recorded by Evidently for all variations. It will take approximately 7 executions of the load generator Lambda function for the statistical values to be populated. This will be approximately 8 minutes with the default for the loadInterval parameter.
Below is an example of what the experiment results look like when these 50 devices are configured to interact with the solution over 4 days.
Evidently has concluded that ModelVariantB is better performing, and therefore is better suited for wider adoption.
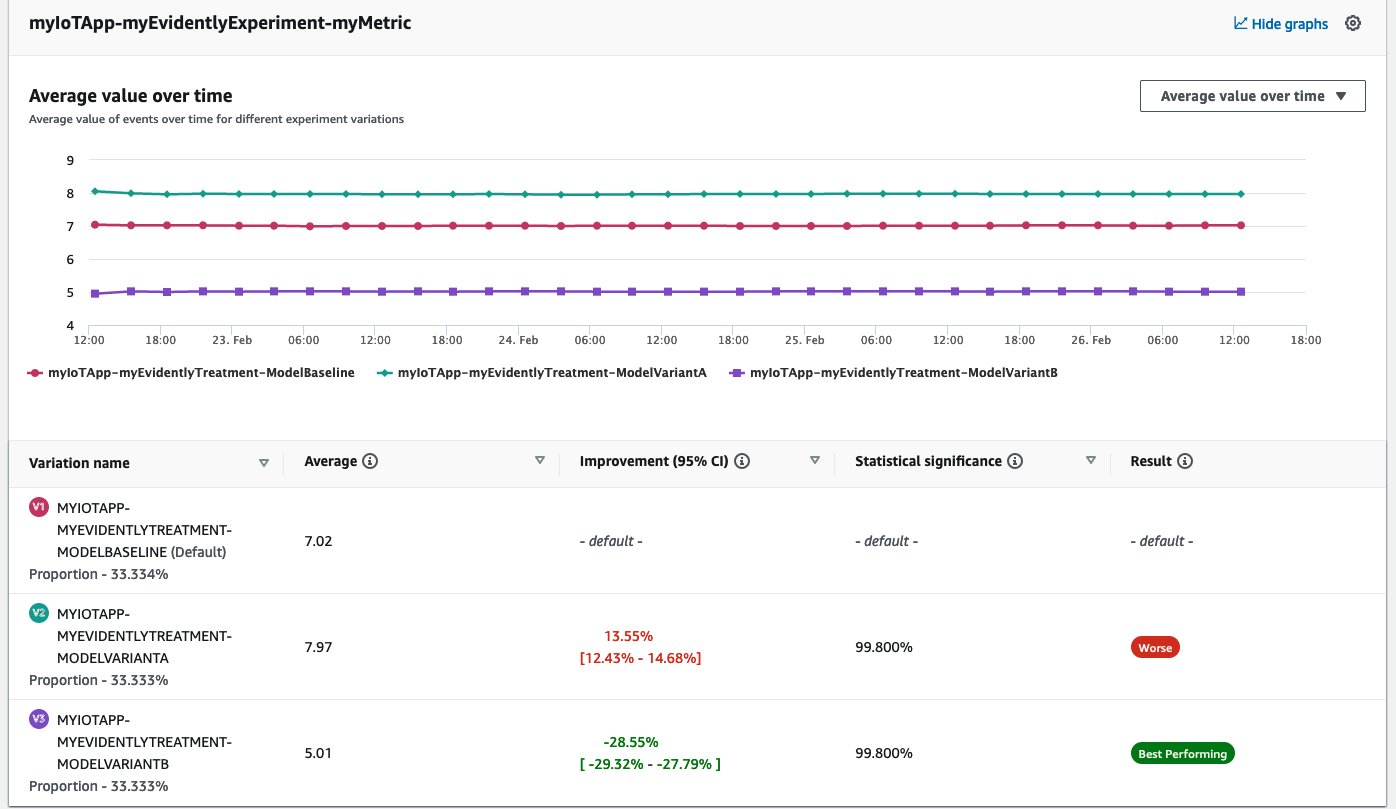
Figure 10: Reviewing Evidently experiment results
We are now ready to launch the project with ModelVariantB.
Launching the feature
As an IoT application developer, once you are happy with the experiment, you can launch the most successful variant to make it permanently live.
Before launching a feature, check that your experiment has completed or that running experiments have been cancelled. This is required to ensure that the experiment and launch do not interfere with one another.
To launch a feature, first navigate to Evidently and select your project ([Stack name]-myEvidentlyProject) from the list of projects. Once in the Project page, select the Launches tab. Select the Create launch button. The Create feature launch page will be displayed.
In the Launch name text box, give your launch a name (such as myIoTApp-myEvidentlyLaunch), and optionally provide a description. Make sure the Select from existing features option is chosen and that the required feature ([Stack name]-myEvidentlyFeature) is selected from the Feature name drop down.
In our example we would like to launch the feature in 5 steps to incrementally shift all of our devices to the best performing feature at 4-hour intervals. If you would like to see the results of the launch more quickly, then reduce the increment between the steps described below from 4 hours to a duration appropriate for your testing.
In the Launch configuration section, select the Schedule launch option. Under Schedule step 1 enter a Step Date and Step Time in the future, then in the Traffic percentage allocate 100% of the traffic to the ModelBaseline variant. Disable the Exclude selector for the ModelVariantA variant, and then allocate 0% of the traffic to the ModelVariantB variant.
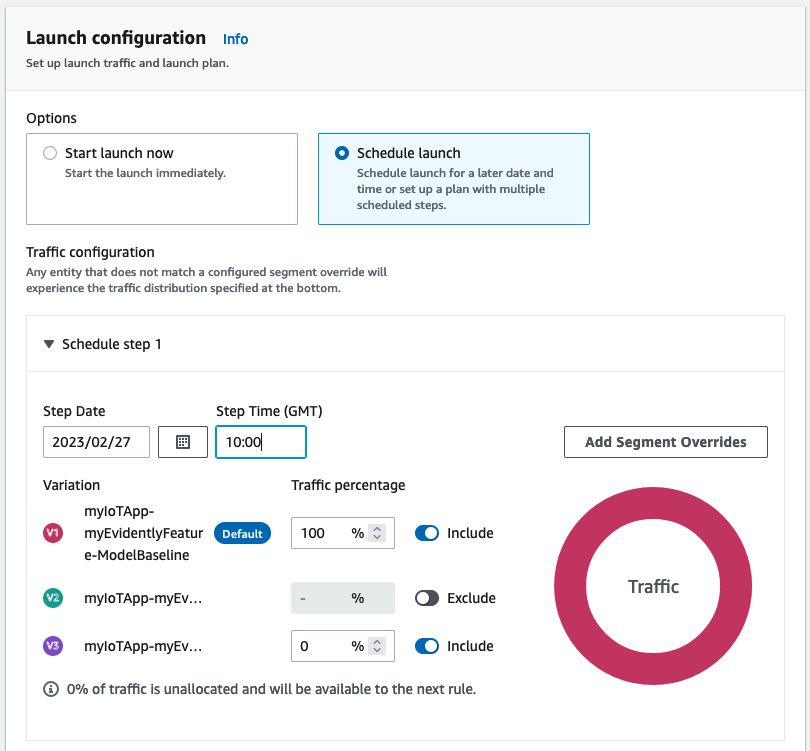
Figure 10: Setting up first Evidently launch step
Select the Add another step button and repeat the above steps by incrementally adding 4 hours to the Step Date and Step Time, reducing the ModelBaseline Traffic percentage by 25% and increasing the ModelVariantB Traffic percentage by 25%. Repeat these steps 4 more times until all of the expected traffic has been allocated to ModelVariantB.
Select the Create launch button.
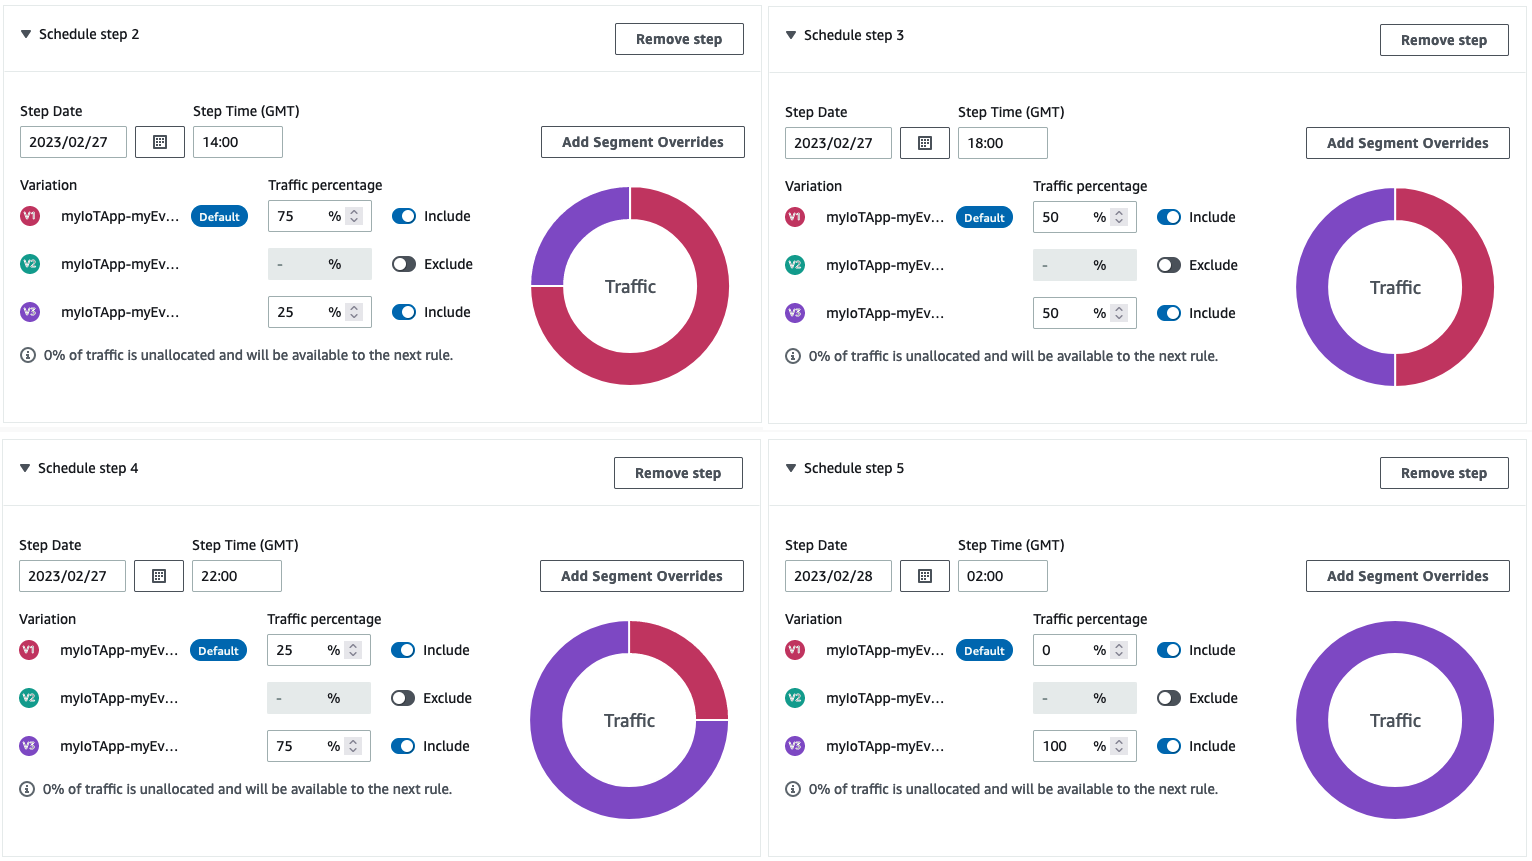
Figure 11: Configuring steps for the Evidently launch
From the Launches tab, select the name of the launch that has just been created. This page will show the history of the launch, along with the steps that are scheduled to run in the future:
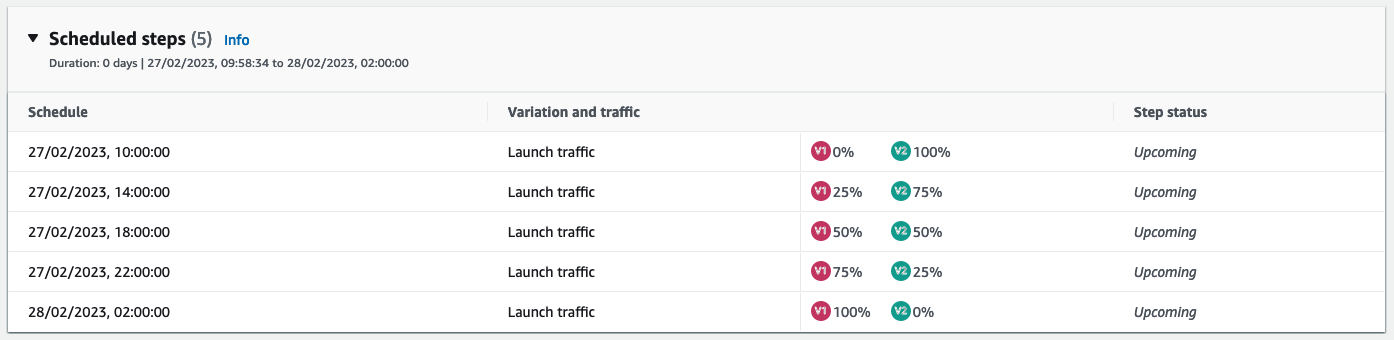
Figure 12: Reviewing the Evidently launch configuration steps
As the launch progresses, the devices will be succesfully migrated over the 16-hour period, resulting in the feature flag being enabled across all of your devices.
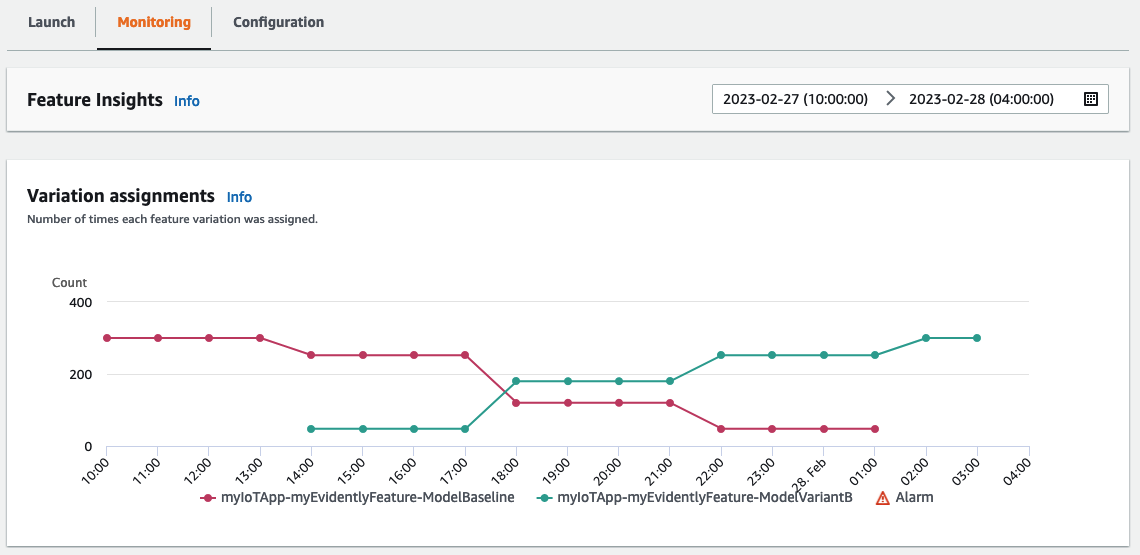
Figure 13: Monitoring an Evidently launch
Identifying devices’ feature flags using AWS IoT Core fleet indexing
As an IoT fleet manager, you can use AWS IoT Core fleet indexing to query the attributes found in the myFeatures named shadow.
AWS IoT Core fleet indexing is a feature used to index, search, and aggregate your devices’ data from multiple sources including device shadows. AWS IoT Core fleet indexing can also be used to create dynamic thing groups, allowing certain AWS IoT Core functionality such as jobs and reporting to target devices with only the specific feature flag enabled. For example, you may want to target firmware updates only at devices that have a particular feature flag set.
In order to use this feature in AWS IoT Core, you will need to turn on thing indexing for your named shadow. To do this, first navigate to the AWS IoT Core Console and then select Settings in the menu on the left. Scroll down to the Fleet indexing section and select Manage indexing.
Enable fleet indexing by selecting the switch at the top right of the page so the label reads Activated. Now select the Add named shadows tick box, then select Add shadow names. Enter myFeatures in the Shadow names text box and select Add. Finally select Update at the bottom of the page.
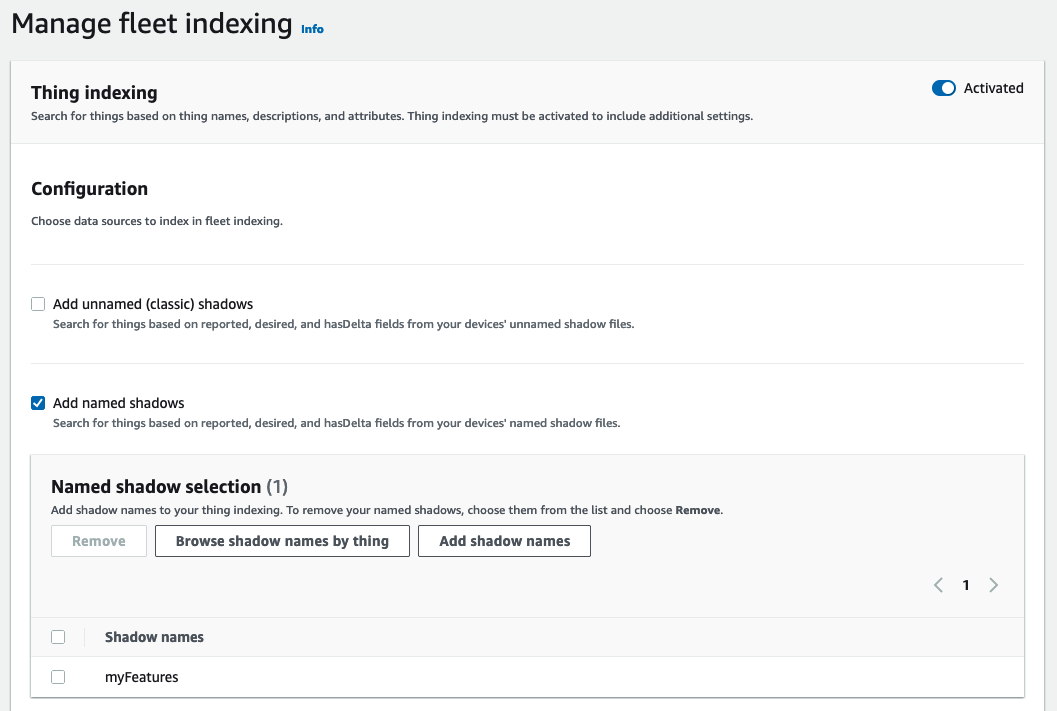
Figure 15: Turning on AWS IoT Core fleet indexing
Once fleet indexing for the myFeatures named shadow has been enabled, it is possible to run advanced thing searches to produce custom reporting based on the feature flag reported.myFeature attribute.
To simulate an advance thing search from within the AWS IoT Console navigate to Manage > All devices and then Things from the menu on the left. Select the Advanced search button on the Things page. In the Query box enter:
shadow.name.myFeatures.reported.myFeature: "ModelVariantB"
Then select Search. This query can be saved for future use by using the Save query button.
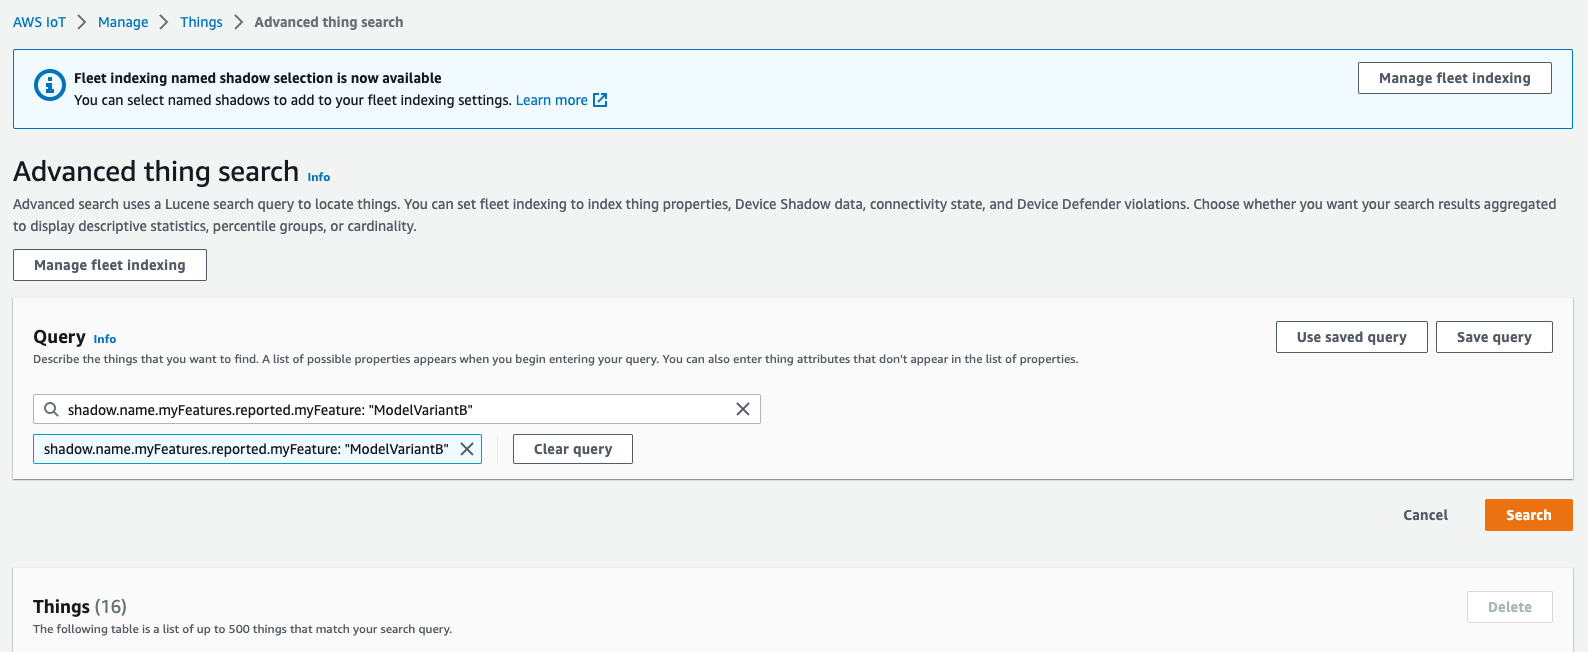
Figure 16: Performing an AWS IoT Core advanced thing search
The above screenshot shows an advanced thing search being made while the experiment was running. The query returns 16 devices that have had the feature flag set to ModelVariantB, which is approximately a third of the total number of devices. If the advanced thing search was performed after the completion of a launch, all the devices would be returned by this query.
Cleaning up
To avoid incurring future charges, delete the CloudFormation stacks that have been provisioned. If you have a running Evidently experiment or launch, you will need to stop these manually otherwise the stack deletion will fail.
Conclusion
This post demonstrated how Evidently can be used with AWS IoT Core and Lambda to activate a feature flag embedded in your IoT application, measure the impact of the new feature using controlled experiments, and use this information to launch the feature more widely across your fleet of devices.
About the authors: