AWS Cloud Operations Blog
Simplifying Apache server logs with Amazon CloudWatch Logs Insights
Simplifying Apache server logs with Amazon CloudWatch Logs Insights Monitoring web server logs is important for diagnosing problems, understanding the root causes, and spotting potential security-relevant activity on your web server. The Apache HTTP Server log format is not easily readable, though. The volume and size of these text-based logs makes it difficult to see patterns in the logs or to search for specific items of interest. It is difficult to understand the distribution of errors (more or less over time), see an increase of traffic from certain IP address, or see an unusual increase of requests into our application.
Introducing Amazon CloudWatch Logs Insights
Amazon CloudWatch Logs Insights enables you to interactively search and analyze your log data in Amazon CloudWatch Logs. CloudWatch Logs Insights automatically discovers log fields for any logs stored in JSON format. This simplifies tasks like analyzing webpage traffic, searching for traces of DDoS attacks, or querying the number of unique users visit your application daily.
To take advantage of the discoverability of JSON fields that CloudWatch Log Insights provides, you must change the default configuration of your Apache HTTP Server to format the logs in JSON format. The log agent then publishes the JSON format log file to CloudWatch Logs.
After you have the Apache HTTP Server logs stored in CloudWatch Logs in JSON format, you can use CloudWatch Log Insights to discover all fields without needing to write a parser. However, if you choose not to use JSON format or have a different log source, you can still use your logs in CloudWatch Log Insights. For more information, see CloudWatch Logs Insights Query Syntax.
Combining Amazon CloudWatch Agent and Apache HTTP Server
This post outlines the following steps:
1. Create and configure an Amazon EC2 instance.
2. Install the CloudWatch Agent.
3. Create the CloudWatch Agent configuration file.
4. Configure Apache HTTP Server.
Prerequisites
To follow along with the process outlined in this post, you need a copy of Apache HTTP Server and an Amazon CloudWatch account.
Step 1:
Create and configure an EC2 instance
To try out CloudWatch Logs Insights, we need to have a web server that is generating logs. If you want to do this on a server you already have, skip to Step 2: Installing the CloudWatch Agent. If you want to set up a test web server so that you can try this out, follow the instructions in our Tutorial: Install a LAMP Web Server on Amazon Linux 2.
Step 2:
Install the CloudWatch Agent
You can install the unified CloudWatch Agent via the command line with an Amazon S3 download link, AWS Systems Manager, or an AWS CloudFormation template. To install the CloudWatch Agent, follow the instructions below:
1. Download and configure the CloudWatch Agent
2. Create the IAM role for the CloudWatch Agent
3. Attach the role to your EC2 instance
Step 3:
Create the CloudWatch Agent configuration file
After following the CloudWatch Agent installation instructions in the previous step, you can create the configuration file using the agent configuration file wizard with the following command:
sudo /opt/aws/amazon-cloudwatch-agent/bin/amazon-cloudwatch-agent-config-wizard
Accept all the default choices until the wizard prompts you to select which user are you planning to run the agent. Select option 2. Cwagent.
When the wizard asks you if you want to monitor metrics from CollectD, select 1. Yes only if you have already installed CollectD.
Continue accepting the default choices until it prompts you for a value for Log file path.

Specify the following values:
- Log file path: /var/log/www/error/*
- Log group name: apache/error
- Log stream name: [{instance_id}]
When the wizard prompts for additional log files to monitor, choose 1. Yes. and specify the following values:
- Log file path: /var/log/www/access/*
- Log group name: apache/access
- Log stream name: [{instance_id}]
You can also add additional log files. Choose 2. No after you are finished adding any additional log files.
When the wizard prompts you to store the configuration in AWS Systems Manager Parameter Store, choose 2. No to utilize both Systems Manager and Parameter Store to centralize installation and configuration at bulk of the CloudWatch Agent using Systems Manager. Choose 1. Yes. to centralize the storage of the configuration file using Systems Manager. For more information about the IAM roles and policies required, see Create IAM Roles and Users for Use with the CloudWatch Agent.
Step 4:
Configure Apache HTTP Server
Run the following command to open the Apache HTTP Server configuration file:
sudo nano /etc/httpd/conf/httpd.conf
Browse the file to the log section, shown in the following screenshot.

Your Apache HTTP Server configuration only logs messages with the “warn” flag in the default format. The default format also enables and saves access HTTP Server logs.
Modify the following line to include the /var/log/www/error/error_log destination:
ErrorLog "logs/error_log"
Below the LogLevel warn line, paste this new format for the log:
ErrorLogFormat "{\"time\":\"%{%usec_frac}t\", \"function\" : \"[%-m:%l]\",
\"process\" : \"[pid%P]\" , \"message\" : \"%M\"}"
The default Apache log file format is space-separated data with one line per request. There is no native support for JSON in Apache, but with some clever formatting we can make the single line into valid JSON syntax. To do so, you can add the new LogFormat line:
LogFormat "{ \"time\":\"%{%Y-%m-%d}tT%{%T}t.%{msec_frac}tZ\", \"process\":\"%D\",
\"filename\":\"%f\", \"remoteIP\":\"%a\", \"host\":\"%V\", \"request\":\"%U\",
\"query\":\"%q\",\"method\":\"%m\", \"status\":\"%>s\",
\"userAgent\":\"%{User-agent}i\",\"referer\":\"%{Referer}i\"}" cloudwatch
Change the following access log location to logs/access/access_log:
CustomLog "/var/log/www/access/access_log" cloudwatch

Confirm your changes and exit the editor by pressing CTRL and X.
Your new configuration file includes folders to upload and logs:
- /var/log/www/error
- /var/log/www/access
By adding the second CustomLog row, you are informing the Apache HTTP server to create a second output file for access requests in a location, /var/log/www/access, using “cloudwatch” LogFormat that utilizes JSON syntax.
Those folders don’t exist yet, and the Apache HTTP Server service daemon does not start until you create the folders. To create them, run the following commands:
sudo mkdir /var/log/www/
sudo mkdir /var/log/www/error/var/log/www/access
Restart the Apache HTTP Server service to use the new configuration:
sudo systemctl restart httpd
Tell the CloudWatch Agent to use the wizard-generated configuration file:
sudo /opt/aws/amazon-cloudwatch-agent/bin/amazon-cloudwatch-agent-ctl \
-a fetch-config -m ec2 -c file:/opt/aws/amazon-cloudwatch-agent/bin/config.json -s
Now start the CloudWatch Agent:
sudo systemctl start amazon-cloudwatch-agent.service
To make sure the CloudWatch Agent starts at boot time, run the following command:
sudo systemctl enable amazon-cloudwatch-agent.service
Now do the same for the Apache HTTP server service:
sudo systemctl enable httpd
Using CloudWatch Logs Insights
The operations that you just performed enable the CloudWatch Agent to create two log groups, apache/error and apache/access. If you don’t see these log groups, see Troubleshooting the CloudWatch Agent.
To populate the logs with data for analysis, you will need to generate traffic to your website. You can achieve this using a free website traffic tool like Scrapy to generate requests programmatically.
In the AWS Management Console, choose CloudWatch, Log Groups.

Inside each log group, you can find a log stream with a name of the InstanceID receiving your server logs.

The log stream stores your server logs in a JSON-compatible standard, thanks to the changes that you made to your Apache configuration.
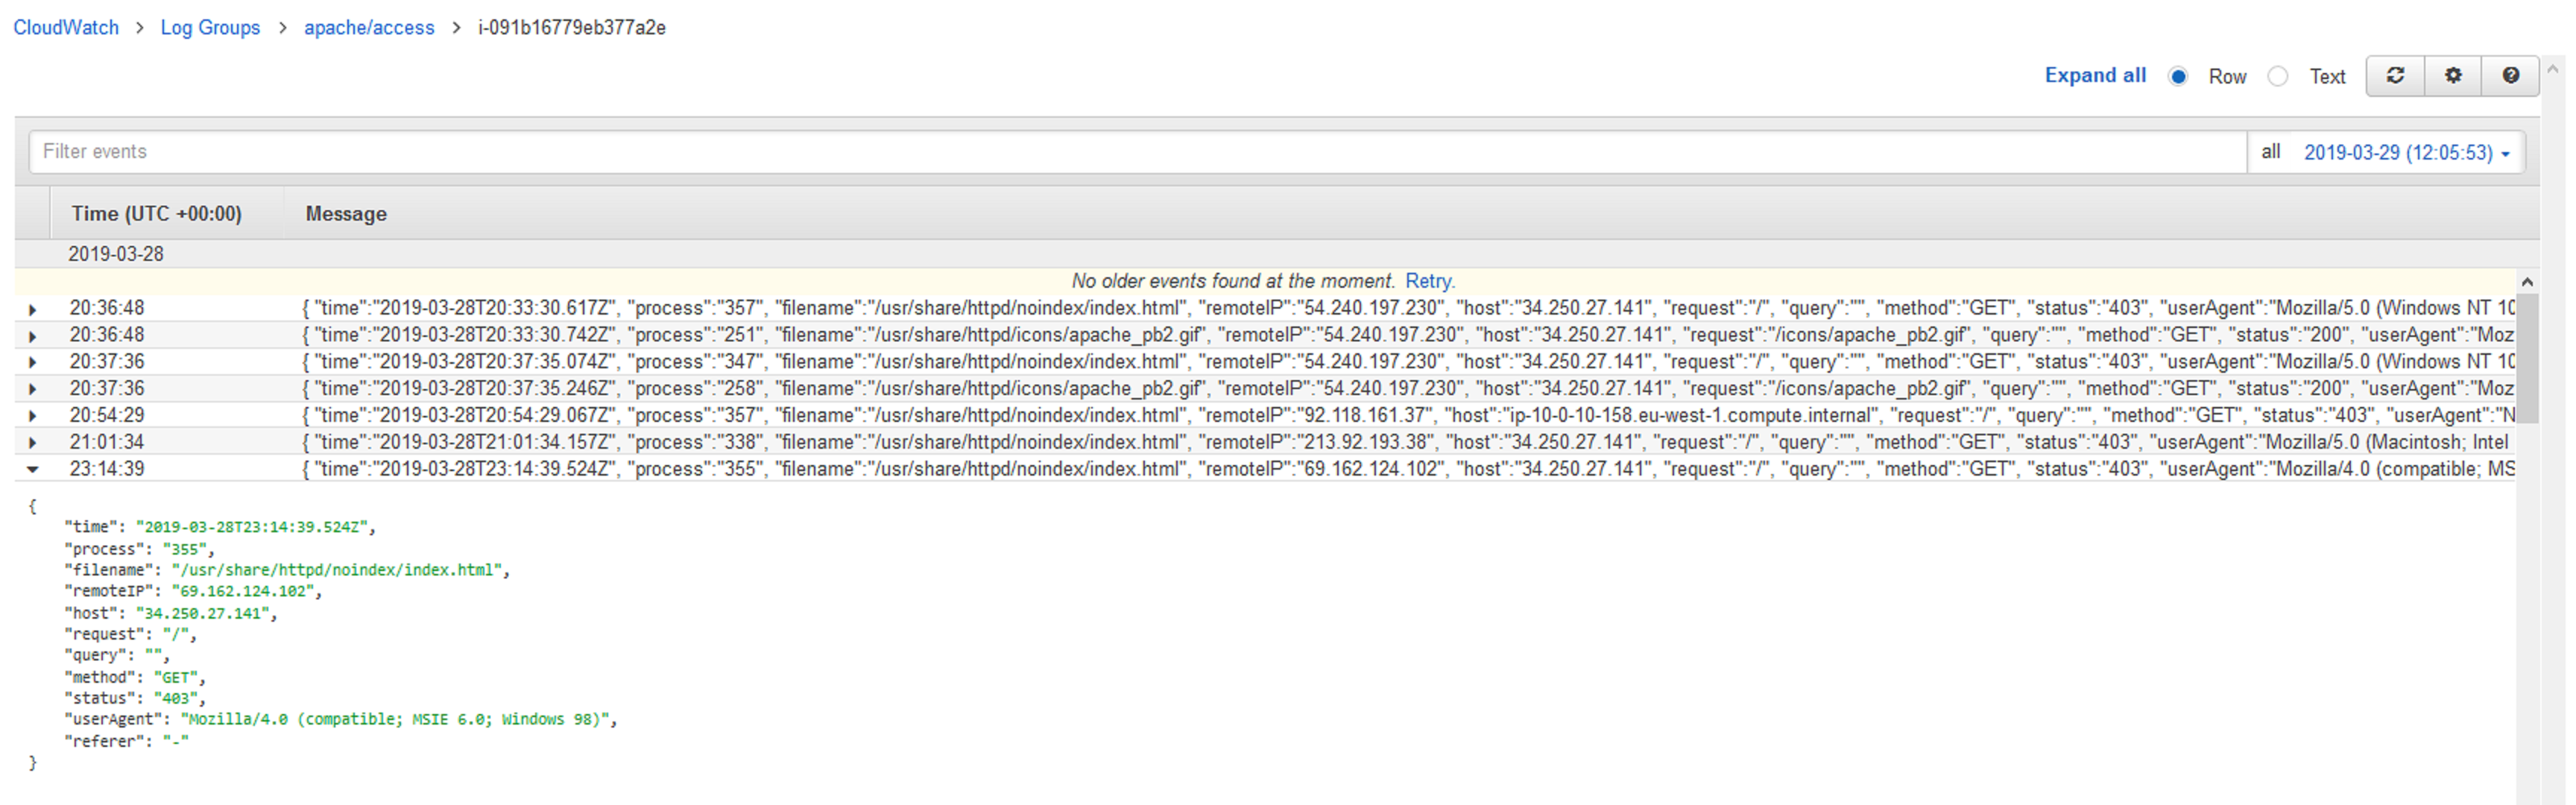
Open one of the log groups in CloudWatch Logs Insights. On the left navigation pane, under Logs, choose Insights.
In the top search bar, select one of the Apache HTTP server log groups that you configured, for example, the apache/logs log group. Initially, you may see only the @timestamp and @logStream fields in the Discovered fields tab. As soon as you select the apache/logs log group, an additional list of discovered fields populates the right-side pane as CloudWatch Logs Insights automatically identifies them.
Select the apache/access log group so Insights can detect JSON log fields automatically. Review the Discovered fields tab to see the new fields appear.

Under Log Group, you can write your own queries. To view the results, choose Run query.
CloudWatch Logs Insights includes a purpose-built query language with a few simple but powerful commands. In addition to a purpose-built query language, CloudWatch Logs Insights also provides sample queries, command descriptions, query auto-completion, and log field discovery to help you get started quickly.
The following queries may produce different results based on the traffic to your Apache HTTP server.
As an example, to review your access logs, check for traffic to the /admin path of your application. The most relevant fields for this are the timestamp, caller IP, specific request, status of the response, and filename that a caller requests.
The query to call these fields looks like the following:
fields @timestamp, remoteIP, request, status, filename| sort @timestamp desc|
filter filename="/var/www/html/admin"| limit 20

In this example, your query returns some suspicious activity. Some of the listed basic resources are not public. You might conclude that someone is scanning your website. To investigate, you can count how many requests each caller made.
Call up this information with the following query:
fields @timestamp, remoteIP,request, status, filename| filter filename="/var/www/html/admin"|
stats count(remoteIP) as CallerIP by remoteIP|sort CallerIP desc| limit 10

The returned unfamiliar IP addresses confirm that someone is scanning your website. The information retrieved by the query helps you define security rules for your website to block unwanted IP addresses after you identify the unusual activity. You can also use AWS Web Application Firewall to block IP address access to the administrator panel.
You can now check how many unique GET requests accessed your main page, with status “200” (success):
fields @timestamp, remoteIP, method, status|
filter status="200" and referrer= http://34.250.27.141/ and method= "GET"|
stats count_distinct(remoteIP) as UniqueVisits| limit 10

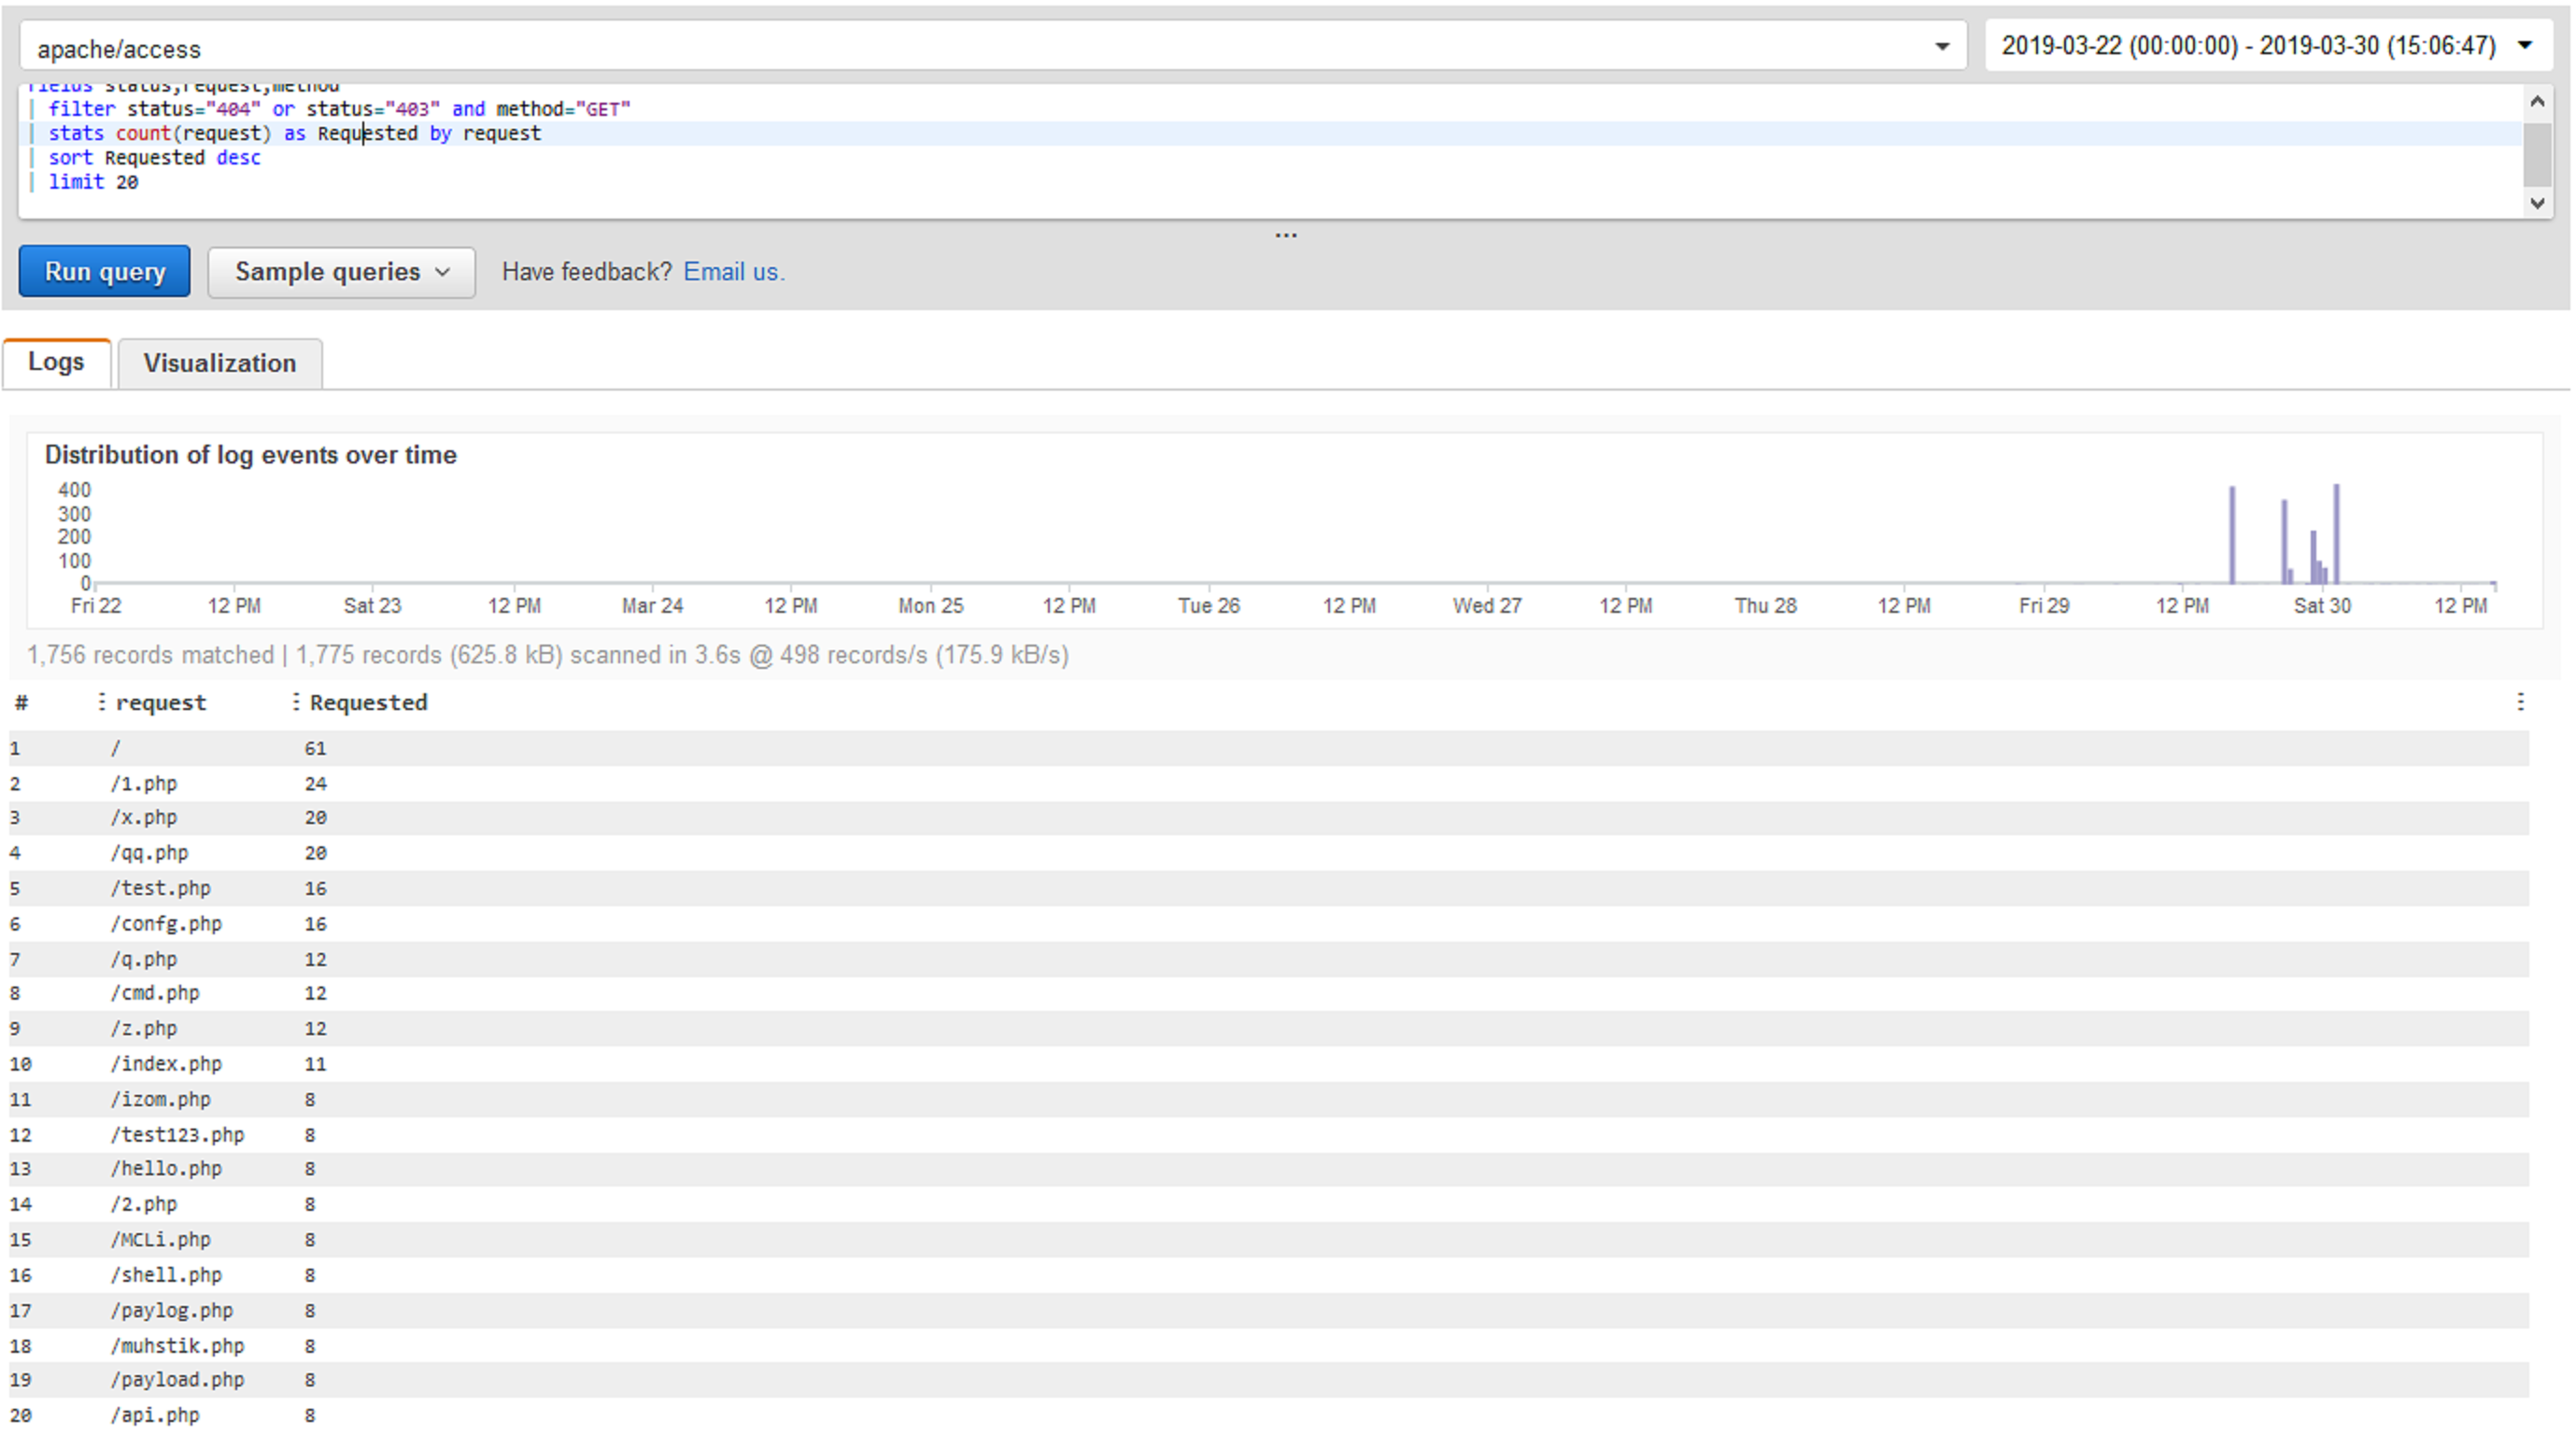
You can also check which resource web scanning bots request most frequently:
fields status, request, method| filter status="404" or status="403" and method="GET"|
stats count(request) as Requested by request| sort Requested desc| limit 20
You can change your log group to /apache/error and test something on it. For example, you can check how many times your Apache service has restarted:
fields @timestamp, function, process, message|
filter message like "resuming normal operations"| sort @timestamp desc|limit 20

Remember that the Apache HTTP server will escape Unicode characters if they appear in web requests (e.g., in the URL, the User Agent, Referer, etc.). The Unicode characters will be escaped like \xhh. That will generate invalid JSON, which means that configured parsing will not work for messages with Unicode, though the logs will still be present. Cloudwatch Logs Insights for these messages revert to the default schema with @timestamp and @message, allowing you to write a parser to extract the data in order. It is worth remembering that Unicode characters in requests may be indicators of unusual or security-relevant activities. Sometimes, Unicode characters are used to perform code injections via URL’s. You should review those messages regularly.
To find messages that failed to parse correctly as JSON, you can filter all events that do not have a filename field:
fields @timestamp, @message, time, filename|filter time not like ""
As an output, you may see something similar to the following:

While the parsing is malformed, you can extract the content of @message with a regular expression. For more information, see CloudWatch Logs Insights Query Syntax.
Conclusion
Congratulations! You have successfully installed and configured the CloudWatch Logs Agent, and configured the Apache HTTP server to store logs in a JSON-compatible format.
Amazon CloudWatch Logs Insights allows you to search and analyze both unstructured logs and JSON logs. The simplified interface makes searching for and analyzing data straightforward. With CloudWatch Logs Insights, you can dig into the root cause of an issue easily and effectively using the unified logs format to query across a large number of instances and log data. You can also visualize your log queries results to metric graphs.
About the authors
 Piotr Pietrzkiewicz is a Solutions Architect at AWS. He is a technology enthusiast with infrastructure background. In his free time he enjoys his free time and senseless humor.