AWS Cloud Operations Blog
Use Amazon CloudWatch Contributor Insights for general analysis of NGINX logs
Customers build, deploy, and maintain millions of web applications on AWS and many customers deploy these applications using NGINX. The NGINX application server offers configurability, scalability, and the ability to handle millions of concurrent requests. Web application performance is key in modern enterprise infrastructure and applications. Customers leverage CloudWatch to monitor response times, uptime, and provide SLAs. Engineering teams also track several data points and metrics, such as server performance when traffic levels shift, and engineering teams know that subpar performance will degrade customer experience. This leads to underperformance in revenue, possibly affecting compliance, or risking operational downtime.
Customers can leverage Contributor Insights rules, a feature of Amazon CloudWatch, for web application log analysis. Customers can evaluate patterns in structured log events as they are streamed to CloudWatch Logs, including any custom logs sent by applications in the cloud or from on-premises servers, such as NGINX web server application logs. CloudWatch Contributor Insights enable product and engineering teams to view, investigate, and remediate issues that occur in web applications. Once configured, Contributor Insights runs continuously without manual intervention aiding operators isolate, diagnose, understand, and remediate issues during an operational event.
This blog will show you how to monitor and perform analysis of NGINX logs using CloudWatch Contributor Insights. NGINX logs provide visibility on web applications such as errors, response times, and performance of web applications. In addition to CloudWatch Contributor Insights, customers can then activate CloudWatch Metrics and CloudWatch Alarms for comprehensive system monitoring.
Prerequisites
For this walkthrough, you should have the following prerequisites:
- Enable NGINX server to run in an AWS account. For this example, a NodeJS web application and API will be installed, configured, and deployed using the included CloudFormation template.
- NGINX web application server running in an AWS account with web logs enabled in JSON format (see below for NGINX configuration).
Solution Overview
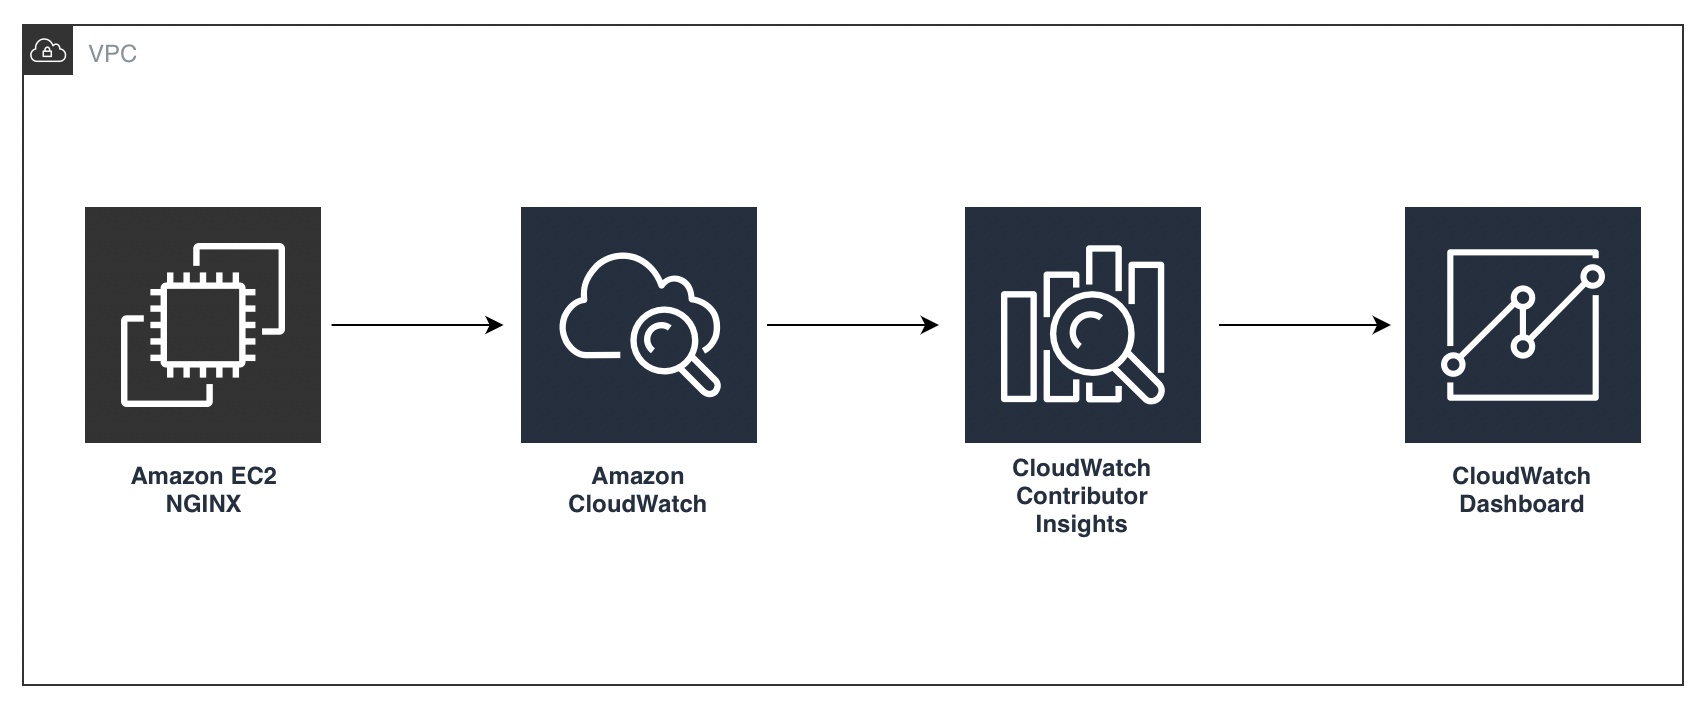
The preceding figure shows how NGINX web server application logs are sent to CloudWatch through the pre-installed CloudWatch agent on the instances. All Amazon Linux 2 AMIs include CloudWatch agent. These logs are analyzed by Contributor Insights rules and report is displayed on CloudWatch dashboard.
Walkthrough
From the AWS Management Console, navigate to CloudWatch to create a log group.
Step 1: Select Create log group.

In CloudWatch navigate to Contributor Insights. On the Contributor Insights home page, select Create a Rule.
- Select NGINX log group by name from the drop down.
- Select Custom rule for Rule type.
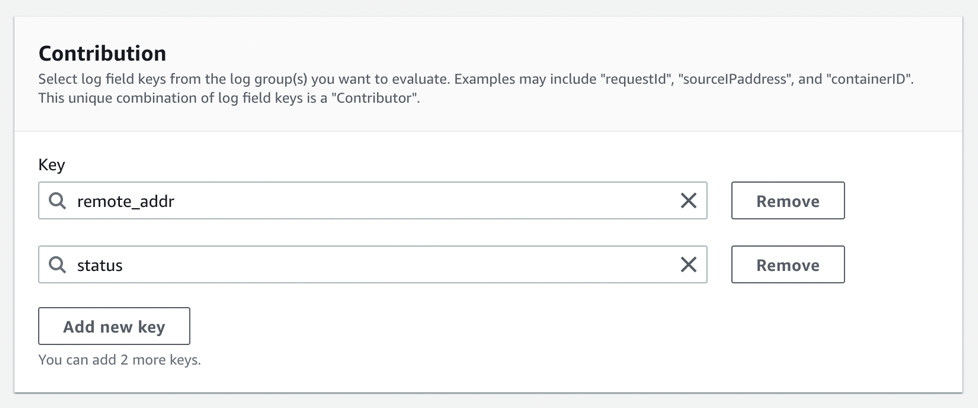
- In Contribution section – enter the unique keys ‘remote_addr’ and ‘status’ to extract remote address of the request and the status of the request. These will be visualized in the CloudWatch dashboard.
- Give Rule name.
- Select Create.


Once you create a rule, it may take up to 5 minutes before you see any data being reported. At this point, let’s deploy the CloudFormation Stack that will create an EC2 Instance running NGINX and a Node Express Web Application w/ two API endpoints to simulate a web application and API example.
Step 2: Deploy the following CFT template:
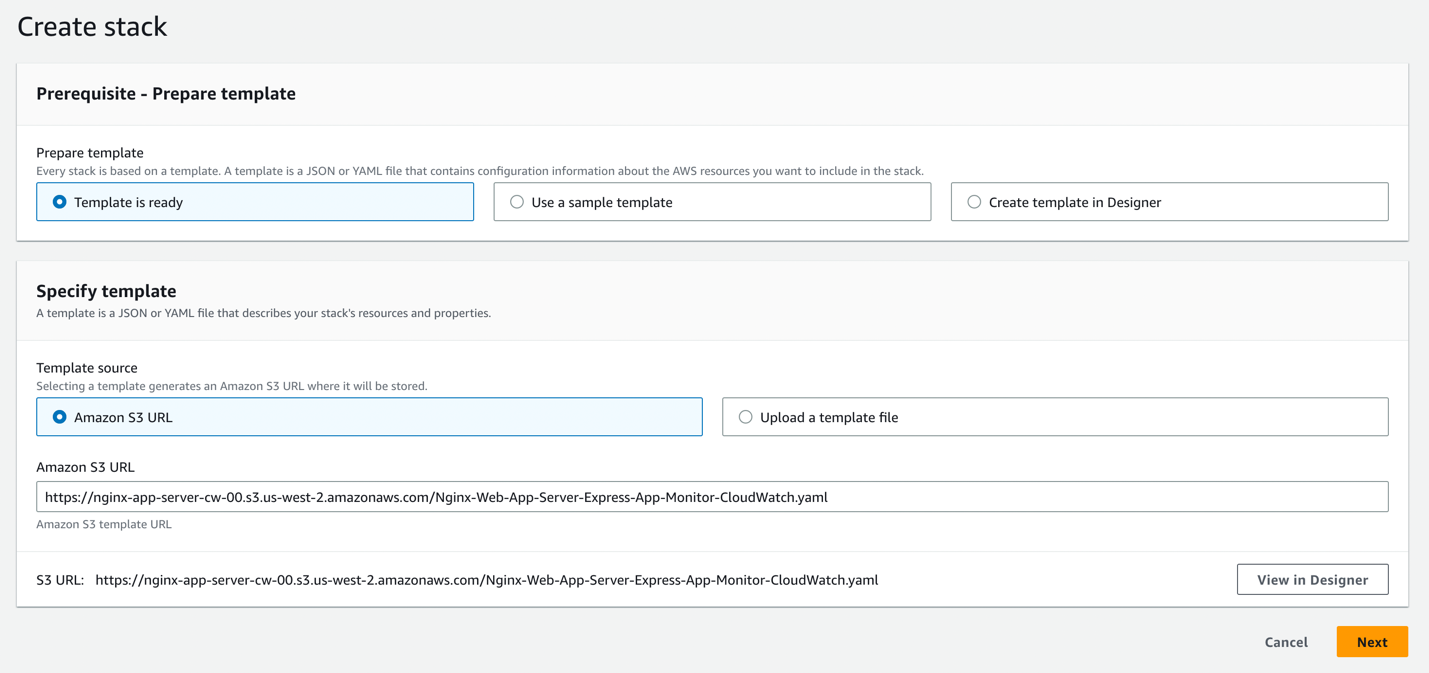
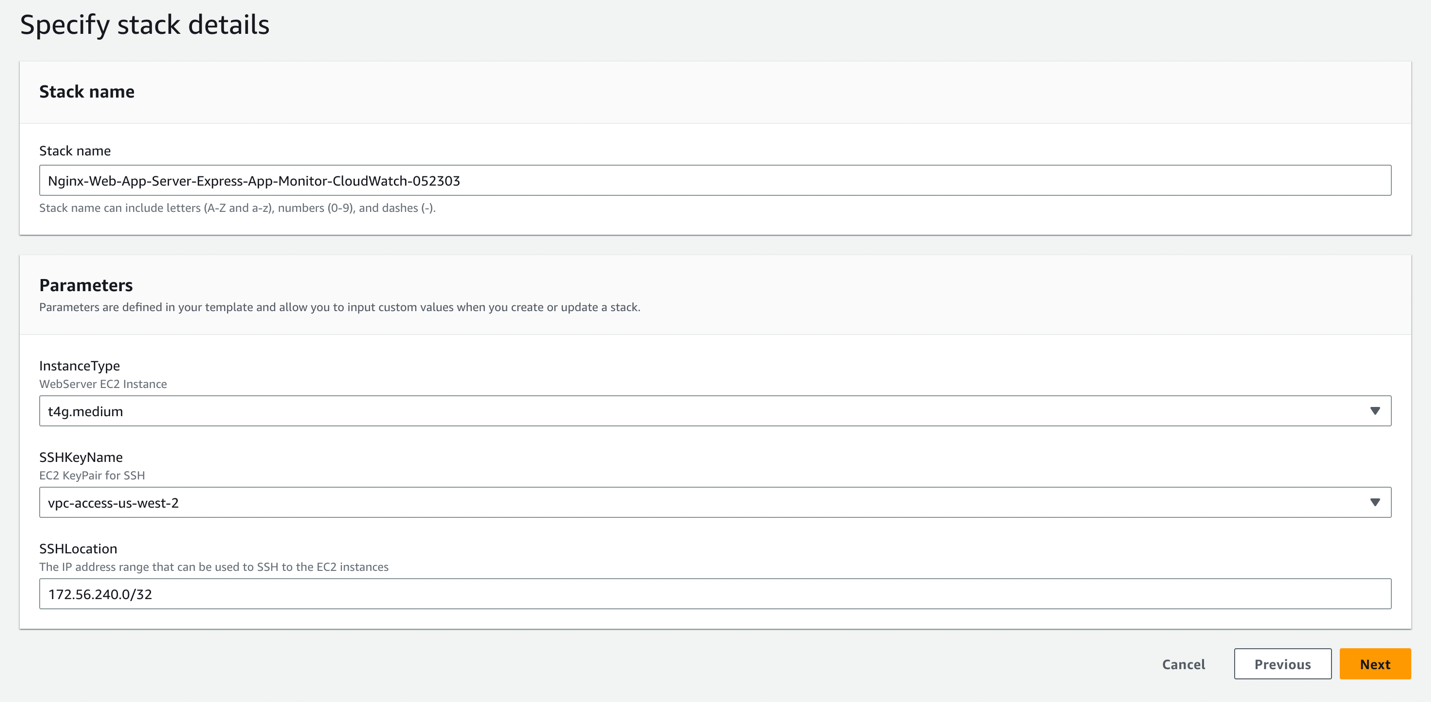
This will take 5–10 minutes. You can view the status of the deployment.
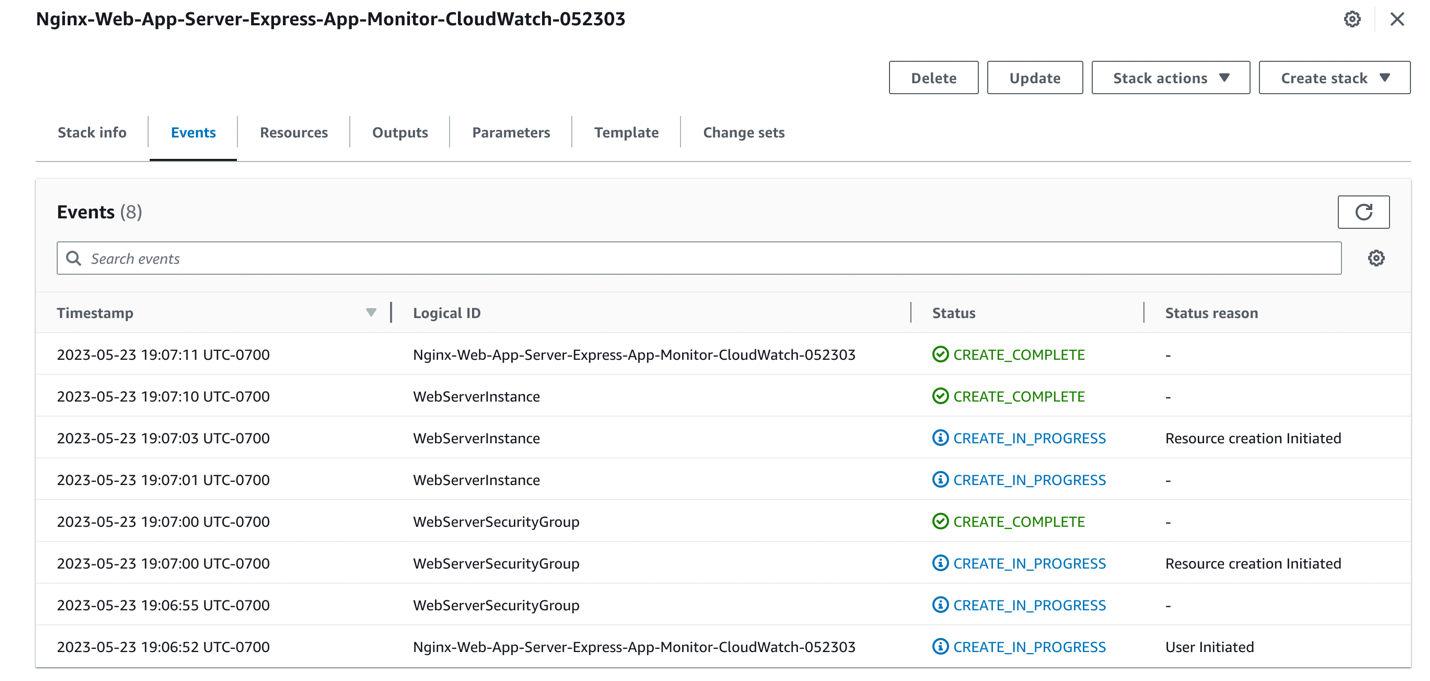
Once the stack is deployed check the outputs tab for the NGINX URL:
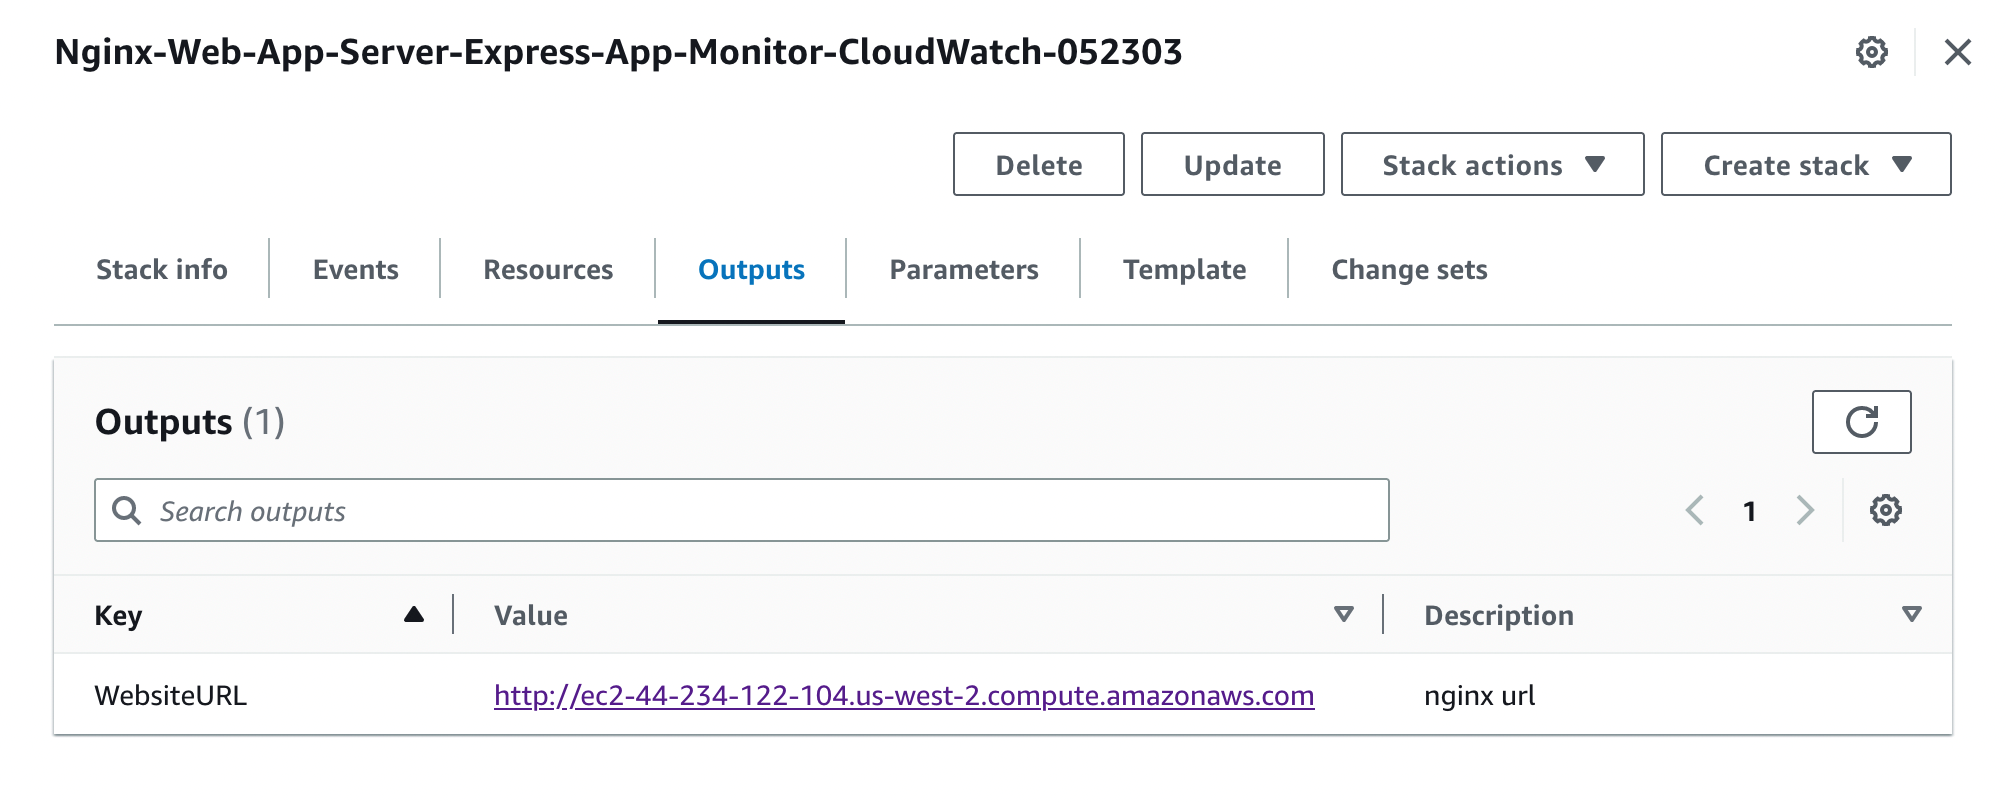
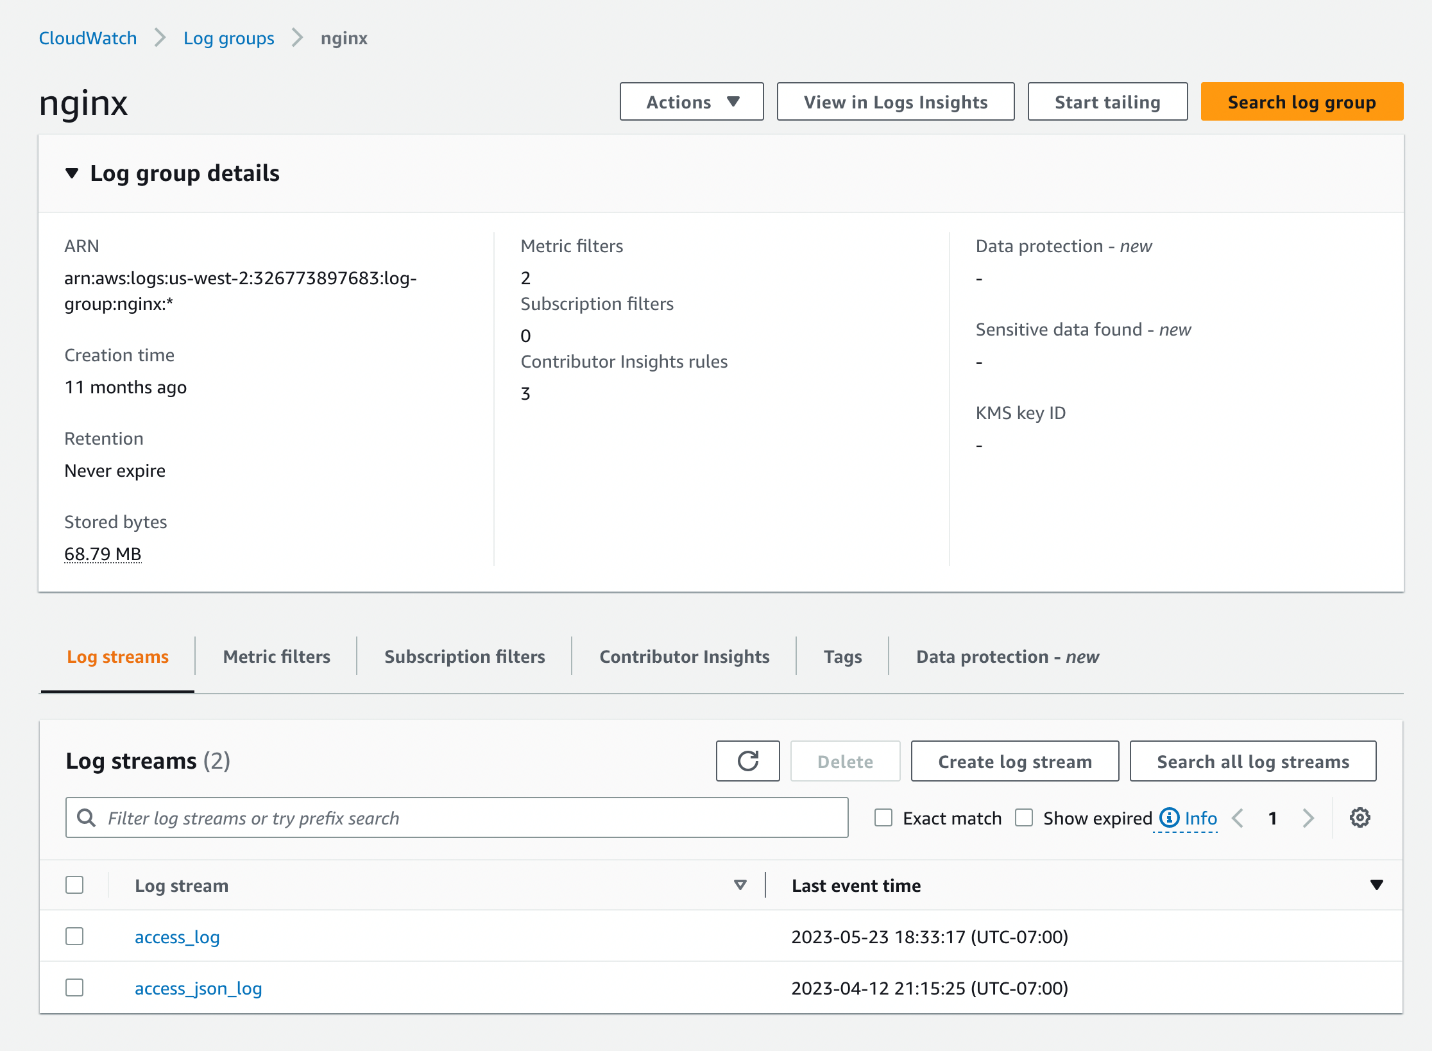
Step 3: The deployment takes 5–10 minutes. Once complete click on the WebsiteURL to see the following monitoring application running with two API endpoints FAILED and OK. The application is running and logging to NGINX web logs in JSON format. These logs are streamed to CloudWatch in the access_json_log log group for analysis.
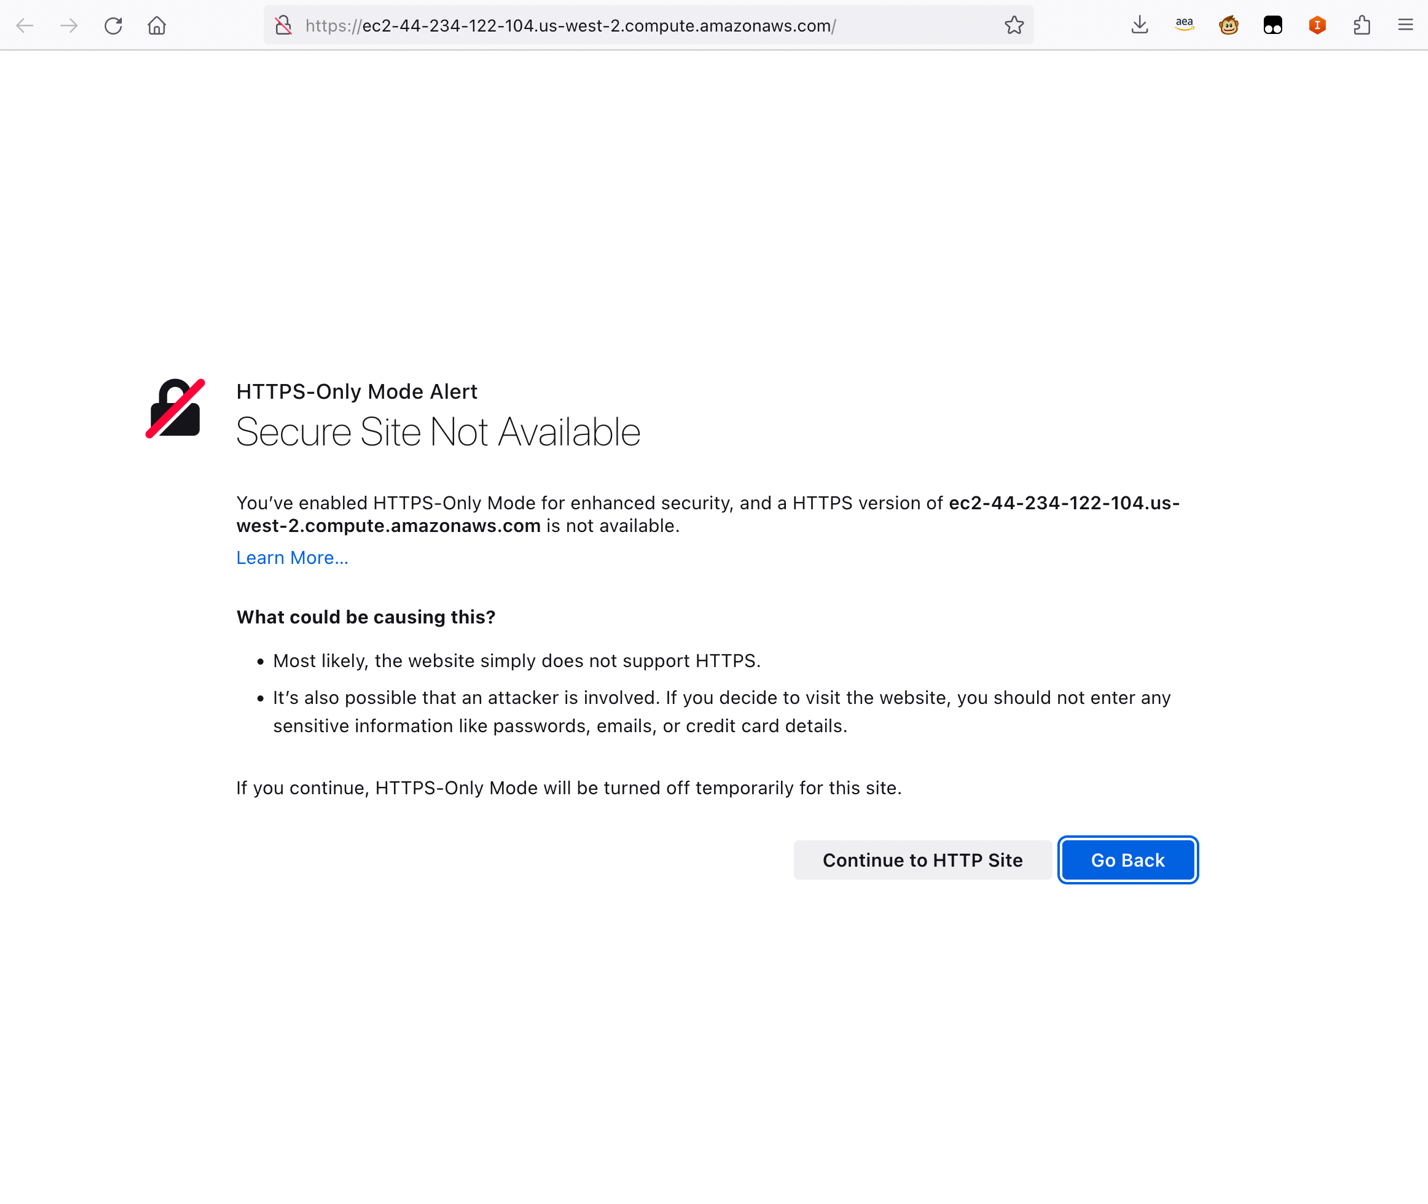
Click continue to HTTP Site when prompted with the following page:
Step 4: View the NGINX Web application server status and then click on /admin/health/x1 and /return-status/200 to open in new tabs (open multiple times to simulate API access):

Step 5: Now that the example web application and API is running, we will create a CloudWatch Dashboard to display 5XX, 4XX, 3XX response codes from the application. Then we will create CloudWatch Metrics for 5XX 4XX 3XX response codes that will be used for CloudWatch Alarms.
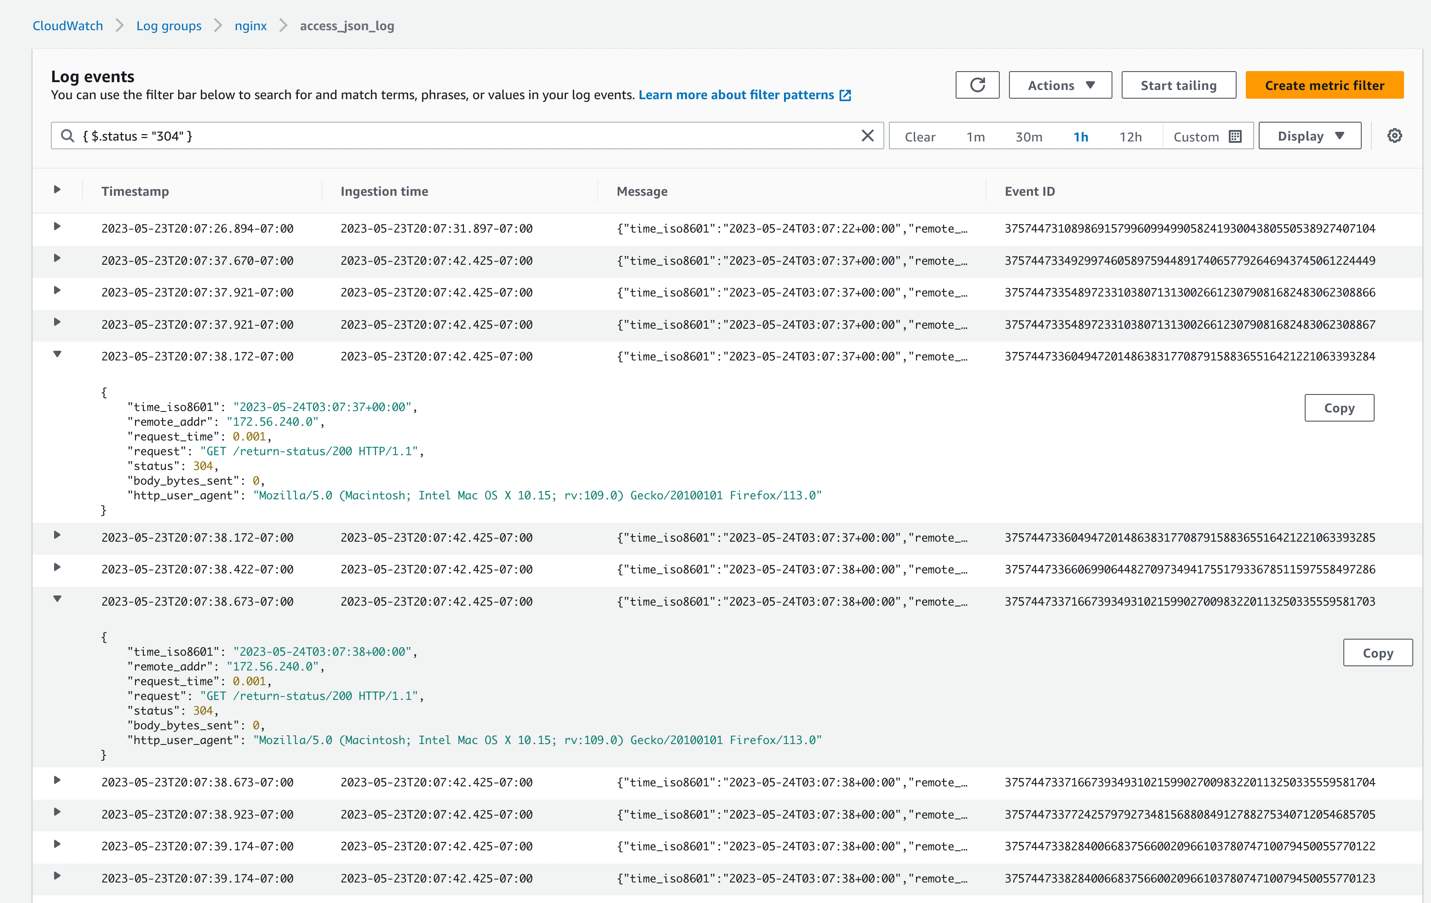
Let’s search for log messages with 3XX response code.
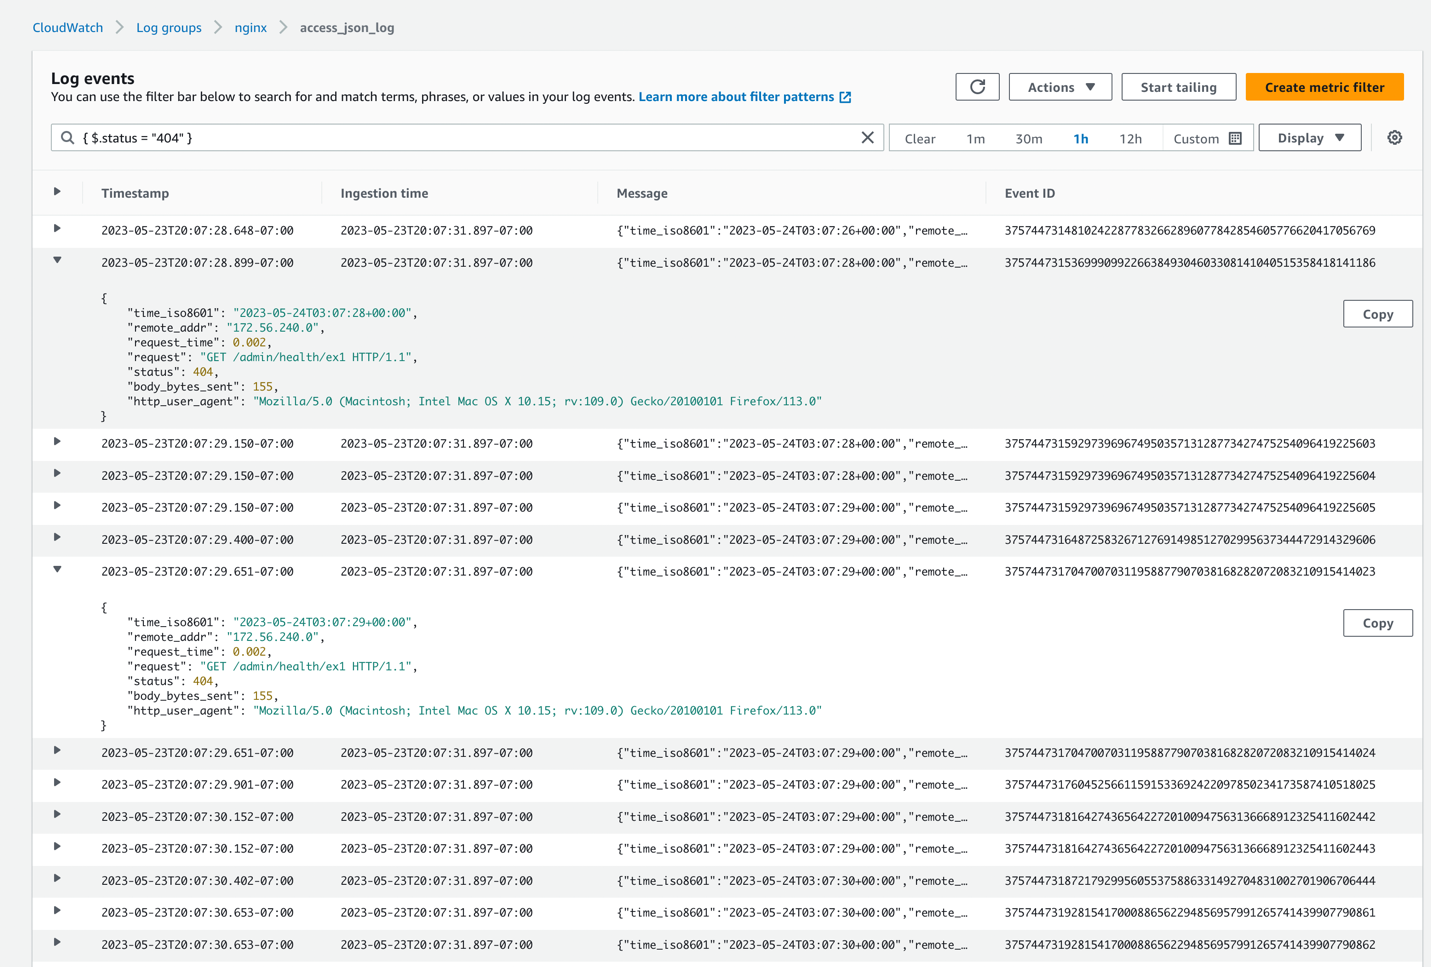
Let’s search for log messages with 4XX response code.
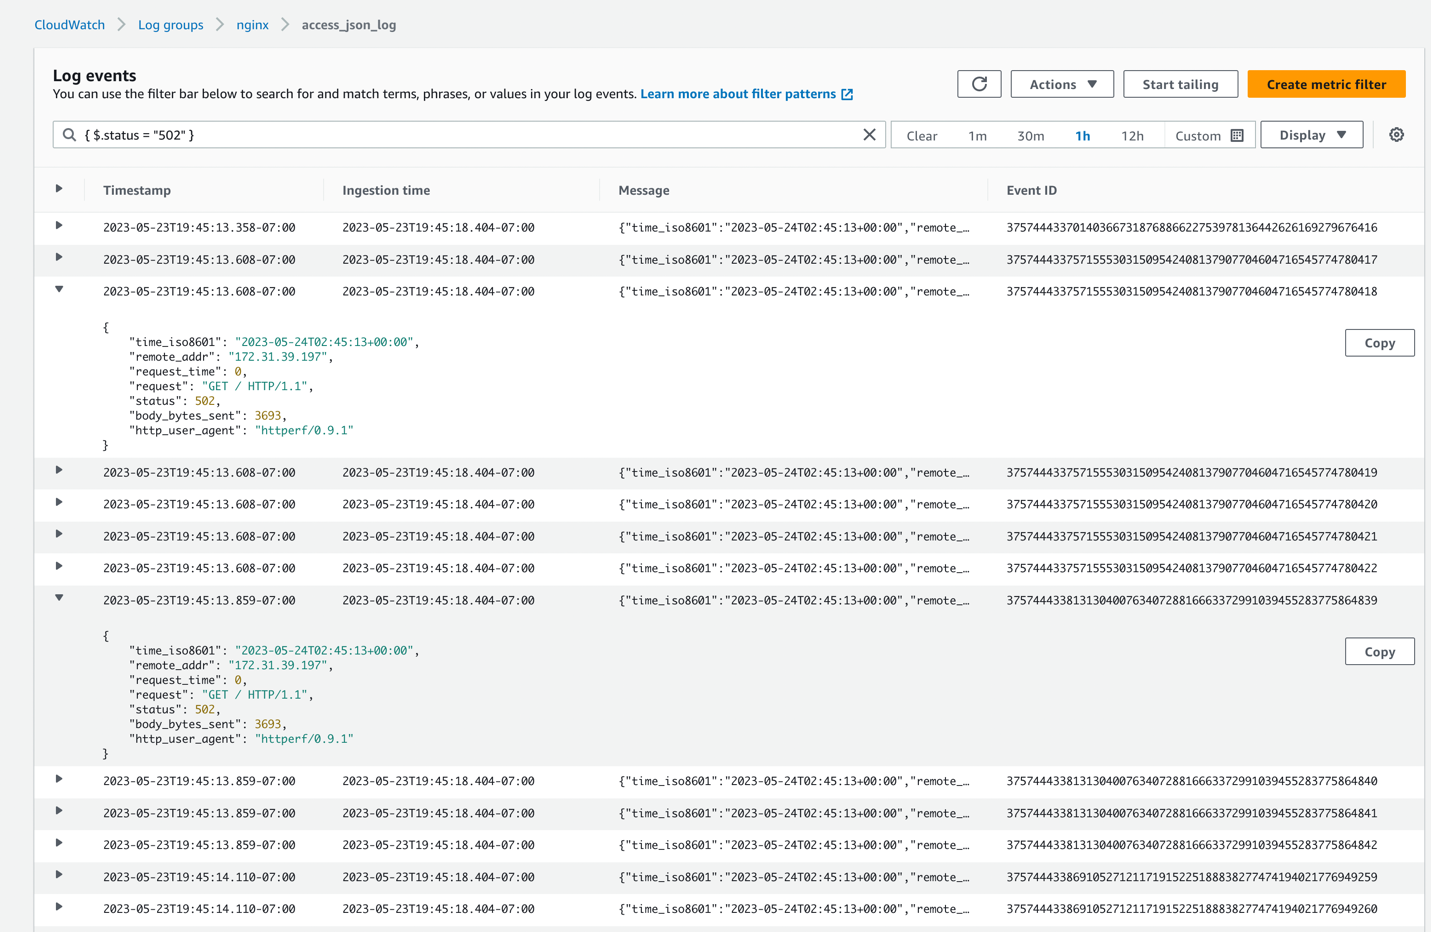
Let’s search for log messages with 5XX response code.
Step 6: Now let’s create a Metric Filter that will be used for visualization on the CloudWatch dashboard and for a CloudWatch Alarm.

Similarly, create a new Metric Filter for 2XX, 4XX, 5XX status codes.
Step 7: Once these metrics are created, the aggregated data will aid with the reporting of the contributions in Contributor Insights. Now let’s add the Contributor Insight rule to the CloudWatch Dashboard. Select on Add to dashboard to add to existing dashboard or create a new dashboard. Here we’ll add the CI rules as well the Alarm created previously to show a single pane of glass for 5XX.


Summary
In this blog we explained how to stream NGINX logs from an EC2 instance to CloudWatch, parse the logs with filters, create a graph to visualize NGINX status codes, and create alarms for status codes all within a single pane of glass.
Web application/API monitoring and observability are instrumental to enterprises and their business. Product and engineering teams can view, investigate, and remediate issues that occur in web applications when web server logs are streamed to CloudWatch using the broad capabilities of CloudWatch Contributor Insights, CloudWatch Logs, CloudWatch Metrics, and CloudWatch Alarms.