AWS Cloud Operations Blog
Visualize Amazon EC2 based VPN metrics with Amazon CloudWatch Logs
Organizations have many options for connecting to on-premises networks or third parties, including AWS Site-to-Site VPN. However, some organizations still need to use an Amazon Elastic Compute Cloud (Amazon EC2) instance running VPN software, such as strongSwan.
Gaining insight into Amazon EC2-based VPN metrics can be challenging when compared to AWS native VPN services that feature Amazon CloudWatch integration. This post aims to help surface those important metrics, so that administrators can better monitor the status and performance of their EC2 based VPNs.
Publishing these metrics allow administrators to keep meaningful network metrics in CloudWatch to correlate potential VPN issues with other AWS metrics and logs.
To learn more about running strongSwan on an EC2 instance, take a look at this blog post.
Solution overview
In our scenario, we will export key metrics from an EC2 instance running strongSwan and FRRouting to CloudWatch, including latency to a VPN target and the number of BGP prefixes received. We will also export the actual BGP prefixes that are present in the routing table of the EC2 instance to Amazon CloudWatch Logs. This lets administrators troubleshoot potential VPN and routing issues without the need to log in to the EC2 instance.
FRR works along with strongSwan, and it is used to manage dynamic routing. In this case, we’ll use the BGP protocol, though simple modifications could be made to accommodate other dynamic routing protocols.
Walkthrough
When the AWS CloudFormation template is deployed, it will create an AWS Identity and Access Management (IAM) role that is attached to an EC2 instance that you specify. The permissions include access to put metrics into CloudWatch and to put data into a specific CloudWatch Logs log stream.
Prerequisites
To follow along with this blog post, you should have the following:
- An AWS account
- An EC2 instance running Ubuntu or Amazon Linux 2 with strongSwan and software capable of managing dynamic BGP routing, such as FRR or Quagga
- An active VPN connection from your EC2 instance to another VPN device
- A target IP address on the remote end of the VPN that is capable of receiving ICMP traffic
Steps
As an overview, we will follow these steps:
- Deploy the CloudFormation template
- Attach the IAM instance profile to the EC2 instance
- Copy the bash file to your EC2 instance running strongSwan
- Install the command-line interface (AWS CLI) on the EC2 instance
- Create a cron job to schedule metric delivery to CloudWatch and CloudWatch Logs
- View the CloudWatch dashboard to visualize the metrics and verify metric delivery
Launch the CloudFormation stack
- Download the CloudFormation template associated with this blog post
- Log in to the AWS console, and navigate to the CloudFormation console
- Select the Create stack button
- Upload the template file that you previously saved, and select Next
- Enter a name for your CloudFormation stack, and fill in the parameters required by the template
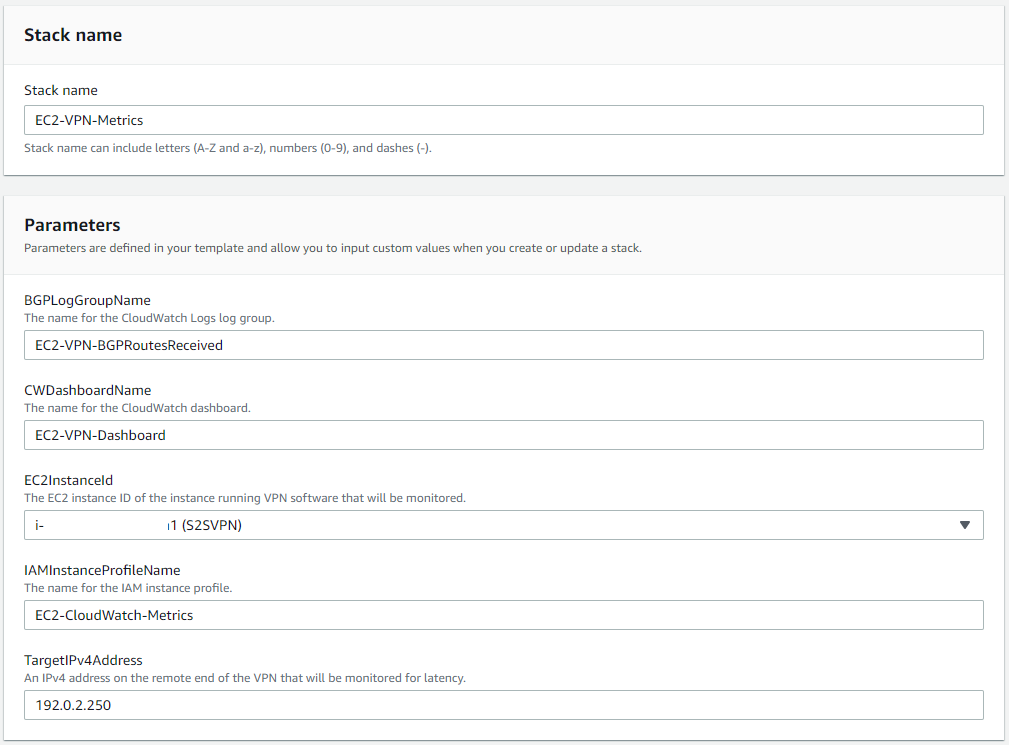
Figure 1: Launching the CloudFormation stack
- Select Next, and optionally specify any tags to apply
- Select Next once more, review the details, select the checkbox to acknowledge that the CloudFormation template will create IAM resources, and select Create stack
- You can monitor the resource creation progress on the Events screen
Attach the instance profile to your EC2 instance
- In the EC2 console, select the instance running strongSwan
- From the Actions dropdown in the top right corner, select Security and then select Modify IAM role
- From the dropdown menu, choose the role called “EC2-CloudWatch-Metrics”, as depicted in Figure 2 (this name may differ if you modified the default options when deploying the CloudFormation template)
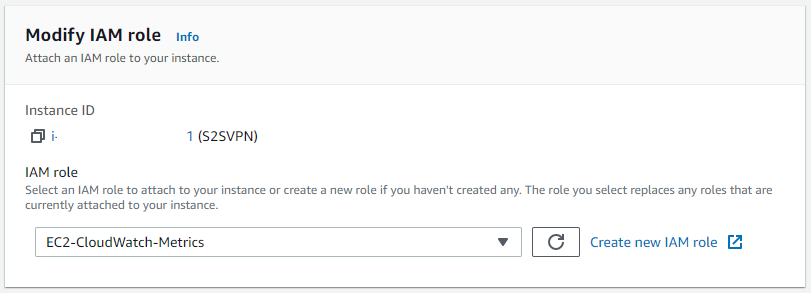
Figure 2: Modify the IAM role on your EC2 instance
Create the bash script in your EC2 instance
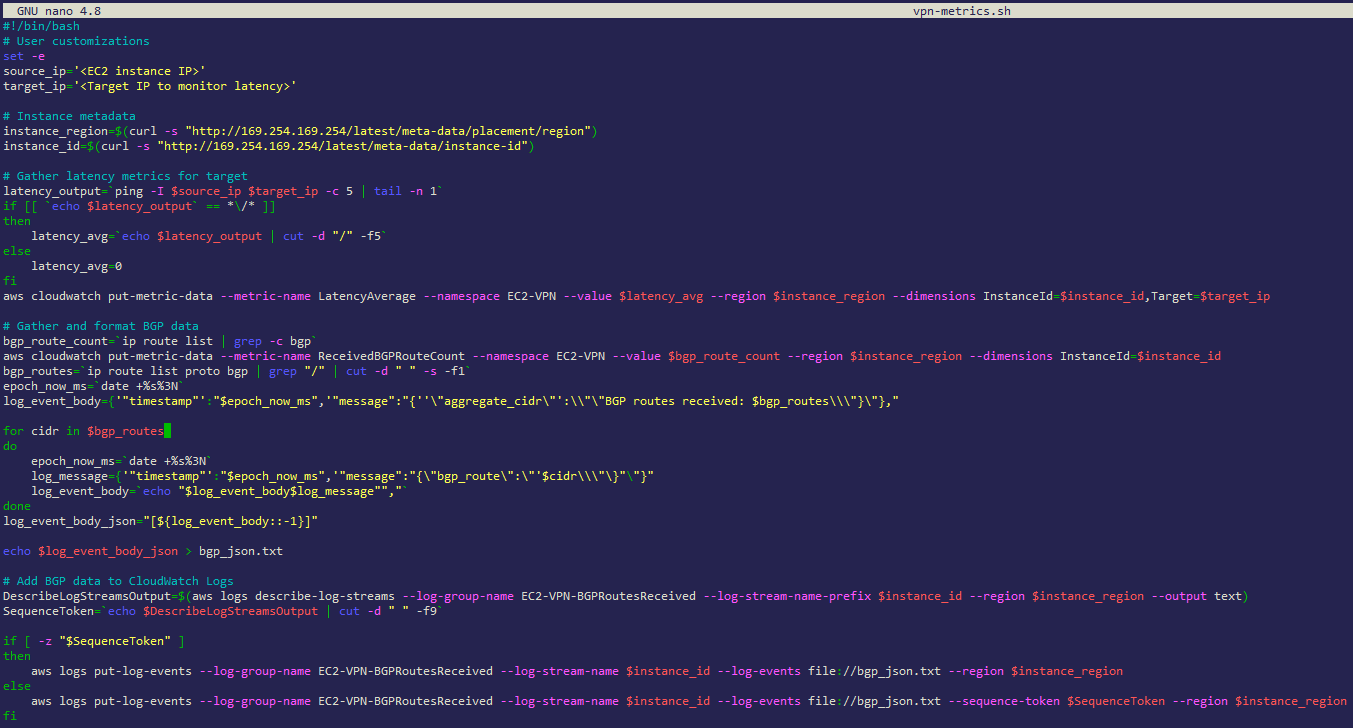
Figure 3: Creating the vpn-metrics.sh script on your EC2 instance
- Log in to the EC2 instance running strongSwan
- Create a new file, and copy the below script into it, as shown above in Figure 3 (the script is also available to download here)
$ nano vpn-metrics.sh- Paste the script into the file
- Modify the target_ip variable, and specify a target IP address on the other end of the VPN. Make sure that it accepts ICMP echo-request messages. Additionally, specify a source IP address on your local EC2 instance for the source_ip variable. This is where the ICMP messages will be sourced from.
- Save the file
- Press ctrl-X to exit the editor
- Press Y to save the changes
- Give the new file execute permissions
$ chmod +x vpn-metrics.sh
Install the AWS CLI
If you’re using an operating system other than Amazon Linux 2, then you will need to install the AWS CLI.
Create a cron job
A cron job creates a scheduled task that runs at a specified time or interval.
Follow these steps for Amazon Linux 2:
$ crontab -e- Add this line to execute the script every five minutes:
*/5 * * * * /home/ec2-user/vpn-metrics.sh
Follow these steps for Ubuntu:
$ crontab -e- Add this line to execute the script every five minutes:
*/5 * * * * /home/ubuntu/vpn-metrics.sh
When the crontab is saved, crontab: installing new crontab appears.
View the CloudWatch dashboard
- Navigate to the CloudWatch console, and select Dashboards.
- Select the dashboard titled “EC2-VPN-Dashboard”.
- If the cron job has already run, then you will see metrics populated in the three dashboard widgets (if you do not see any metrics yet, then wait a few minutes for CloudWatch to populate them).
- New metrics will continue to appear after the cron job runs and executes the script. Use the refresh icon in the upper right of the CloudWatch console to see new metrics appear in the dashboard widgets. Figure 4, depicts metrics for all three widgets.
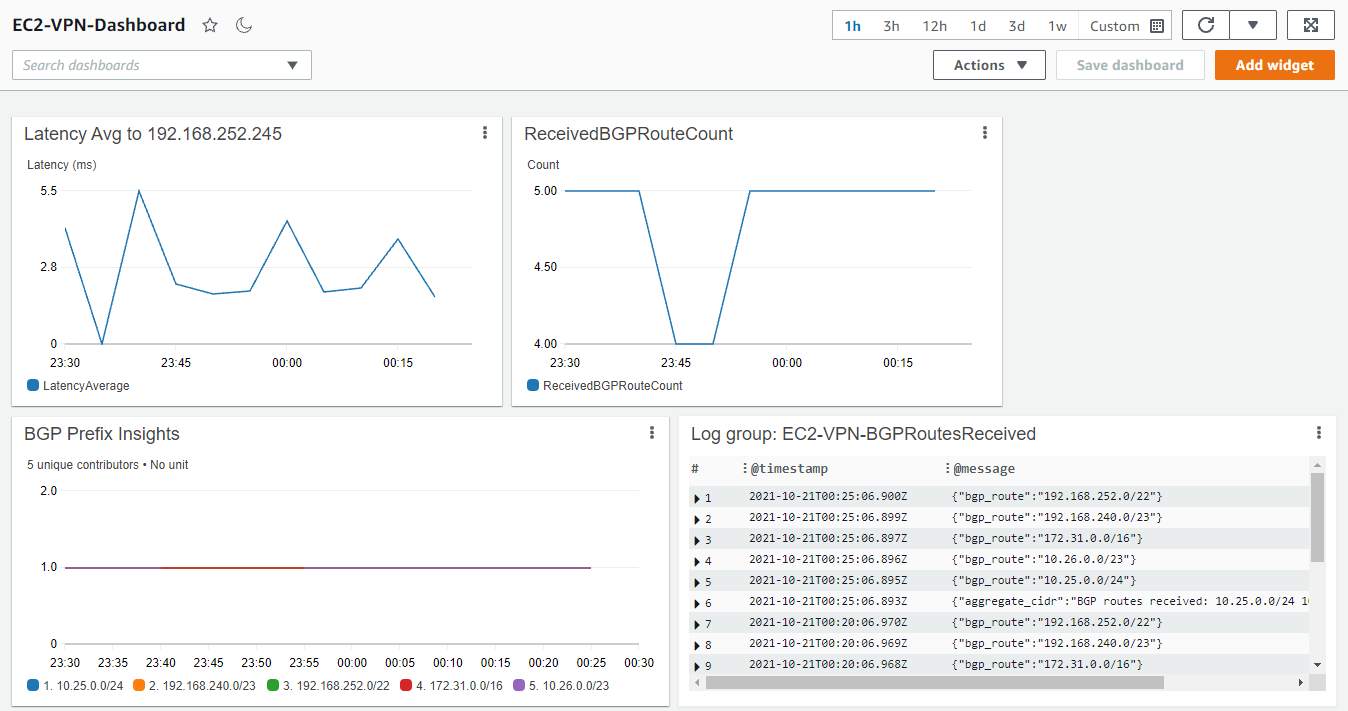
Figure 4: Viewing the CloudWatch Dashboard
The Amazon CloudWatch Contributor Insights widget in the bottom left of Figure 4 will show when a BGP prefix is no longer present in the BGP route table of the EC2 instance. This can be very useful in troubleshooting a scenario where routes from multiple BGP sources are present. The dip in the ReceivedBGPRouteCount widget in Figure 4 correlates with a temporary loss of the prefix 10.26.0.0/23, shown in the BGP Prefix Insights widget in Figure 5.
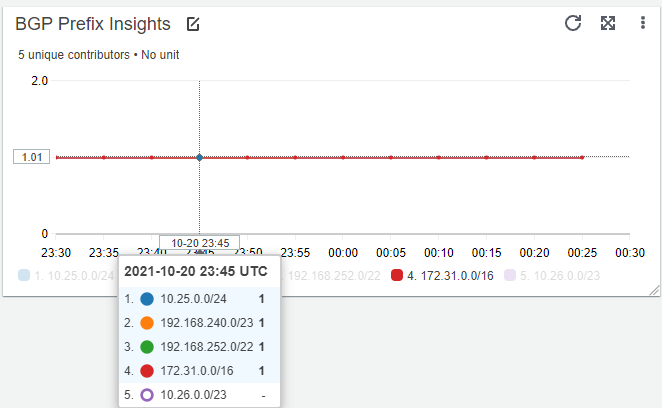
Figure 5: BGP Prefix Insights
The Contributor Insights rule can also be viewed in a standalone fashion by visiting the Contributor Insights link under the CloudWatch service page.
Cleaning up
Disable the cron job running on your EC2 instance to avoid incurring charges. To do this, execute the steps below:
$ crontab -e- Remove this line:
*/5 * * * * /home/ec2-user/vpn-metrics.sh(replaceec2-userwithubuntu, if the EC2 instance is running Ubuntu)
To deprovision the CloudWatch dashboard, log group, and IAM role, delete the CloudFormation stack that was deployed.
Conclusion
This post demonstrated how to publish custom CloudWatch metrics from an EC2 instance to a CloudWatch dashboard and custom namespace. Publishing these metrics lets administrators view key performance metrics for an EC2-based VPN, and have the ability to create CloudWatch alarms if desired.
To publish other EC2 metrics not covered in this post, take a look at the CloudWatch agent to publish in-guest, system-level metrics.