Networking & Content Delivery
Using Amazon CloudWatch Internet Monitor for enhanced internet observability
Amazon CloudWatch Internet Monitor alerts you to critical internet health events that affect your application users. However, it can also play a key role in helping you efficiently troubleshoot and mitigate network problems before they affect your customers or cause headaches for your leadership. The simplest and most efficient way to leverage the new internet-centric metrics that Internet Monitor provides is to integrate the measurements with observability and incident resolution tools that you already use. Then, using your tools to get a complete picture, you can take proactive steps to monitor your application health, troubleshoot network problems, and remediate issues before they have noticeably negative impacts.
In this post, we walk through several approaches for using familiar AWS and third-party tools with your application’s Internet Monitor metrics to gain insights and quickly mitigate network problems. You can configure and trigger CloudWatch alarms based on your metrics, and learn about options for receiving health event notifications by setting up Amazon EventBridge to work with your custom workflow. You can see detailed steps for using Zendesk, a customer interaction platform to notify your service operators about an availability or performance degradation event. By customizing the examples we provide to meet your own use cases, you can improve your incident response and business agility.
Before starting
The following steps assume that you’ve already created a monitor using Internet Monitor in your AWS account. If you don’t have a monitor, then follow the instructions in the Internet Monitor chapter of the CloudWatch User Guide to create one. There are two ways to do this, you can use the AWS Management Console, or the AWS Command Line Interface (AWS CLI). Make sure that you’ve added the monitor resources that have internet-facing traffic, so that Internet Monitor publishes CloudWatch metrics in your account.
Using published metrics to create CloudWatch alarms
Internet Monitor publishes a set of metrics to CloudWatch every five minutes for each monitor. You can configure CloudWatch alarms and receive notifications on these Internet Monitor metrics. When a metric crosses a threshold, you can choose actions to take, such as notifying your customers about the internet event or creating a ticket for your operations team.
To generate alarms or take other custom actions in response to internet health metrics, refer to the Create a CloudWatch alarm with Amazon CloudWatch Internet Monitor entry in our documentation.
Scenario One:
As a DevOps engineer for ABC Company that sells shirts and shoes internationally, Niall wants to detect spikes in round-trip time for their company’s application users. If a spike crosses a certain threshold, then they want to start a workflow that sends a notification to their networking team.
- Choose the metric
RoundTriptimeunder the namespaceAWS/InternetMonitorfor the desired monitor.
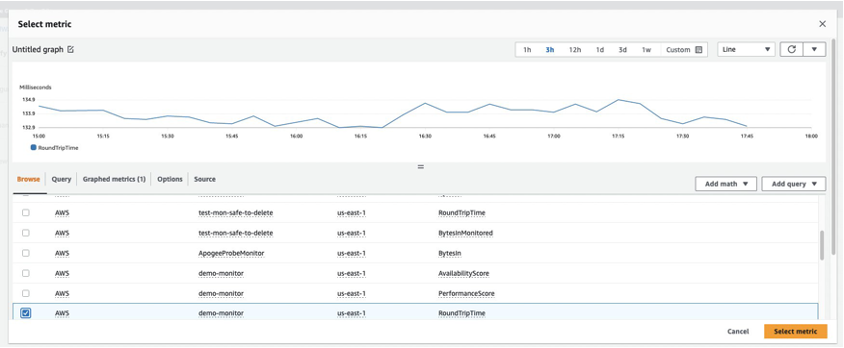
Select the RoundTripTime metric
- On the
GraphedMetricstab, under Actions, choose the bell icon to create an alarm.
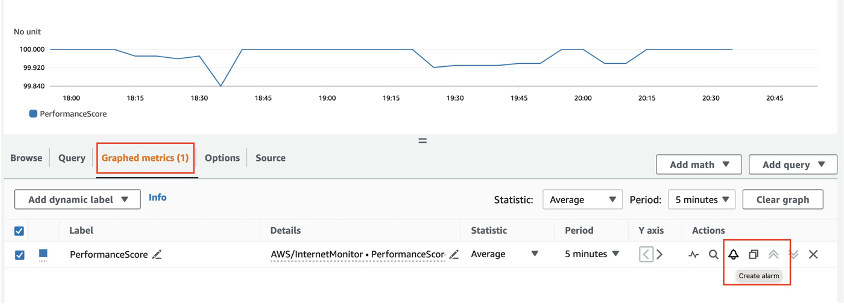
Create alarm
- Setup a static threshold with a suitable value for the round-trip time. The following example chooses to trigger the alarm whenever the average value of the RoundTripTime metric exceeds 200 milliseconds over a five-minute interval.

Setup static threshold for RTT
- Finally, configure an action to send a notification to a new or existing Amazon Simple Notification Service (Amazon SNS) topic. This notification can be used to trigger user notifications and alerts.
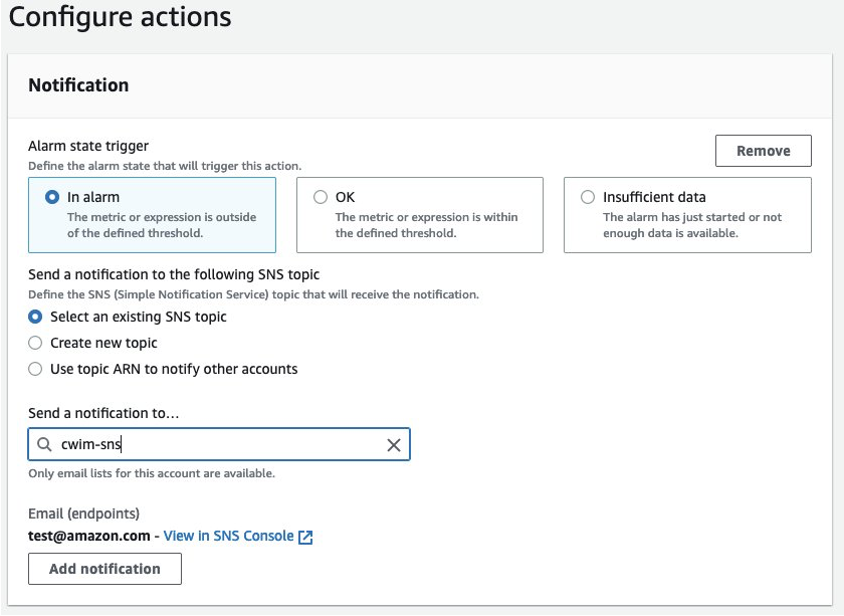
Configure SNS notification action
Publishing health events using EventBridge
Internet Monitor generates health events when it detects availability and performance issues for the resources configured in your monitor. Use EventBridge to receive these health notifications from Internet Monitor and publish them to an appropriate target. This target can be an EventBridge event bus, EventBridge API destination, or AWS service. You can trigger custom actions or orchestrate business workflows in response to internet health issues.
Follow these steps to set up EventBridge rules for Internet Monitor health events:
- Navigate to the EventBridge service in the AWS Management Console and select the workflow to create a new rule.
- Specify a rule name and choose the
defaultevent bus. - When selecting the event source, pick
Otherto point to health events generated by Internet Monitor. - Match the following source when matching the event pattern:
{
"source": ["aws.internetmonitor"]
}
- Next, choose a target for publishing the received health event. EventBridge delivers the event to the selected EventBridge event bus, API destination, or AWS service.
Scenario Two:
As a network admin for a gaming company, Jane wants to automatically push internet health events to a CloudWatch log group to power CloudWatch Insights queries.
- Navigate to the EventBridge page within the AWS Management Console.
- Select
Rulesunder theBusessection and choose the option toCreate rule.
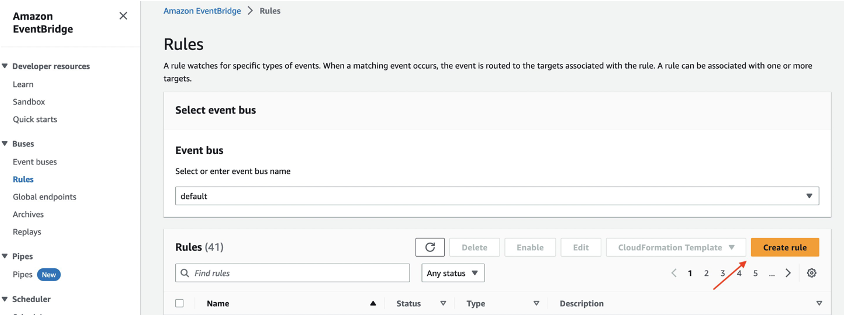
Create rule in Amazon EventBridge
- Define an event rule on the default event bus.
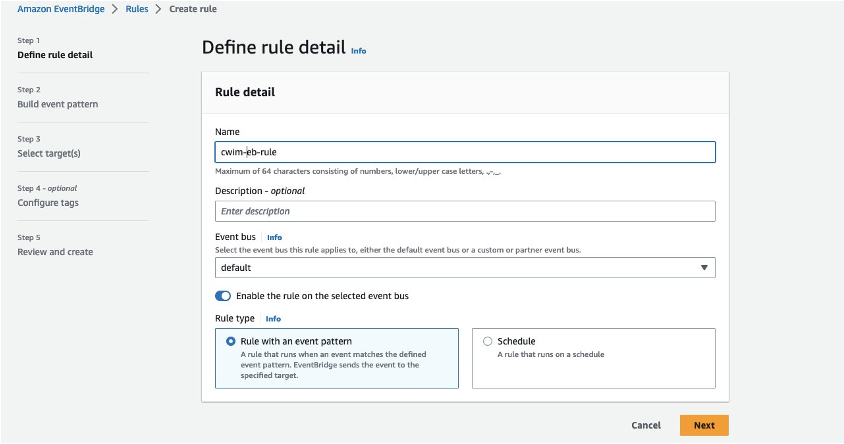
Define event rule on default event bus
- Create an event pattern for the source that matches the Internet Monitor source.
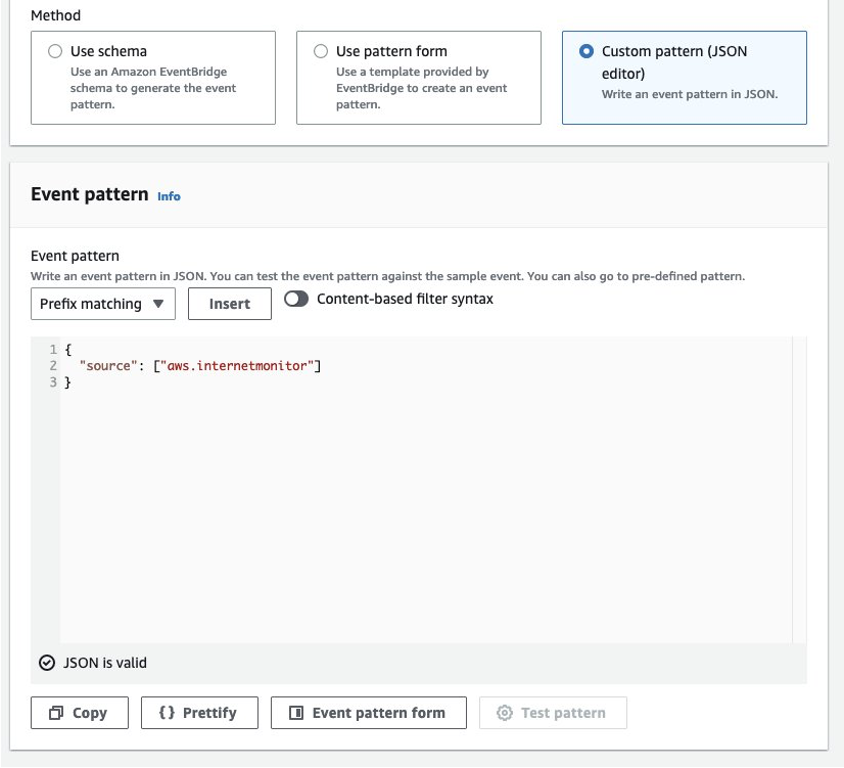
Event pattern for Internet
- Select
AWS Serviceas the Target type and chooseCloudWatch log groupas the target with a new or existing log group.- Whenever a health event is received by EventBridge, it generates a log record and publishes to the log group selected.
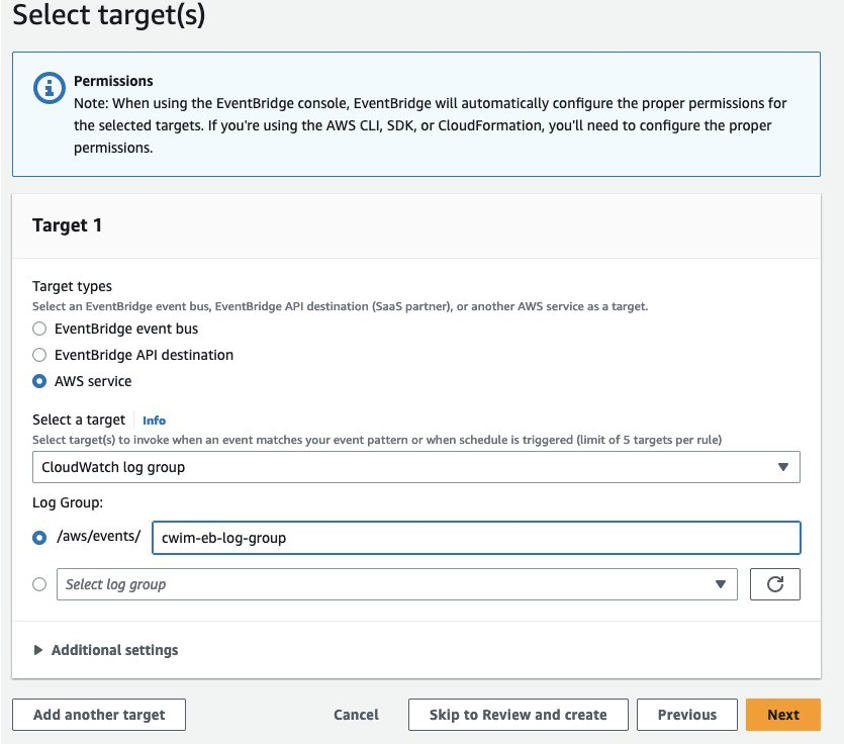
Configure CloudWatch log group target
Integrating internet events with third-party incident response systems
IT organizations use various third-party operational tools to power business workflows. These may include ticketing systems, incident response platforms, or tools for enhanced observability and customer engagement. Our customers want seamless integration of internet health events with these third-party services. Here are a few use cases you could explore:
- Cut a ticket in Zendesk to engage the operations team when an internet availability issue is detected.
- Store health events in an external MongoDB to power dashboards for executive leadership.
- Notify users of an ongoing internet outage using an online messaging platform like Slack.
You can configure third party API targets using EventBridge to receive internet health events and take suitable actions. Use the following procedure to integrate with external systems using EventBridge:
- Create an API destination by navigating to the Integrations section of the EventBridge service in the AWS Management Console.
- Provide the destination name, API endpoint, and connection config for the desired destination type.
- Make sure that the authorization information is correctly configured.
- Setup a rule in EventBridge using the steps outlined in Using Amazon CloudWatch Internet Monitor with Amazon EventBridge.
- When choosing the target, select the
EventBridge API destination, and pick the API destination configured. - Whenever EventBridge receives health events from Internet Monitor, it publishes them to the selected response system and takes appropriate actions as configured.
Scenario Three:
As a service operator of Example Corp, Li wants to perform rapid troubleshooting upon detection of internet health events. Whenever an event is raised, they want to engage the network operations team by cutting a Zendesk ticket.
- Navigate to the EventBridge service on the console and choose the option to create an API destination.
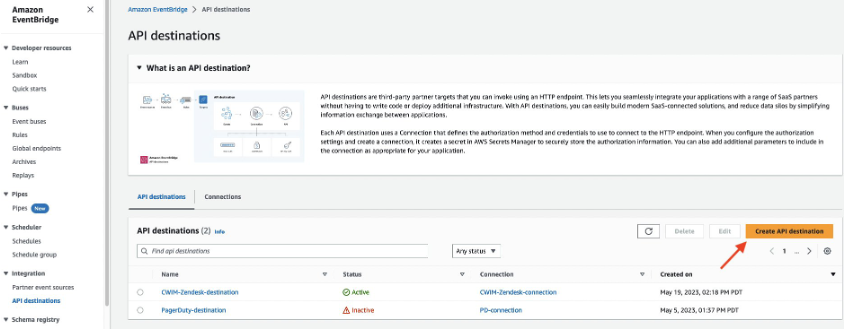
Configure API destination using EventBridge console
- Create an API destination under EventBridge and specify the API endpoint for the Zendesk ticket creation API.
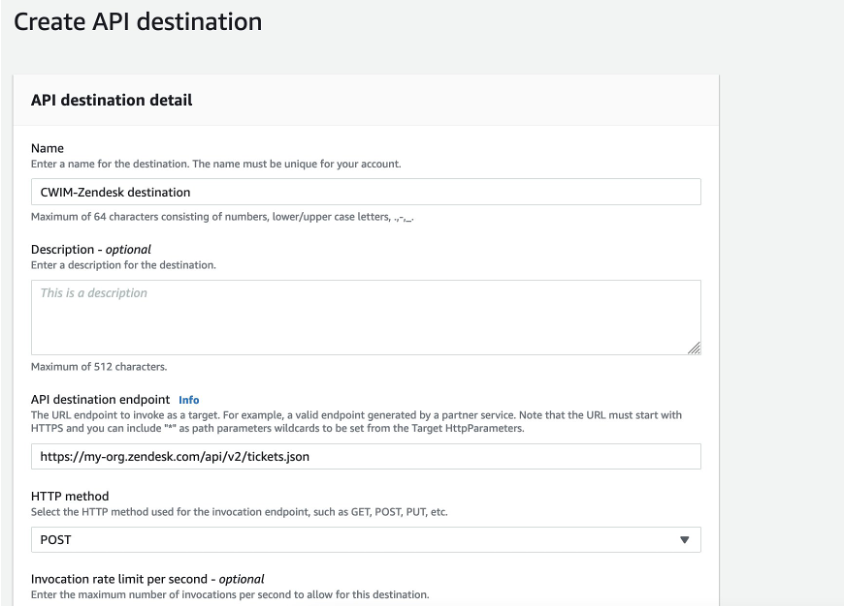
Select API destination for Zendesk
- When specifying the connection to use, create a new connection with destination type Partners, and select “Zendesk” from the drop-down list with the appropriate authorization type.
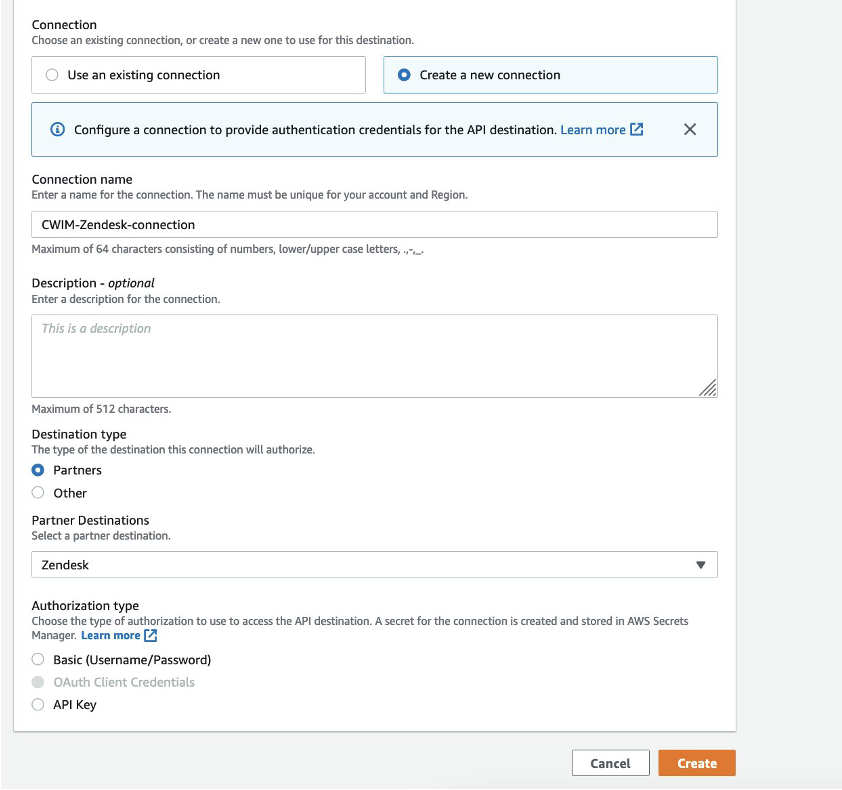
Create new connection for API destination
- Now, create an event rule using EventBridge with the source pointing to Internet Monitor.
- When choosing the target, pick
EventBridge API destinationand select an existing API destination setup for Zendesk.
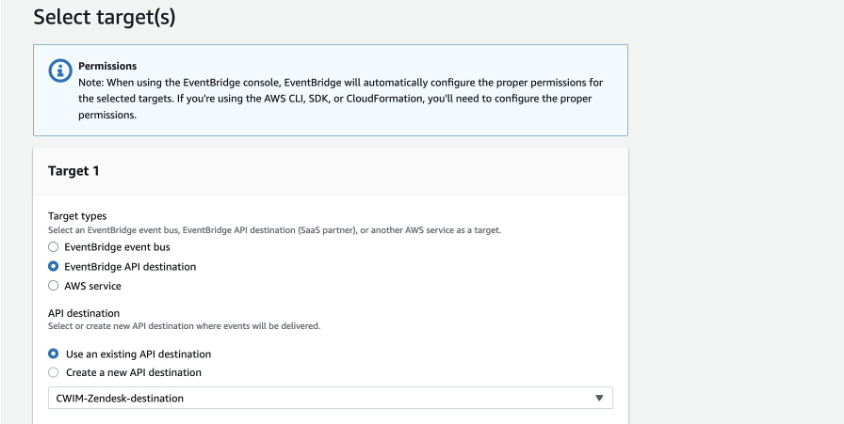
Select API destination target
- Post completion of the event rule creation. Whenever EventBridge receives internet health events, it publishes them to the Zendesk API target and creates a ticket. This enables your operational team to start pro-active incident troubleshooting.
Conclusion
This post describes solution patterns to detect internet issues, notify target users, and start active troubleshooting using existing AWS and third-party observability tools. You learned how to use CloudWatch metrics and trigger alarms against internet measurements.
We showcased how internet health events can be delivered by EventBridge to an Amazon SNS topic for orchestrating custom workflows. You developed deeper insights into how to integrate internet events with partner ticketing systems to maintain business agility. Using the highlighted approaches and other AWS best practices, you can improve service health, respond to internet events faster, and continue to delight your customers even more!

Akshay Deodhar
Akshay is a Sr. Software Dev Engineer at AWS. He helped build and launch the CloudWatch Internet Monitor service. He is passionate about delivering impactful product features with a focus on simplified user experience.