AWS Open Source Blog
Building a Helm chart for deploying the OpenTelemetry Operator
In this post, Shibo Wang, an intern on the AWS Open Source Observability team, shares his experience of designing and building the OpenTelemetry Operator Helm chart and integrating the OpenTelemetry Operator into the AWS Distro for OpenTelemetry (ADOT). This open source Helm chart allows you to install the OpenTelemetry Operator to an on-premises or managed Kubernetes cluster with a one-line Helm command, and provides increased flexibility in configuring the Operator. This post walks through the design and implementation of the components related to Shibo’s project and the challenges addressed along the way.
What is OpenTelemetry Operator?
OpenTelemetry is an open source observability framework that contains a collection of tools, APIs, and SDKs to instrument software for collecting telemetry data. The OpenTelemetry Operator is one of the best tools in the OpenTelemetry toolbox. It is an implementation of a Kubernetes Operator, which provides a method of packaging, deploying, and managing a Kubernetes-native application, which is both deployed on Kubernetes and managed using the Kubernetes APIs and kubectl tooling.
The Kubernetes Operator is a custom controller that introduces new object types using a custom resource definition (CRD), an extension mechanism in Kubernetes. In this case, the CRD managed by the OpenTelemetry Operator is the OpenTelemetry Collector.
The OpenTelemetry Operator watches the Collector and is notified of its availability or updates. When the OpenTelemetry Operator receives a notification, it will start running in the following order:
- It will ensure that all required connections between these requests and Kubernetes API server are available.
- It will configure the Collector as defined in the configuration file.
Figure 1 shows how the OpenTelemetry Collector custom request is processed in the Kubernetes cluster.

Figure 1: Processing a Collector custom request in a Kubernetes cluster.
What is Helm?
Like Homebrew for macOS or Chocolatey for Windows, Helm is the package manager for Kubernetes. Helm offers a way to define, search, and use software that is built for Kubernetes. A Helm chart is a collection of files that describe a related set of Kubernetes resources, which will be deployed in one unit.
Helm is popular these days because it improves productivity in many aspects. A Helm chart also reduces the complexity of managing large applications in Kubernetes. No matter how complex your application is, Helm treats it as a single package, which makes managing, updating, or rolling back easier. Apart from that, Helm charts are easy to version, share, and host on public or private servers, which help manage cloud-native applications.
Figure 2 shows the workflow for how this Helm chart works.
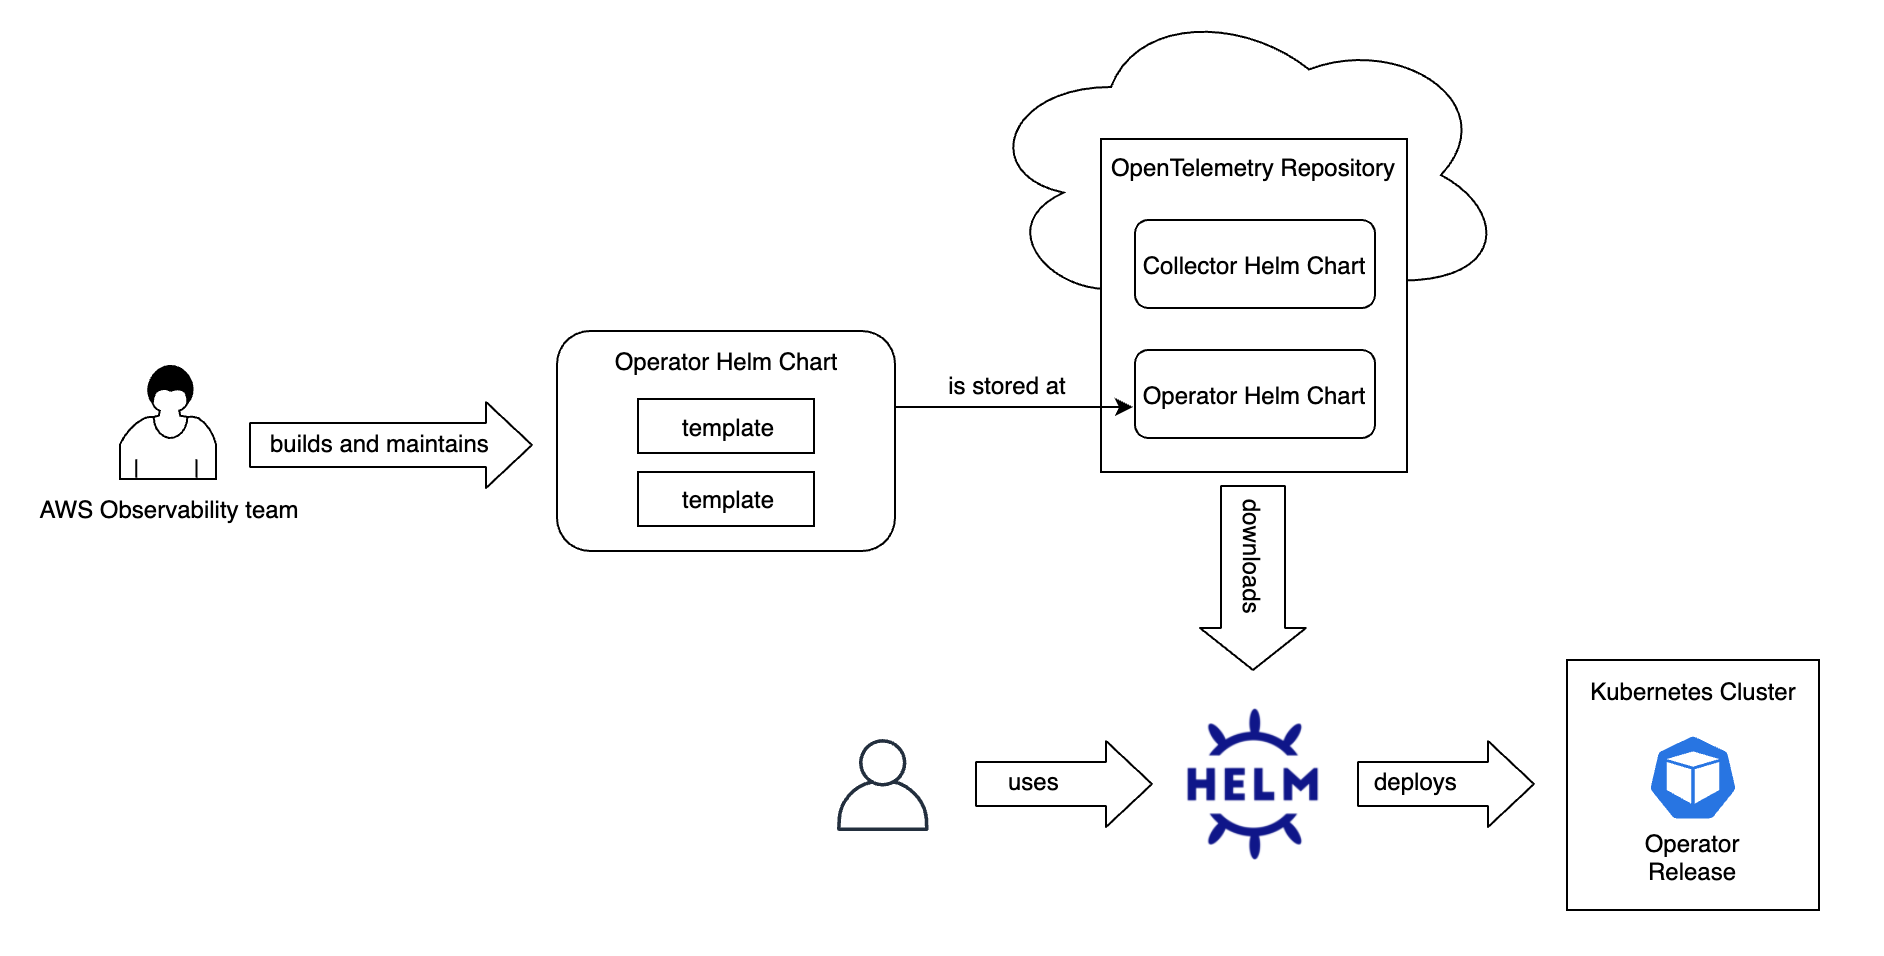
Figure 2: Workflow of the OpenTelemetry Operator Helm chart.
Why do we need a Helm chart for the OpenTelemetry Operator?
Before this Operator Helm chart was added to OpenTelemetry, a couple of approaches were already available to users to help install the OpenTelemetry Operator.
- The first approach is to install the Operator is by applying the Operator manifest directly. Refer to GitHub for more details about installation.
- The second approach is to use the Operator Lifecycle Manager (OLM) to install the OpenTelemetry Operator.
Adding this Helm chart immediately provided the following benefits to users, as compared with the previously mentioned approaches for installing the OpenTelemetry Operator.
Benefits of using this new Helm chart as compared to using the manifest directly include:
- Functionality: In addition to installing/uninstalling packages, Helm offers other useful functions, including upgrade, rollback, and customization during installation.
- User flexibility to configure values: Through the
values.yamlfile, you can determine which values to pass to the OpenTelemetry Operator Helm chart configuration. You can override multiple values with one command.
Benefits of using this new Helm chat as compared to using the Operator Lifecycle Manager (OLM) include:
- Easier way to deploy the Operator: You might not want to install the OLM in your Kubernetes cluster if you don’t need its functions other than as an agent to install the OpenTelemetry Operator. In this case, you can use the Helm chart to deploy the OpenTelemetry Operator, which can be done with a one-line command:
Project goals
The goals for this project can be divided into two parts. The first part was to design and build the open source OpenTelemetry Operator Helm chart. The second part was to integrate the OpenTelemetry Operator into the AWS Distro for OpenTelemetry (ADOT) Operator.
For designing and building the open source OpenTelemetry Operator Helm chart, my goals were to:
- Design and build the OpenTelemetry Operator Helm chart.
- Manage the Custom Resource Definition dependency more easily.
- Provide flexibility to tune the configuration as much as possible.
- Build a scalable Helm chart structure to prepare for future managed objects.
For integrating the Operator Helm chart into AWS Distro for OpenTelemetry Operator, my goals were to:
- Mirror OpenTelemetry Operator images from external registries to the AWS Observability Elastic Container Registry (ECR) public gallery.
- Add monthly release process of the ADOT Operator to the ADOT repository.
- Add ADOT Operator integration tests to the ADOT Amazon Elastic Kubernetes Service (Amazon EKS) test framework.
Achieving these goals made the user experience of deploying the OpenTelemetry Operator easier and more flexible, which is a significant win for a “getting started“ experience.
Operator Helm chart design and implementation
The following diagram shows the directory structure of the Operator Helm chart:
Here, the crds/ directory stores all the CRDs when template rendering. Helm will install the CRDs in this directory first. Currently, we only have the OpenTelemetry Collector as the CRD dependencies.
The templates/ directory stores all the templates that Helm will evaluate when installing the chart, which eventually will be sent to the Kubernetes cluster.
The release/ directory stores all release automation related code, which will be covered in later sections.
TLS certificate-related issues
Certification is one of the biggest challenges encountered when designing and building the Helm chart. In Kubernetes, in order for the API server to communicate with the webhook component, the webhook requires a TLS certificate that the API server is configured to trust.
The OpenTelemetry Operator requires certificates to be available in the secret opentelemetry-operator-controller-manager-service-cert during runtime. Figure 3 shows the data path of the role the TLS certificate plays.

Figure 3: Data path of the dynamic admission control.
The Operator solves this problem by using a Kubernetes-native cert-manager to generate a self-signed certificate as default. But this approach requires you to first install the cert-manager in the Kubernetes cluster. So, I wanted to know whether there was a way to bypass this prerequisite so that you didn’t need to do this step manually. There are alternatives, but they are not good enough compared with cert-manager. Here’s why.
The first approach that comes to mind is to utilize the subchart mechanism offered by Helm to solve this issue. We can deploy cert-manager as a subchart of the Operator chart. However, this solution won’t work because in Helm, when we install a chart, the pods/deployments/services of the subchart will take the parent chart’s name.
For example, if we install our Operator chart and give this release a name—my-operator—the name the webhook service cert-manager provides will become my-operator-cert-manager-webhook, which will cause a service "cert-manager-webhook" not found error. We found out that the cert-manager team doesn’t support or recommend chart developers to deploy cert-manager as a subchart (refer to issue 3616). Thus, this subchart approach doesn’t work.
Another approach I explored to substitute cert-manager is to use other ways to generate the certificate. There are two candidates available: kube-webhook-certgen and the init container-based implementation. These two ways have similar results in that they both generate a self-signed TLS certificate for the Operator to use.
This approach works theoretically, but in a production environment, you will face the issue of certificate rotation. Every TLS certificate has an expiration date and, when it reaches the expiration date, you must rotate the old date out and add a new date. If we use cert-manager, it handles this issue automatically. But neither of these two methods has this capability, which means that users must rotate the certificate manually. So, this approach is not better than the cert-manager solution either.
Therefore, the cert-manager solution is the best approach both from the Helm chart developers’ point of view and from the user’s point of view.
Release process
Another important step was how to design and implement the Helm chart release process. The maintainability of the Helm chart is a major concern that Operator maintainers may have. Many Helm charts are not in use because they are not maintained and thus go out of sync with the original project.
In my design goals, I made sure this Helm chart would be developed with a high level of maintainability by automating the Helm chart release as much as possible and by providing a release-checklist document for maintainers to use.
The fully automated release process includes the following steps:
- Retrieve the latest Operator manifest from the Operator GitHub repo.
- Update the Collector CRD YAML file.
- Scrape the latest Operator images repo with tags and update
values.yaml. - Check which templates need to be updated and return a report.
- Use GitHub Actions to run KUTTL smoke tests against the Operator Helm chart.
The release process workflow diagram is shown in Figure 4.

Figure 4: Release process of the OpenTelemetry Operator Helm chart.
The core release automation functions are as follows:
The only thing the maintainers must do is run the code and update the corresponding template files if they see a notification in the running results. Figure 5 shows the automated release code running results.

Figure 5: Operator Helm chart release running result.
In this example, the maintainers are notified that the Collector CRD, values.yaml, and Chart.yaml files are updated automatically. Thus, the maintainers must add two configurations in rolebinding.yaml and deployment.yaml, respectively. They also must check the validatingwebhookconfiguration.yaml file to see which part needs to be changed.
Testing the Operator Helm chart
The testing strategy for this Helm chart contains three parts, including unit tests and two types of smoke tests.
Smoke tests using Helm built-in functionality
I used the Helm built-in testing functionality to test the service connections of the OpenTelemetry Operator Helm chart. Using the Helm chart built-in testing features is a basic smoke testing strategy. A test is a job definition that specifies a container with a command to run. The containers should exit successfully (exit 0) if a test succeeds. Helm uses the annotation "helm.sh/hook": test to identify a testing job. All these test files can be found under the templates/tests/ directory.
This smoke testing approach confirms whether the operator service and the cert-manager service are running. I tested this using the wget command to wget the operator-service or cert-manager-service’s ClusterIP. We should see the HTTP error 400 error result if the service is running. This is an expected error because our request is not expected by either the operator service or cert-manager service.
KUTTL smoke tests
I also used the KUTTL smoke tests from the Operator repository to test that the Operator controller is working as expected by applying the Collector configuration. These smoke tests apply certain Collector configurations in the Kubernetes cluster and assert whether they were created and are running in the desired state.
I set up the KUTTL smoke tests environment in GitHub workflows (refer to PR 62), which ensures all the testing happens automatically. Within the GitHub workflow, I run the KUTTL tests with the following steps:
- Set up a kind Kubernetes cluster.
- Install the Operator Helm chart to the kind cluster.
- Clone the Operator repository to the workspace.
- Run all the smoke test under
opentelemetry-operator/tests/e2edirectory.
The benefit of running the KUTTL tests using GitHub workflows is that every time maintainers make any change to the Operator Helm chart, these smoke tests will run against the chart when a pull request is filed. This setup ensures that the Operator Helm chart is fully functioned. If these smoke tests don’t pass, the GitHub CI workflow will alert and the pull request will not be merged into the Helm chart repository.
Unit tests
Unit tests are essential for testing any release automation code. I unit tested every release function and edge case to ensure that the release code was working as expected. For release functions that update the values.yaml and Chart.yaml, I used mock files to run the unit tests and make sure that these files were not affected by the testing.
How to use this Operator Helm chart
You can find the open source OpenTelemetry Operator Helm chart on GitHub. For a tutorial, refer to the Getting Started with the AWS Distro for OpenTelemetry Collector article on the ADOT website.
In this section, I will walk through the required steps for using the Operator Helm chart. I have also provided a high-level picture of the end-to-end user experience.
You must complete the following three steps to see all the scraped metrics/traces telemetry data pouring into your desired destination.
- Configure your TLS certificate.
- The easiest and default method is to install the cert-manager. In this way, cert-manager will generate a self-signed certificate.
- If you have your desired CA or Issuer, you can also provide your own Issuer. See the getting started page on the ADOT website for detailed configuration guidance.
- Install the Operator Helm chart.
- Configure the ADOT Collector to scrape the telemetry data and ingest it to your appointed destination.
- The Collector can be deployed as one of four modes: Deployment, DaemonSet, StatefulSet, and Sidecar. For more detailed Collector configuration information and examples, refer to the getting started page on the ADOT website.
Figure 6 shows an end-to-end data path diagram that provides an overview of the capabilities of the Helm chart.

Figure 6: End-to-end data path of the OpenTelemetry Operator Helm chart.
AWS Distro for OpenTelemetry Operator integration
The second part of my project has been to integrate the OpenTelemetry Helm chart to manage the OpenTelemetry Operator into the AWS Distro for OpenTelemetry (ADOT) distribution. With this Operator, any AWS customer can use the ADOT Operator to manage Collector instances on their self-managed Kubernetes cluster, Kubernetes on Amazon Elastic Container Service (Amazon ECS), or Amazon Elastic Kubernetes Service (Amazon EKS). The ADOT Operator will reliably and securely ingest these metrics or trace telemetry data to the desired AWS-managed destinations, such as Amazon Managed Service for Prometheus, Amazon CloudWatch, or AWS X-Ray.
ADOT Operator image mirroring
This first challenge of this integration is that, because of AWS security and responsibility considerations, all of the container images must be pulled from the Amazon ECR public gallery. However, the Operator related images are stored at Quay and GCR. Thus, I needed to design and implement a stable and maintainable pipeline to mirror the images from those external repositories to the AWS Observability ECR public gallery.
The open source tool docker-mirror will mirror the repositories from the Docker Hub to Amazon ECR private registries. This tool implements the main functions that are useful for my goals; however, I need to address this tool’s limitations before I can use it. There are two limitations:
- docker-mirror only supports mirroring images from Docker Hub, not Quay nor GCR.
- docker-mirror only supports mirroring images to Amazon ECR private registries, not ECR public registries.
I decided to contribute to this tool and add all these supports first, then use this tool to mirror Operator images to the AWS Observability ECR public gallery. The two enhancements are PR 78 and PR 79. The ADOT Operator release is PR 592.
Figure 7 shows the sequence diagram of the docker-mirror tool after adding these supports.
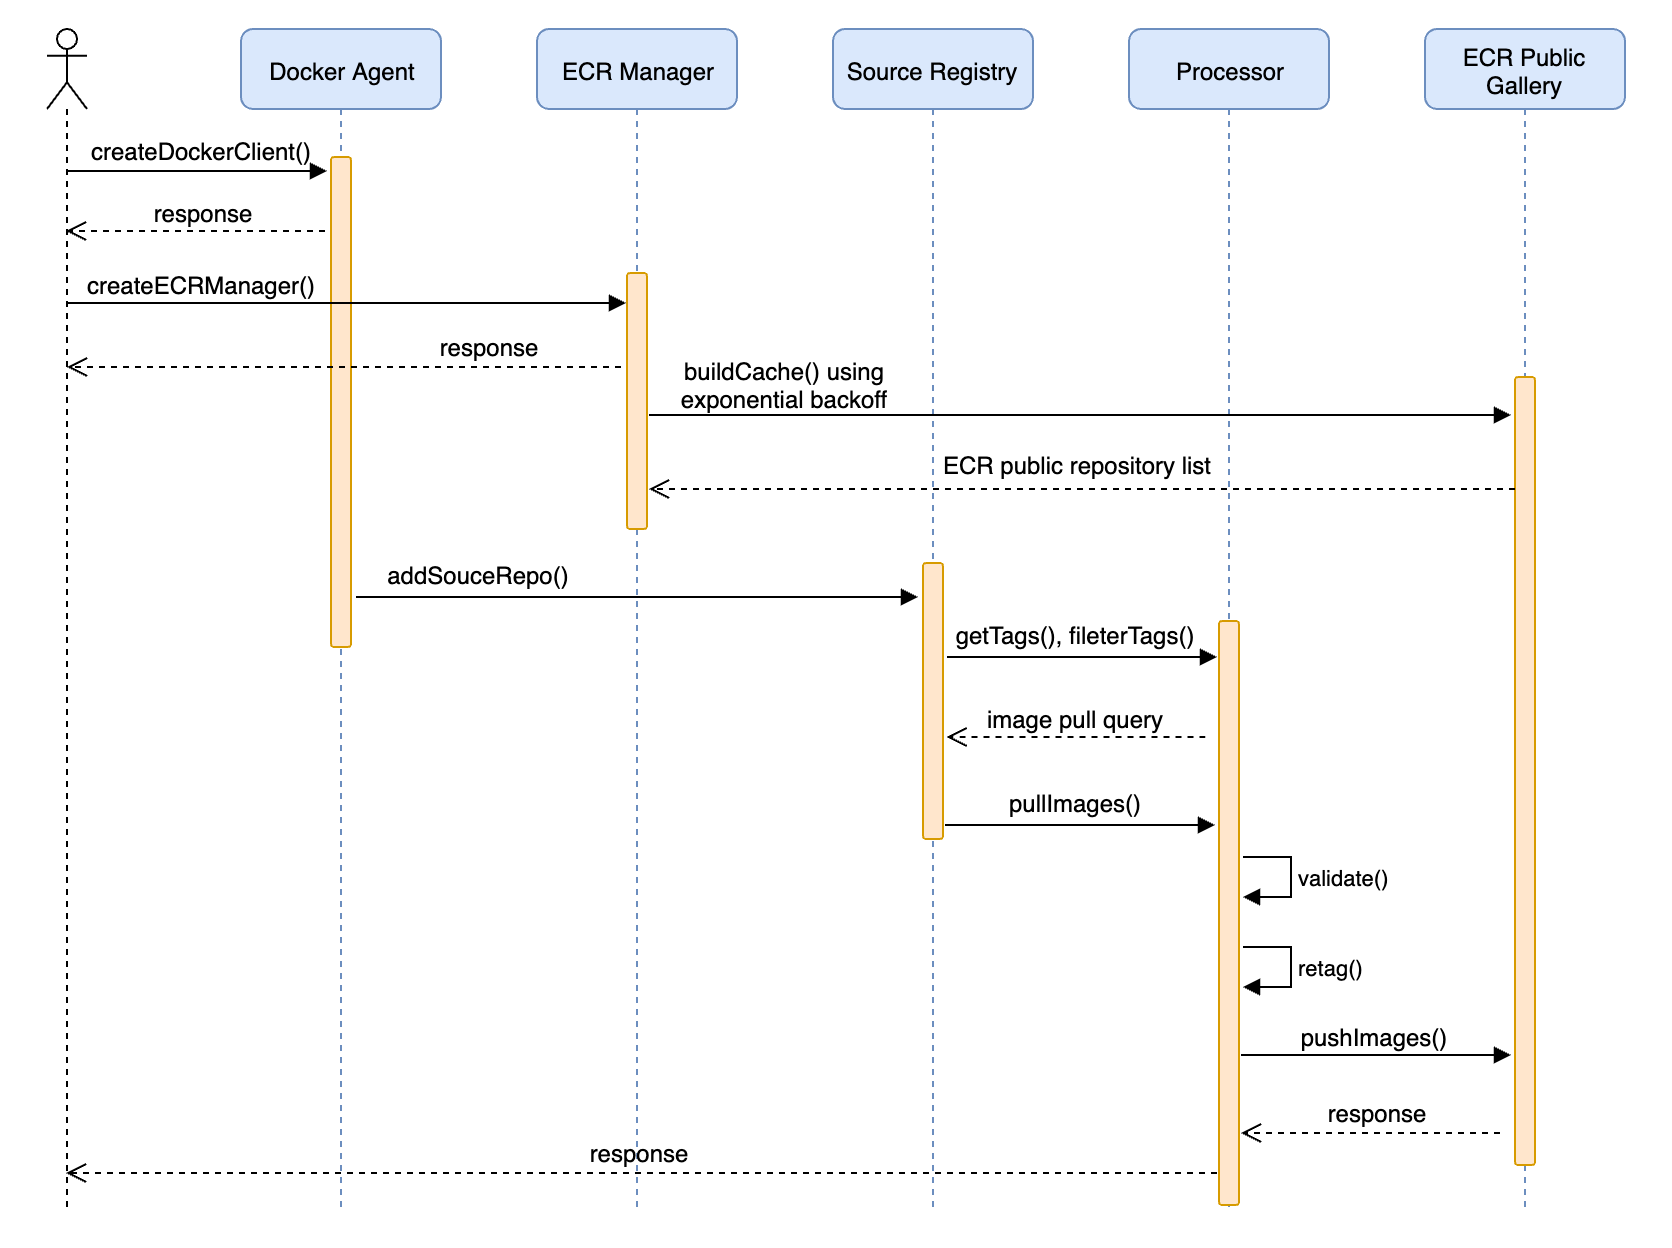
Figure 7: Workflow of the enhanced docker-mirror tool.
Conclusion
Throughout this project, I gained a lot of experience and knowledge in multiple areas. I gained experience working on large-scale open source projects. OpenTelemetry is a popular observability framework that includes tools, APIs, and SDKs. During my internship, I contributed to several repositories in the open source OpenTelemetry project, including opentelemetry-helm-charts, opentelemetry-collector, and opentelemetry-go.
I learned how to write design documents for large-scale projects at Amazon scale. I also learned how to implement prototypes to validate designs, how to gather feedback from the upstream maintainers and improve the code, and how to complete the integration of the project from an open source environment with AWS observability services.
Moreover, I learned that documentation is always as important as the code. At university, I focused on how to write the coolest code with the most efficient algorithm. But during this internship at AWS, I came to realize the importance of system design and software lifecycle management documentation in the industry. No matter how good your code is, it needs to be maintained in the long run. If you don’t provide detailed technical documents, then your code is not maintainable in complex systems.
For this project, I wrote the project design documents, technical READMEs for our users, a Getting Started guide for ADOT users, design evaluation documents, test plans, and a release checklist, and I communicated with different stakeholders across AWS and the OpenTelemetry community.
Additionally, I want to thank my manager, Alolita Sharma. I am always influenced and encouraged by her infinite energy and passion for open source and observability. She focuses not only on leading the team to deliver results but also on everyone’s individual growth. I feel lucky and happy to be a part of the observability team she leads.
I also thank the senior engineer in our team, Anthony Mirabella, who has helped me a lot from the project design to the testing strategy. I learned a lot of Kubernetes knowledge from him.
Finally, I appreciate everyone who has helped or unblocked me. This summer will be hard to forget and has been a great start for me to contribute to open source communities.

Shibo Wang
Shibo is a master’s degree computer science student at the University of Southern California. He is currently interning at AWS and is passionate about observability and cloud computing.