AWS Open Source Blog
Gathering insights on Kubernetes applications, services, and network traffic with Pixie
We often hear from our Amazon Elastic Kubernetes Service (Amazon EKS) users that adopting an open source observability stack is a top priority for their organizations. That’s why we are excited about Pixie, an Extended Berkeley Packet Filter (eBPF) powered, open source, observability platform for Kubernetes. New Relic is in the process of contributing Pixie to the Cloud Native Computing Foundation (CNCF). We are particularly enthusiastic about the programmability of the Pixie platform, as well as Pixie’s use of eBPF to provide rich, automatic visibility of application events. Pixie stores collected data directly on the users’ Kubernetes cluster.
Pixie makes observability easily accessible to developers. At Amazon Web Services (AWS), we share that vision, to provide every developer access to high-quality observability data with minimal effort. That’s why we’ve decided to partner with New Relic and contribute to the Pixie project. Jaana Dogan, AWS Principal Engineer, will be joining Pixie’s board. AWS is excited to collaborate with New Relic, a worldwide leader in observability, on this open source project.
Get started today
- Quick Start: Get started with self-managed or managed Pixie.
- Pixie Community Slack: Join the conversation and get assistance.
- Pixie GitHub: Star the repo to get project updates.
- Pixie Tutorial on EKSWorkshop.com: Walk through debugging a real-life HTTP and SQL bug.
- Pixie Monthly Meeting: Learn and see demos on the latest new features and connect with the team.
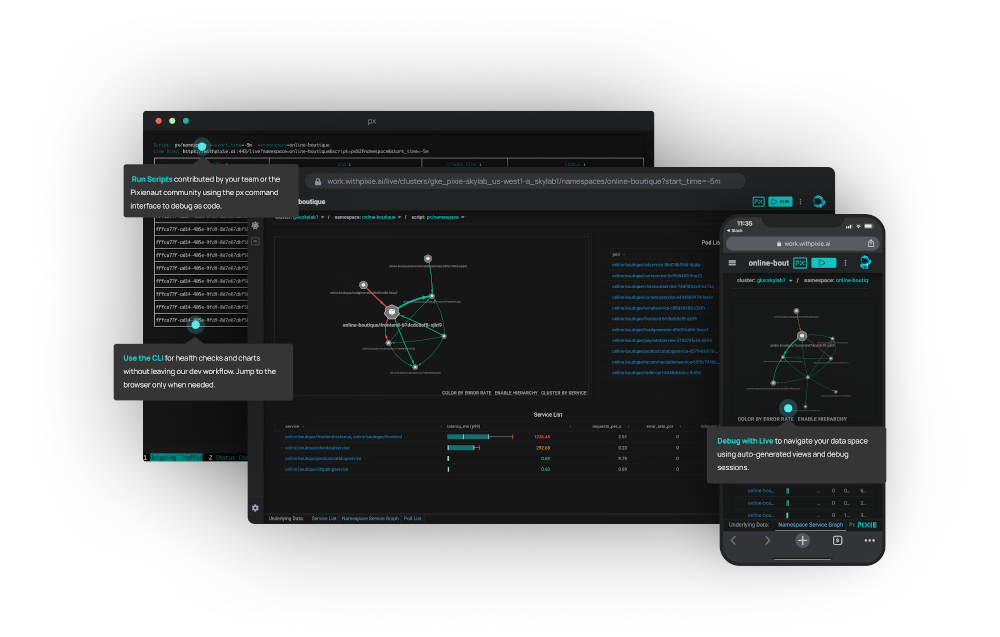
What is Pixie?
Pixie is an open source project providing a Kubernetes observability platform designed to help developers debug their production systems with minimal friction, driven by three major technical differentiators.
Auto-instrumentation
When a developer deploys Pixie, within seconds Pixie will automatically collect a variety of rich data sources: networking (HTTP, HTTP2, gRPC, TLS, TCP), database client diagnostics (MySQL, PostgreSQL, Cassandra, Redis), application profiles, and more, which developers can extend programmatically by writing scripts. None of this collection requires any manual instrumentation, with this experience provided “out of the box” through Pixie’s use of eBPF.
eBPF is a kernel technology (starting in Linux 4.x) that enables programs to run in the kernel itself, without having to change kernel source code or add additional kernel modules. Think of it as a lightweight, fully-sandboxed virtual machine (VM) inside the Linux kernel. eBPF programs are event based, and are executed on a specific hook, such as network events, system calls, function entries, and kernel tracepoints. Check out the AWS re:Invent 2019 talk with Brendan Gregg to dive deeper.
Programmatic data access
Every view in Pixie is powered by a PxL script. PxL is Pixie’s Python-based language for querying data, inspired by the popular data tool Pandas. Because all data access in Pixie is programmatic, users can build fully customized views of their systems. PxL scripts work across Pixie’s UI, CLI, and API. Using the Pixie API, users can query Pixie programmatically. Pixie simplifies doing things such as exporting Pixie data to another tool or writing a Slackbot alert.
Kubernetes-native edge compute
Pixie runs entirely inside Kubernetes as a distributed machine data system, meaning you don’t need to transfer any data outside the cluster. Pixie’s architecture gives you a secure, cost-effective, and scalable way to access unlimited data, deploy AI/ML models at source, and set up streaming telemetry pipelines.
The rest of this blog post will show you how to get started with Pixie and, as an example, view slow SQL Queries. Check out the Pixie EKS Workshop to dive deeper.
Pixie in action: Finding slow SQL queries
Install Pixie’s CLI tool using the install script:
- Press Enter to accept the Terms & Conditions.
- Press Enter to accept the default install path.
- Visit the provided URL to sign up or sign in for a new Pixie account.
- Copy and paste the auth token generated in the browser into the CLI.
Deploy Pixie to your EKS Cluster using the px CLI:
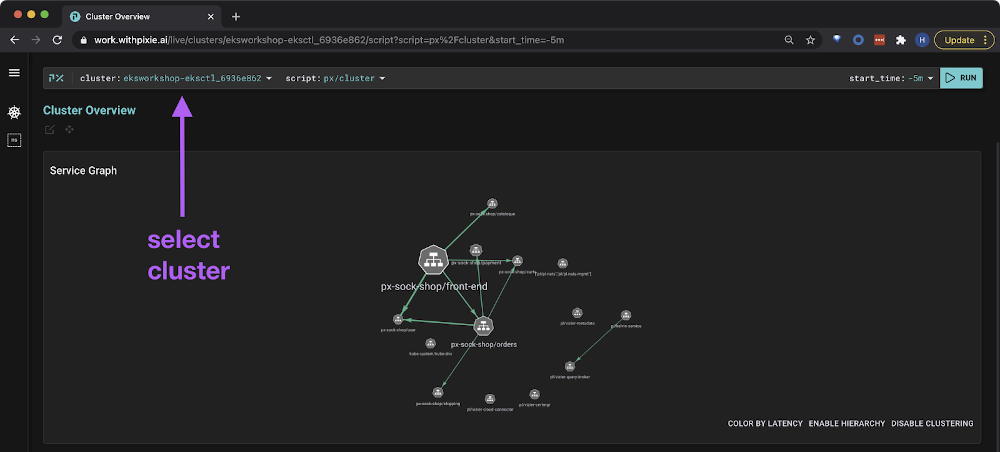
Now we navigate to the Pixie Console UI and select our EKS cluster in the drop-down menu.
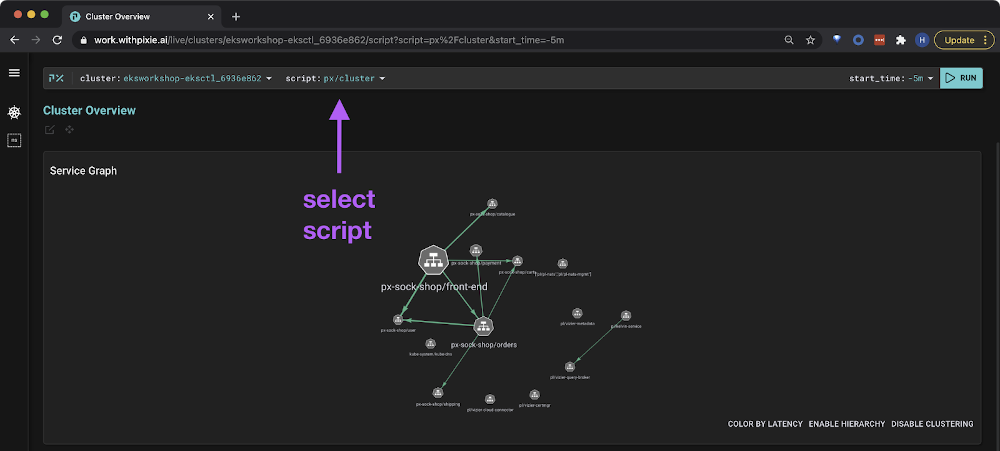
Then in the script drop-down, we select the px/mysql_data script.
This script shows us all the MySQL queries originating from our cluster to Amazon Relational Database Service (Amazon RDS), Amazon Aurora, or self-managed MySQL, without adding any MySQL-specific instrumentation in our pod or service.
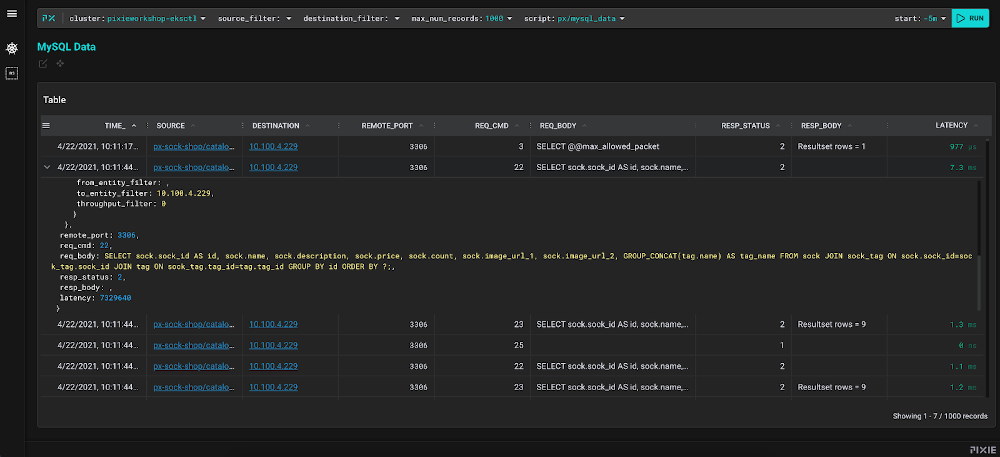
Switching the script to px/mysql_stats, we can view key latency stats on our SQL queries.
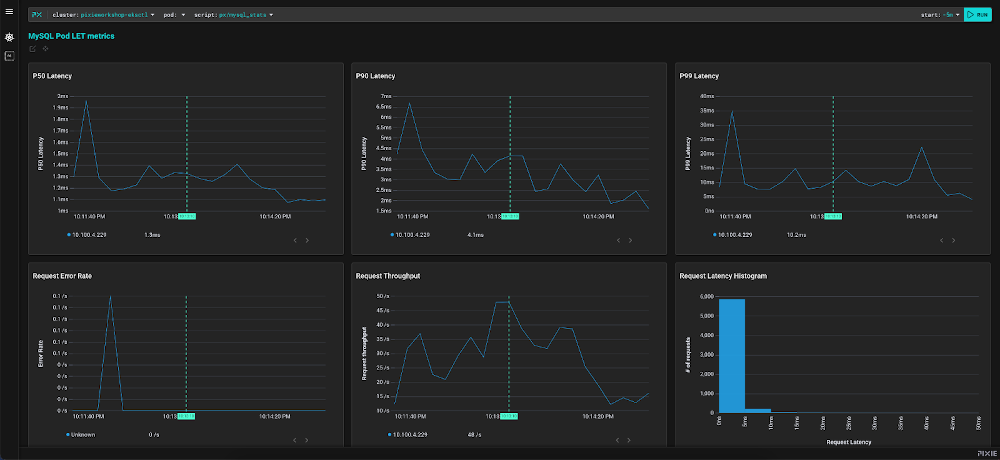
This is just one of the many use cases Pixie assists SREs, DevOps, and developers with, providing insights to Kubernetes networking (HTTP, HTTP2, gRPC, TLS, TCP), database client diagnostics (MySQL, PostgreSQL, Cassandra, Redis), HTTP events, database events, network statistics, application profiles, and much, more.
Dive deeper
- Quick Start: Get started with self-managed or managed Pixie.
- Pixie Community Slack: Join the conversation and get assistance.
- Pixie GitHub: Star the repo to get project updates.
- Pixie Tutorial on EKSWorkshop.com: Walk through debugging a real-life HTTP and SQL bug.
- Pixie Monthly Meeting: Learn & see demos on the latest new features and connect with the team.