AWS Open Source Blog
Heapothesys benchmark suite adds end-to-end timeliness metrics
Amazon Web Services (AWS) customers seek to assure consistent, reliable, and cost-efficient services. Assuring consistency includes reducing variance in transaction completion times. Assuring reliability requires that the rare transactions that do not complete within the service-specific target deadline do eventually complete in as short a time as possible. Cost efficiency drives service providers to process ever larger numbers of transactions with fewer CPU cores and less memory. Because the many AWS services that are implemented in Java deploy on Corretto JVM distributions of OpenJDK, a team of Amazon Corretto engineers has been working to enhance the throughput and responsiveness of web services that run on the Java Virtual Machine (JVM) by improving the OpenJDK implementation.
This article describes recent improvements to Heapothesys, an open source tool developed by Amazon’s JDK team for the purpose of identifying existing JVM weaknesses and performance bottlenecks. The tool also can quantify the degree to which proposed changes to the JVM may improve upon the existing implementation. Using the metrics produced by the tool, operations teams can more reliably predict the CPU and memory requirements for new JVM versions and different GC configurations, resulting in more consistent, reliable, and efficient services.
Heapothesys is a suite of synthetic workloads that simulate fundamental application characteristics in order to study the effects of garbage collection (GC) on application latency and throughput. Although the ultimate proof of value for a new GC technology depends on measurements taken on production deployments of actual services responding to real customer requests, the Heapothesys synthetic workloads simplify development and accelerate availability of improved technologies. Unlike real-world service workloads, a Heapothesys workload:
- Can run standalone, without the need to orchestrate a complex distributed network of real-world clients to drive service requests.
- Is easily repeatable, so experiments with alternative JVM configurations and alternative GC implementations can be sure to compare identical workloads. Repeatability is also of great value when debugging problems with the implementation of a new GC technology.
- Can be shared with JVM and GC researchers and developers, without concern that confidential client data might be compromised.
- Can be added to a suite of performance and latency regression tests to reduce the risk that incremental changes to JVM implementations will cause service degradation.
A new workload, Extremem, has been added to the Heapothesys suite. This new workload more closely resembles typical cloud services than previously available Heapothesys workloads. Extremem is structured as a configurable number of server threads and client threads, all running on the same JVM. The size of the in-memory database and the frequency and complexity of client requests are also configurable. As the purpose of Extremem is to facilitate analysis of GC impacts on service behavior, the workload is designed to allow configuration of very high allocation rates with object lifespan distributions also determined by configuration parameters.
Each Extremem run tabulates response times for the complete spectrum of time-critical activities associated with the synthetic workload and reports averages, maximums, and distributions over the range of all measurements for each time-critical activity. Extremem improves visibility into the latency and throughput impact of GC activities on service threads and helps clarify the impact of heavy service loads on GC performance.
Besides exercising various forms of contention between service and garbage collection threads, Extremem can be configured to model a broad spectrum of real-world service scenarios. With the appropriate configuration parameters selected, the workload can represent high or low rates of ephemeral allocations, intermediate-lived allocations, and long-lived allocations; various object lifespan demographics; and various ratios of memory management operations (allocations, initializations, and deallocations) to computation and data access operations. Developers responsible for deployment of time-critical services can use Extremem to evaluate differences between alternative GC algorithms and configuration choices.
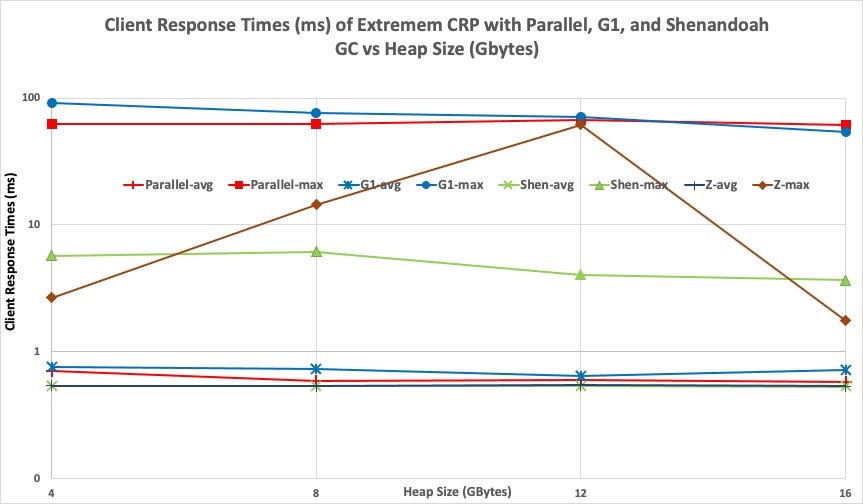
The following figure illustrates the timeliness information made available by running an Extremem workload with multiple JVM configurations.
Customer value
Extremem addresses a broad assortment of needs, delivering distinct value to different customers.
- DevOps teams: For all cloud services that run completely or partially on top of a JVM, Extremem enables superior JVM tuning, enhances understanding of transient work overload conditions, and facilitates development of reliable mitigation strategies to prevent undesirable behavior during system overload. In a broader context, Extremem empowers DevOps teams to more clearly and effectively communicate their needs for JVM improvements to the JVM and GC engineering teams who are in the best position to provide these improvements. Ultimately, cloud service providers also benefit from everything that Extremem offers to improve the effectiveness of GC and JVM engineering work.
- GC and JVM engineers: Engineers working to make improvements to the JVM, and to GC in particular, need workloads that represent the full diversity and complexity of relevant customer workloads. They need workloads that can be easily exercised. They need workloads whose results are repeatable, both to facilitate deep dive analysis of performance and latency tradeoffs and to simplify debugging of any problems that surface. Extremem addresses all of these customer requirements.
- JVM maintainers: With hundreds of engineers working in concert to make improvements to the JVM and standard Java libraries, changes to one part of the implementation often result in unintended and unwanted degradation of performance or response latency. Using multiple Extremem workload configurations to capture the diverse performance and latency requirements of distinct customers in standard test suites, we can now more effectively track progress and prevent regression of JVM performance and latency.
Using Extremem
All of the source code for the Heapothesys suite of synthetic workloads is available under open source licensing terms in the GitHub repository. Sample command-line invocations for Extremem workloads are provided in the Extremem/README.md file of that repository. A future blog post will describe the process of building Extremem configurations that resemble particular real-world services in order to use the Extremem workload as a proxy for that service.
Workload overview
The Extremem workload is structured as a simplified simulation of an online retail experience. Certain threads are dedicated to simulating customer behaviors. Other threads are dedicated to simulating online retailer behaviors. Extremem’s representation of online retail service behaviors is entirely fictional. Extremem collects measurements representing the times required to perform particular simulated activities. To support repeatability of simulations, the same seed for random number generation is used with each run. The activities performed by a simulated customer include:
- Preparing to make a purchase. This activity consists of formulating a query of randomly selected keywords and searching the product database indexes to obtain one list of products that match all of the keywords and a second list of products that match any of the keywords. A third list representing products that this same customer had previously saved for possible future purchases is also generated. These three lists represent the candidate products to be presented for consideration by the customer. Each product in each of the three lists is represented by a newly allocated proposed sales transaction object. Each sales transaction object includes a randomly generated product review. A second set of randomly generated selection keywords is then generated. This list of selection keywords will be compared against product review information to determine which of the various candidate products will receive further customer attention.
- Purchasing a product. This activity consists of ranking all candidate products according to how well the associated product reviews match the product selection keywords chosen in step 1, deciding to purchase the product that best matches the product selection keywords, and placing the selected sales transaction object onto a queue of pending sales transactions so that the sale can be fulfilled at a later time by a background server thread. All of the other candidate sales transaction objects are now eligible to be reclaimed by the garbage collector.
- Saving a product for later. This step consists of ranking all candidate products according to how well the associated product reviews match the product selection keywords chosen in step 1, deciding to save this product for a possible future purchase, instantiating a browsing history object, and saving this browsing history object along with a browsing history expiration time as part of this customer’s representation.
- Abandoning all products. This consists of ranking all candidate products according to how well the associated product reviews match the product selection keywords chosen in step 1 and deciding that there is no further interest in purchasing any of these products now or in the future.
- Doing nothing. This activity, which is reported as a loss of sale, consists of discovering that there are no candidate products returned from the inquiry performed during step 1 and that there is nothing further to be done.
Extremem performs retail services in batches that are serviced at scheduled times by background server threads. Timeliness reports represent the time at which each batch of work is completed relative to the time at which the batch processing was scheduled to begin. The activities performed by background server threads of the simulated web storefront consist of:
- Processing sales transactions. This activity consists of pulling all pending sales transactions that were previously queued and updating the associated customer’s information to reflect that the purchase has been completed. Thereafter, the sales transaction can be garbage collected. The number of pending sales transactions processed in each batch is variable, depending on how many new sales were logged since the previous batch of sales transactions was processed.
- Expiring browser histories. This consists of pulling all browsing history objects whose expiration time has been reached from the browsing history expiration queue and removing each associated browsing history from its associated customer representation. Thereafter, the browsing history object can be garbage collected. The number of browsing history objects that are expired in each batch is variable, depending on how many products were saved for later consideration in the recent past.
- Customer replacement processing. This step consists of purging a number of customers from the customer database and replacing each removed customer with a newly created customer. Each customer is identified by a unique long integer ID number and a randomly generated String name. Purged customer objects are now eligible for garbage collection. The number of customers replaced in each batch and the period between customer replacement processing are both specified as part of the workload configuration. Thus, the number of customers processed in each batch is identical.
- Product replacement processing. This consists of purging a number of products from the product database and replacing each removed product with a newly created one. Each product is identified by a unique long integer ID number, a randomly generated String name, and a randomly generated String product description. Search indexes are maintained for looking up products by keywords that match product names or descriptions. These indexes are updated when a product is removed or added. Because product names and descriptions are much longer than customer names, and because indexing data structures must be updated when products are replaced, product replacement processing involves much more effort than customer replacement processing. The number of products replaced in each batch and the period between product replacement processing are both specified as part of the workload configuration. The number of products processed in each batch is identical.
- Do nothing processing. This activity is roughly equivalent to a jHiccup monitor. Depending on the frequency at which other background server responsibilities are triggered, server threads often awaken to discover there is no work to be done. Even in this case, the server will check to see whether it is on schedule or behind.
Extremem timeliness reports
All the experimental results reported in this section were gathered on a Graviton2 ARM64 host with 8 cores. The JVM was amazon-corretto-15.0.1.9.1.
The simplest Extremem output format is an ASCII-formatted histogram that reports response time distributions for each of the activities described above. An example histogram report for the customer replacement processing of a particular Extremem configuration based on using Parallel GC and a 4 GB heap is shown below:
The above report shows that the large majority of customer replacement processing batches occur within 1.792 ms, corresponding to the first reporting bucket. This bucket represents 16,384 + 2,048 + 1,024 + 256 + 128 + 64 + 16 = 19,920 total responses.
The complete histogram provides tallies for 64 columns, spanning the range from 0 to 114.688 ms, with each column spanning a range of 1.792 ms. Note that the second column tallies only four entries, the third represents 0, the fourth represents 1, and so on. By comparing results gathered for other garbage collection approaches, it is clear that all 80 of the measurements reported in columns 2-64 of the histogram experienced some amount of interference from garbage collection. The maximum observed GC interference resulted in a response time of 64.989 ms. Note that this is the single entry tabulated in the histogram bucket representing responses in the range from 64.512 to 66.304 ms.
Compare the above with the report for G1 GC with 4 GB heap:
Although the average response time for customer replacement processing is similar between G1 GC and Parallel GC (806 us vs. 676 us), G1 has higher variance, with 30 measurements instead of one experiencing response latencies longer than 43.008 ms. The longest response time observed with G1 is 71.981 ms vs 64.989 ms with Parallel GC. When comparing the histograms for Parallel and G1 GC, it is important to recognize that the columns of the G1 GC report each represent a wider span of response times than for the Parallel GC report. Note that the Parallel GC report’s first column of width 1.792 ms holds 19,920 entries whereas the G1 GC report’s first column of width 2.048 ms holds only 19,838 (82 fewer) entries. This highlights that a larger percentage of service responses do not experience GC interference with Parallel GC.
Compare the preceding two charts with the report for the same workload running with Shenandoah GC:
Customer replacement processing:
Note that the scale of the X axis is different for this report. Here, 64 buckets span 16.284 ms, with each bucket spanning 256 us. The first seven columns of this report represent the same time span as the first column of the Parallel GC report. Note that the average response time for the Shenandoah GC execution of this workload (539 us) represents a significant improvement over the average response time for Parallel GC and G1 GC. Even more impressive, the maximum response time for the Shenandoah GC execution (4.958 ms) is more than 13 times better than the maximum response time for the Parallel GC execution of this workload, and roughly 15 times better than the maximum response time for G1 GC.
We ran the same workload with the ZGC garbage collector, with the results shown below. With this particular experiment, both the ZGC average and max response times were close to the Shenandoah response times (541 vs. 539 us for averages, and 4.220 vs. 4.958 ms for maximums).
Running Extremem with different GC configurations makes the different throughput and latency characteristics of each collector clear. With G1 and Parallel GC, the large majority of client request responses occur without interference from GC. However, a significant portion of service requests (roughly 0.5% of them) overlap with STW GC phases. When these overlaps occur, the pauses experienced by the service are uniformly distributed over the duration of the STW time because the time at which the STW phase begins relative to the start of a transaction is essentially random.
During Shenandoah and ZGC passes, there is no single long STW pause. Instead, there is a series of short coordination pauses, each typically less than 10 ms. The large majority of transaction computations do not overlap with any of these short coordination pauses. Even when they do, the response time for that particular response will be only a few milliseconds longer than the typical response time. Because the typical computation time for this particular transaction is short (approximated by the average measured response time of 537 microseconds using Shenandoah GC) and because the concurrent GC phases between coordination GC pauses are relatively long (tens of ms), it is extremely rare that the computation for any particular service response experiences more than a single short coordination pause.
In another configuration mode, Extremem outputs its results as CSV (comma-separated value) data files, which can be imported into various spreadsheet programs. From there, further analysis can be performed and charts can be generated.
Figure 1, shown above, reports the measured response times for customer replacement processing with the Extremem configuration represented by the following command-line overrides:
For this chart, we repeated each 10-minute simulation experiment three times, averaging the reported average response times and taking the maximum of the reported maximum response times.
The JVM command-line options for Parallel GC are:
The JVM command-line options for using G1 GC are:
With Shenandoah, the JVM command-line options are:
For ZGC, the JVM command-line options are:
The execution environment did not support the use of large pages, so that option was not specified for any of the workload runs.
The average response times across all heap sizes are slightly better with Shenandoah and ZGC than with Parallel GC and G1 GC. Shenandoah and ZGC offer significantly better maximum measured latencies than Parallel GC and G1 GC, except with the 12 GB heap, for which ZGC maximum response time (61.846 ms) was almost as large as with Parallel GC (67.151 ms) and G1 GC (70.884 ms).
The Extremem results do not explain why ZGC has better maximum latencies than Shenandoah with 4 GB and 16 GB heaps, but worse maximum latencies with 8 GB and 12 GB heaps. Answering that question requires further analysis. To explore further, rerun the same Extremem workload configurations with GC logging enabled. Examine the contents of the ZGC and Shenandoah logs to understand how each is behaving differently with different heap sizes.
Acknowledgements
Thanks to Richard Boyd, Niall Connaughton, Yishai Galatzer, Paul Hohensee, Azeem Jiva, William Kemper, Roman Kennke, Emil Lerch, Bernd Mathiske, and Volker Simonis for reviews, comments, and suggested improvements to the implementation and this description of Extremem.
License
Extremem is licensed under the Apache 2.0 License. We welcome bug reports, suggestions, feedback, and contributions at the Heapothesys GitHub page.