AWS Big Data Blog
Introducing Auto-Tune in Amazon ES
September 8, 2021: Amazon Elasticsearch Service has been renamed to Amazon OpenSearch Service. See details.
Today we announced Auto-Tune in Amazon OpenSearch Service, an innovation undertaken to automatically optimize resources in Elasticsearch clusters to improve its performance and availability. Auto-Tune gives us a unique opportunity of applying our learnings from operating clusters at cloud scale on our service to make the Elasticsearch core engine more performant and resilient.
Elasticsearch powers diverse use cases such as curated search and relevance ranking, log analytics, incident response (SIEM), time series data stores, or metrics for telemetry. These use cases have different performance and scaling characteristics, and use Elasticsearch features in multiple ways. Although heuristics and best practices provide a good starting point, there is no one size that fits all. With constantly evolving workloads, tuning your configuration to the specific needs of a cluster has significant performance and stability implications. However, Elasticsearch has several settings that are highly interdependent, and sometimes difficult to tune manually. Auto-Tune for Amazon OpenSearch Service addresses this through an adaptive resource management system that automatically adjusts Elasticsearch internal settings to match dynamic workloads, optimizing cluster resources to improve efficiency and performance.
In this release, we focus on tuning the memory configurations in Elasticsearch clusters. Elasticsearch runs in a Java virtual machine (JVM), and tuning the memory settings is critical to support fluctuating ingest volumes and search workloads. This post summarizes different parts of the Java heap monitored and tuned by Auto-Tune.
Adaptive resource management
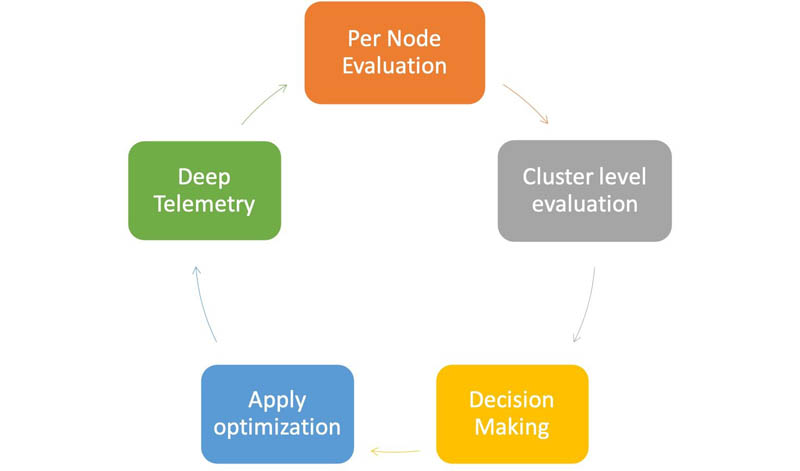
Auto-Tune’s adaptive resource management is a closed loop control system running on every cluster. The input to this system are fine-grained metrics from OS, JVM, and the Elasticsearch cluster, provided by the Open Distro for Elasticsearch Performance Analyzer plugin. These metrics are processed in real time and fed into a distributed decision tree that performs local evaluations on each node. The results from these evaluations are consumed by a decision-maker component on the leader node, which converts the observations into appropriate auto-tuning actions. The system prioritizes stability over performance, providing resilient systems that scale. Auto-Tune is built upon our learnings from operating clusters in the service, and lessons shared by the community. The following diagram illustrates the feedback control loop.

Memory configurations
Auto-Tune automatically increases or decreases the size of the following cluster resources to match the application workloads.
Search and write thread pool queues
In ideal queuing theory, if all requests were identical and took the same time to process, queues would move at a steady pace with little need for tuning. In practice, actual requests vary in their CPU requirement, memory consumption, and the amount of data processed. Even similar requests, like bulk writes with similarly sized documents, can have varied processing times due to thread scheduling, and background jobs like garbage collection or segment merging, contesting for CPU cycles.
Practical workloads are “bursty” in nature. In a cluster with sufficient resources, larger queues can lead to fewer rejections and higher throughput. In contrast, if more requests are placed in a cluster that is already saturated due to memory and CPU contention, it overloads the systems; the requests get backed up, which increases the latency. In such cases, an early rejection of incoming requests alleviates the pressure on the system. Auto-Tune monitors and adjusts thread pool queue sizes to get the best throughput possible with a stable cluster. The default values for search and bulk queues in versions prior to Elasticsearch 7.9 are 1,000 and 200, respectively. Auto-Tune adjusts these values based on the ingest and query workload patterns.
Field data cache
The field data cache speeds up aggregation queries by caching field data for text aggregations, and global ordinal mappings for keywords, in an on-heap data structure. Because these values are expensive to build, Elasticsearch doesn’t evict them automatically, unless the field data cache has reached its maximum allowed size. By default, the cache is unbounded. Auto-Tune right-sizes the cache, optimizing the cluster for faster aggregations when relevant, while freeing up precious resources held by a dated workload pattern. As of this writing, the field data cache size is unbounded on all Amazon OpenSearch Service versions.
Shard request cache
The shard request cache speeds up frequently made search queries by caching local search results from a shard. This is particularly useful for workloads with a consistent query pattern, and shards that aren’t frequently updated, such as shards in a rolled over index. Auto-Tune monitors cache-specific metrics to optimize the request cache for best performance. The default value of the shard request cache is 1% of the JVM heap size.
JVM generation sizing
Earlier versions of Elasticsearch used CMS for garbage collection; latter versions have moved to G1GC. The CMS garbage collector is a generational garbage collection system, with heap space partitioned into young and old generations for short-lived and long-lived objects, respectively. Configuring the right young-to-old generation size ratio can be very specific to the nature of your workload and the kind of objects it creates.
By default, the JVM configures this ratio on an internal heuristic based on the number of CPU cores available to the JVM. Auto-Tune monitors multiple JVMs, memory, and garbage collection-related metrics to determine an appropriate ratio for the cluster memory. These tuning actions require a JVM restart.
JVM heap sizing
Auto-Tune also evaluates if adding more heap space to the Elasticsearch JVM would benefit the cluster. We have observed in our fleet that one of the tuning actions that involves scaling up the heap size and switching garbage collection to G1 works better with larger heap sizes.
Clear cache
Finally, the clear cache action is a memory reclaiming operation, applied only when the cluster’s heap is extremely contended. This action clears all caches to free up memory to stabilize the cluster.
Getting started with Auto-Tune
You can enable Auto-Tune via the AWS Management Console, AWS Command Line Interface (AWS CLI), or SDK. You can classify Auto-Tune actions as implicit or scheduled. Implicit actions are dynamically applied to your cluster without restarting the Elasticsearch server process. Queue and cache tuning actions are implicit actions. After you enable Auto-Tune, the system automatically applies queue and cache tunings when the decision tree identifies an opportunity to improve stability or performance. JVM changes require Elasticsearch restart and therefore need to be scheduled. The system applies JVM generation sizing or JVM heap size tunings during a defined maintenance window. You can define a recurring or one-time maintenance window. For domains with Auto-Tune disabled, you can still use the console notifications when relevant tuning actions are available. You can also track Auto-Tune actions via Amazon CloudWatch metrics.
The following screenshot illustrates a JVM young generation tuning recommendation to apply at the next maintenance window opportunity.

The system also notifies you when a scheduled tuning begins and is complete, as shown in the following screenshot.

Results
In this section, we present some metrics from production workloads that were tuned by Auto-Tune actions. The following plots show the effect of generation size tuning on a production cluster.
The first plot shows a sawtooth pattern with JVM occupancy in the old generation space before Auto-Tune actions started on March 6, 2021 at 18:00. This sawtooth pattern indicates that the number of short-lived objects created by the search workload got promoted unnecessarily to the old generation space due to a small young generation size. With Auto-Tune tuning, the max and average JVM usage dropped to 1/4th of the previous levels.

The following plot shows the impact of garbage collection threads on CPU usage. Prior to Auto-Tune, CPU was consumed by garbage collector threads (shown in green). After tuning, more cycles were dedicated to the important function of shard query (shown in pink) on the nodes.

The following plot shows JVM improvements where the heap was reconfigured to a larger size and the garbage collector was switched to G1GC. The overall max heap usage, which was peaking to almost 100%, dropped approximately by 50%.

The goal of the resource management system is to optimize the memory utilization of the existing nodes in the cluster. However, if the workloads completely saturate the cluster’s resource limits, only scaling nodes can help balance the cluster. For example, we noticed that when generation size tuning optimized garbage collection overhead, in some clusters, it also exposed a much-contended heap, requiring the cluster to scale appropriately.
Conclusion
We observed that tuning heap sizes, bulk queue sizes, and garbage collection settings bolsters ingestion throughput; changing cache sizes improves tail latency for searches; and adjusting read and bulk queue sizes can lead to fewer rejections and higher availability for search and ingest workloads.
But this is just the tip of the iceberg. The self-adapting closed feedback loop paves the way for exciting possibilities. Auto-Tune monitors the resource footprint at each shard, index, and thread-level granularity. In the months to come, we plan to extend this framework to provide better insights and resources to manage clusters effectively. We’re excited to bring our domain knowledge and operational expertise to build the next generation of adaptive cloud computing for our customers.
We would like to thank all our fellow engineers at AWS who made this launch possible. Special shoutout to Ruizhen Guo, Khushboo Rajput, Karthik Kumarguru, Govind Kamat, Sruti Partibhan, Yujia Sun, Ricardo Stephen, Kalyan Chintalapati, Kishore Bandaru, Drew Wei, Madhusudhan Narayana, Praneeth Bala, Jiasheng Qin, Olanre Okunlola, and Jiaming Ji.
About the authors
 Vigya Sharma is a Senior Software Engineer at Amazon Web Services. Vigya is passionate about distributed systems and likes to solve problems around large-scale systems.
 Joydeep Sinha is a Senior Software Engineer working on search services at Amazon Web Services. He is interested in distributed and autonomous databases.
 Paul White is a Senior Software Engineer working on search services at Amazon Web Services. He is interested in distributed and autonomous systems.
 Balaji Kannan is an Engineering Manager working on search services at Amazon Web Services.
 Karthik Mohanasundaram is an Engineering Manager working on search services at Amazon Web Services.