AWS News Blog
Cross-Account Cross-Region Dashboards with Amazon CloudWatch
|
|
Best practices for AWS cloud deployments include the use of multiple accounts and/or multiple regions. Multiple accounts provide a security and billing boundary that isolates resources and reduces the impact of issues. Multiple regions ensures a high degree of isolation, low latency for end users, and data resiliency of applications. These best practices can come with monitoring and troubleshooting complications.
Centralized operations teams, DevOps engineers, and service owners need to monitor, troubleshoot, and analyze applications running in multiple regions and in many accounts. If an alarm is received an on-call engineer likely needs to login to a dashboard to diagnose the issue and might also need to login to other accounts to view additional dashboards for multiple application components or dependencies. Service owners need visibility of application resources, shared resources, or cross-application dependencies that can impact service availability. Using multiple accounts and/or multiple regions can make it challenging to correlate between components for root cause analysis and increase the time to resolution.
Announced today, Amazon CloudWatch cross-account cross-region dashboards enable customers to create high level operational dashboards and utilize one-click drill-downs into more specific dashboards in different accounts, without having to log in and out of different accounts or switch regions. The ability to visualize, aggregate, and summarize performance and operational data across accounts and regions helps reduce friction and thus assists in reducing time to resolution. Cross-Account Cross-Region can also be used purely for navigation, without building dashboards, if I’m only interested in viewing alarms/resources/metrics in other accounts and/or regions for example.
Amazon CloudWatch Cross-Account Cross-Region Dashboards Account Setup
Getting started with cross-account cross-region dashboards is easy and I also have the choice of integrating with AWS Organizations if I wish. By using Organizations to manage and govern multiple AWS accounts I can use the CloudWatch console to navigate between Amazon CloudWatch dashboards, metrics and alarms, in any account in my organization, without logging in, as I’ll show in this post. I can also of course just set up cross-region dashboards for a single account. In this post I’ll be making use of the integration with Organizations.
To support this blog post, I’ve already created an organization and invited, using the Organizations console, several other of my accounts to join. As noted, using Organizations makes it easy for me to select accounts later when I’m configuring my dashboards. I could also choose to not use Organizations and pre-populate a custom account selector, so that I don’t need to remember accounts, or enter the account IDs manually when I need them, as I build my dashboard. You can read more on how to set up an organization in the AWS Organizations User Guide. With my organization set up I’m ready to start configuring the accounts.
My first task is to identify and configure the account in which I will create a dashboard – this is my monitoring account (and I can have more than one). Secondly, I need to identify the accounts (known as member accounts in Organizations) that I want to monitor – these accounts will be configured to share data with my monitoring account. My monitoring account requires a Service Linked Role (SLR) to permit CloudWatch to assume a role in each member account. The console will automatically create this role when I enable the cross-account cross-region option. To set up each member account I need to enable data sharing, from within the account, with the monitoring account(s).
Starting with my monitoring account, from the CloudWatch console home, I select Settings in the navigation panel to the left. Cross-Account Cross-Region is shown at the top of the page and I click Configure to get started.

This takes me to a settings screen that I’ll also use in my member accounts to enable data sharing. For now, in my monitoring account, I want to click the Edit option to view my cross-account cross-region options:

The final step for my monitoring account is to enable the AWS Organization account selector option. This will require an additional role be deployed to the master account for the organization to permit the account to access the account list in the organization. The console will guide me through this process for the master account.

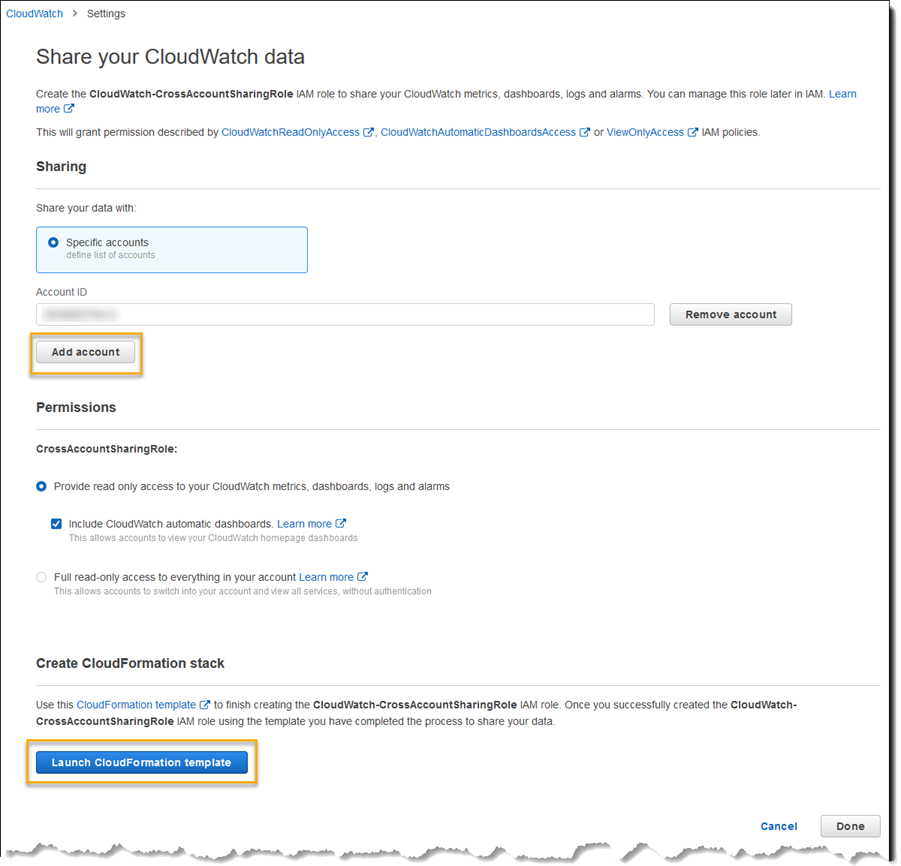
This concludes set up for my monitoring account and I can now switch focus to my member accounts and enable data sharing. To do this, I log out of my monitoring account and for each member account, log in and navigate to the CloudWatch console and again click Settings before clicking Configure under Cross-Account Cross-Region, as shown earlier. This time I click Share data, enter the IDs of the monitoring account(s) I want to share data with and set the scope of the sharing (read-only access to my CloudWatch data or full read-only access to my account), and then launch a CloudFormation stack with a predefined template to complete the process. Note that I can also elect to share my data with all accounts in the organization. How to do this is detailed in the documentation.

That completes configuration of both my monitoring account and the member accounts that my monitoring account will be able to access to obtain CloudWatch data for my resources. I can now proceed to create one or more dashboards in my monitoring account.
Configuring Cross-Account Cross-Region Dashboards
With account configuration complete it’s time to create a dashboard! In my member accounts I am running several EC2 instances, in different regions. One member account has one Windows and one Linux instance running in US West (Oregon). My second member account is running three Windows instances in an AWS Auto Scaling group in US East (Ohio). I’d like to create a dashboard giving me insight into CPU and network utilization for all these instances across both accounts and both regions.
To get started I log into the AWS console with my monitoring account and navigate to the CloudWatch console home, click Dashboards, then Create dashboard. Note the new account ID and region fields at the top of the page – now that cross-account cross-region access has been configured I can also perform ad-hoc inspection across accounts and/or regions without constructing a dashboard.

I first give the dashboard a name – I chose Compute – and then select Add widget to add my first set of metrics for CPU utilization. I chose a Line widget and clicked Configure. This takes me to an Add metric graph dialog and I can select the account and regions to pull metrics from into my dashboard.

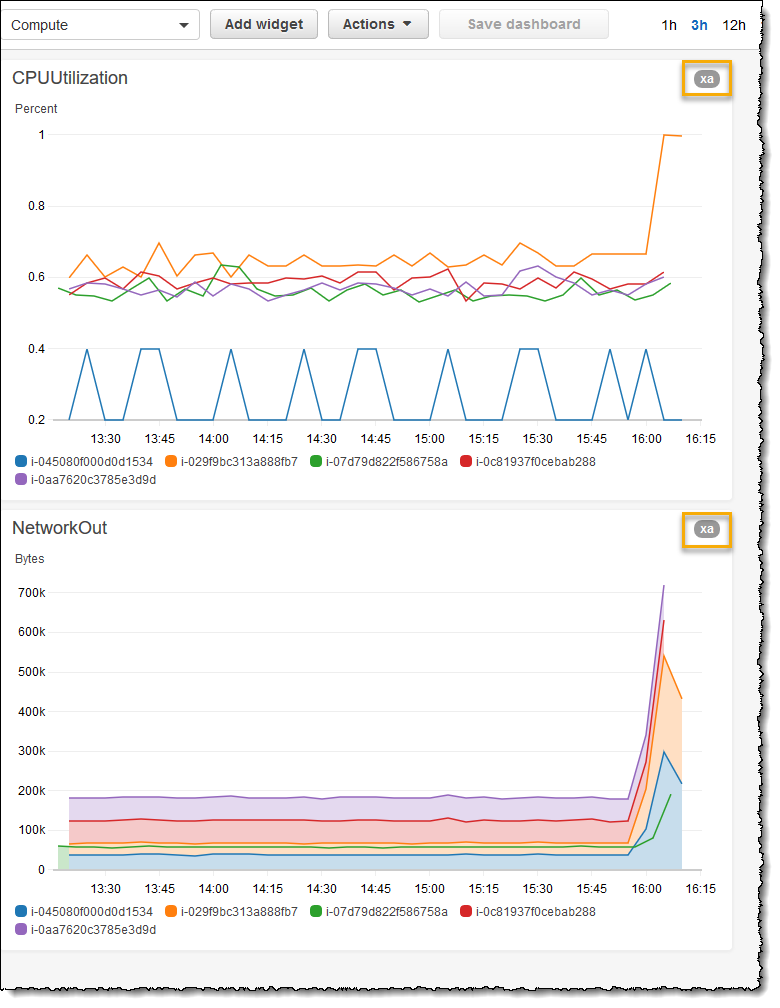
With the account and region selected, I can proceed to select the relevant metrics for my instances and can add all my instances for my monitoring account in the two different regions. Switching accounts, and region, I repeat for the instances in my member accounts. I then add another widget, this time a Stacked area, for inbound network traffic, again selecting the instances of interest in each of my accounts and regions. Finally I click Save dashboard. The end result is a dashboard showing CPU utilization and network traffic for my 4 instances and one cluster across the accounts and regions (note the xa indicator in the top right of each widget, denoting this is representing data from multiple accounts and regions).

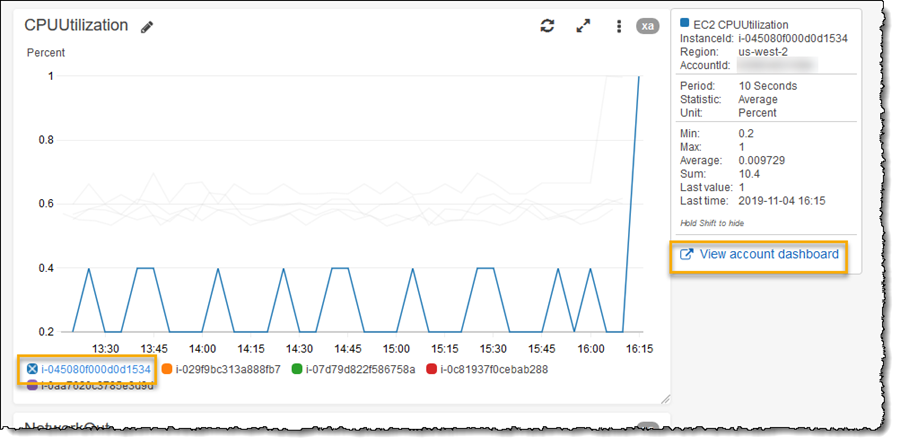
Hovering over a particular instance triggers a fly-out with additional data, and a deep link that will open the CloudWatch homepage in the account and region of the metric:
Availability
Amazon CloudWatch cross-account cross-region dashboards are available for use today in all commercial AWS regions and you can take advantage of the integration with AWS Organizations in those regions where Organizations is available.


