AWS Big Data Blog
Amazon QuickSight Announces General Availability of ML Insights
At re:Invent 2018, we announced the preview of ML Insights, a set of out-of-the-box machine learning and natural language features that provide Amazon QuickSight users with business insights beyond visualization. Today, we are announcing the general availability of ML Insights.
As the volume of data that customers generate continues to grow every day, it’s becoming more challenging to harness that data for business insights. This is where machine learning comes into play. Amazon is a pioneer in using machine learning to automate and scale various aspects of business analytics.
With new ML Insights features, Amazon QuickSight can help you discover hidden data trends, identify key business drivers, forecast future results, and summarize your data in easy-to-read, natural language narratives, saving hours of manual analysis and investigation. You can build comprehensive BI solutions that integrate out-of-the-box machine learning with the analytical richness of Amazon QuickSight and distribute interactive dashboards to everyone in your organization. ML Insights makes machine learning easy, allowing anyone regardless of their technical and ML skillset to easily get insights from their data in minutes rather than weeks. ML Insights features include:
- ML-powered anomaly detection to uncover hidden insights by continuously analyzing billions of data points.
- ML-powered forecasting to predict growth and business trends with point-and-click simplicity.
- Auto-narratives to tell customers the story of their dashboard using plain-language narratives.
Check out this video to get a quick overview of ML Insights:
To get you started with ML Insights, this blog post will walk you through new ML-powered capabilities.
Customer use cases
During the past three months of ML Insights preview availably, customers from a broad range of industries, including telecommunication, entertainment, marketing, retail, energy, financial services, and healthcare, have used ML Insights to harness their growing volume of data on AWS and on-premises for business insights. Here are some of the cool things customers are doing with ML Insights:
Expedia Group is the world’s travel platform, and its purpose is to bring the world within reach.
“At Expedia Group two of our key strategic imperatives are to be customer centric and locally relevant on a global basis. This is why tools such as Amazon QuickSight are so helpful in making it easier to measure, report, and act on our business metrics to help our customers find the best matches for their travel searches. Amazon QuickSight’s out-of-the-box machine learning insights help us to continuously monitor our business for anomalies, alert stakeholders when outliers occur, and help our business project future trends, which in turn allows teams to focus on other priorities instead of building out these capabilities from scratch.”
Amit Marwah, Director of Technology, Flights Data & Analytics, Expedia Group
Ricoh Company, Ltd., is a global corporation that provides imaging equipment for offices, production print solutions, document management systems, IT services, and more, for approximately 200 countries and regions throughout the world.
“Machine learning is becoming more important than ever to meet our growing data volume and BI needs. Amazon QuickSight’s ML Insights functionality makes powerful machine learning easy to use in just a few clicks. It allows us to continuously monitor for unexpected usage behaviors in our fleet of smart devices worldwide, forecast usage trends and deliver comprehensive dashboards that incorporate these machine generated insights as auto-narratives to our line of business users. With ML Insights, we can quickly pinpoint and take actions on anomalies down to the specific devices and features, to improve the experience and add value to our customers.”
Naoki Umehara, Group Leader, Ricoh Company, Ltd.
Tata Consultancy Services Limited is an Indian multinational information technology (IT) service and consulting company headquartered in Mumbai, Maharashtra, with international presence in 46 countries.
“Amazon QuickSight allows us to quickly and easily integrate our Amazon Connect contact center metrics with our client ticketing tools in order to deliver interactive and automatic dashboards that our customers love. We revolutionized our staffing, training, and outage reporting with Amazon QuickSight ML Insights, predicting where the call flow is moving and react accordingly in order to prevent call spikes and provide a better service to our customers.”
Marco David Martinez, Cloud Manager, Tata Consultancy Services
Siemens is a global powerhouse focusing on electrification, automation, and digitalization. The company is also a leading supplier of power generation and transmission systems.
“Amazon QuickSight’s out-of-the-box ML Insights and usage-based pricing make it easy and cost effective to deliver robust machine-learning-based anomaly detection for our customers to analyze performance of their manufacturing process, detect faults in the production line, monitor downtime duration across hundreds of machineries, and understand the root cause of the failures — without heavy investment machine learning and custom development. This allows line supervisors and production managers to receive automated alerts on unexpected events and take actions to optimize the manufacturing process and improve performance.”
Massimilliano Ponticelli, Product Manager, Siemens
Daiso Industries Co., Ltd. is a global retailer and franchise of 100-yen shops founded in Japan.
“With Amazon QuickSight, we were able to build out our BI environment that handles the data of 5,000 stores x 70,000 products in 2 months. Precise sales forecast and inventory optimization are the most important challenges in our business. Amazon QuickSight’s ML Insights allow us to easily and quickly identify unexpected trend changes across our products and improve sales forecast and inventory optimization.”
Kenjiro Marumoto, Section Chief, Daiso Industries Co., Ltd.
Getting started
ML Insights is only available on the Enterprise Edition of Amazon QuickSight. If you are using the Standard Edition, you can easily upgrade with 1-click on the Manage QuickSight page.
- Compare Editions
- Upgrading Your Amazon QuickSight Subscription from Standard Edition to Enterprise Edition
To get started with ML Insights, you’ll need to connect a data source to Amazon QuickSight. Data sets can be accessed by direct query to the SQL-compatible database source or by using SPICE.
For this walkthrough, your data must have the following properties:
- At least one date field.
- At least one metric, such as sales, orders, shipped units, or sign ups.
- At least one category dimension, such as product, channel, segment, or industry.
- More than 40 historical data points per metric.
For optimal results, make sure that your data set has enough historical data points. The built-in ML algorithm requires at least 40 historical data points to learn and train the model, and it will use up to the most recent 1,000 data points. For example, if you’re analyzing daily sales by geographic region, make sure that you have at least 40 days of data. Three months to twelve months of data is preferred, depending on the seasonality of your business
You can use your own data set, or you can download the following sample data set. We’ll use this dataset for the walkthrough:
https://s3.amazonaws.com/quicksight-ml-insights/ML-Insights-Sample-Dataset-V1.csv
Once you have created a data set in Amazon QuickSight, create a new analysis from the data set. For more information about creating data sets and analyses in Amazon QuickSight, see the Amazon QuickSight User Guide.
Suggested insights
ML Insights automatically interprets your data and provides contextual insights called suggested insights. Different visuals may result in different types of insights. For example, if you have a time-series visual, you may get insights such as period-over-period changes, anomalies, and forecasts.
Let’s walk through an example.
1. Create a line chart with a metric and a date, such as revenue over time, aggregated daily.
2. Choose Insights in the top left-hand corner of the visual.
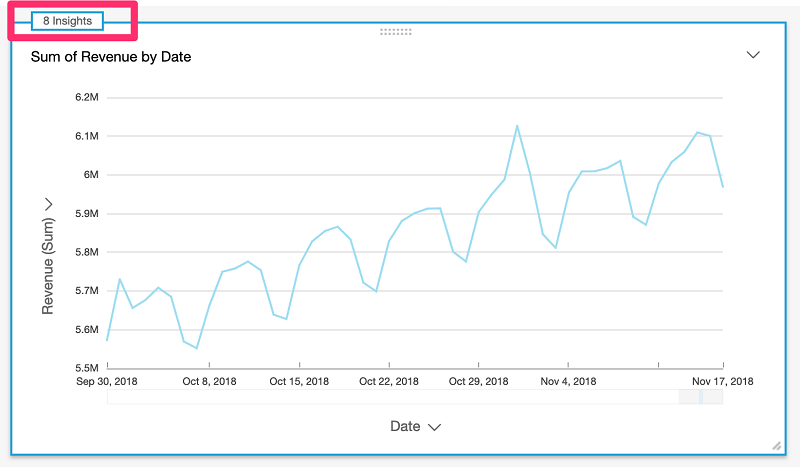
You should then see a list of suggested insights on the left pane. Suggested insights provide you with a quick summary of the data in plain language. As you add visuals to your analyses, you will see additional suggested insights on the left pane, grouped by the visual name.

You can choose a suggested insight such as day over day change to highlight the data point or segment on the visual. Choose it again to deselect it.
ML-powered anomaly detection
With ML Insights, you can run ML-powered anomaly detection on up to a million metrics simultaneously to discover hidden trends and outliers that are often buried in aggregates. To learn more about pricing for anomaly detection, go to Amazon QuickSight pricing and choose ML Insights.
Let’s get started with anomaly detection.
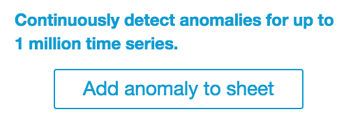
1. Choose Add on the application bar, and then choose Add anomaly to sheet. This creates an insights visual for anomaly detection.
2. Expand the field wells on the top of the page and add at least one category field.

The categories represent the dimensional values by which Amazon QuickSight will split the metric. For example, let’s say you are analyzing anomalies in revenue across all product categories and product SKUs. Assuming there are 10 product categories, each with 10 product SKUs, Amazon QuickSight will split the metric by the 100 unique combinations and run anomaly detection on each of the split metrics.
3. Choose Get Started on the insights visual to configure the anomaly detection job.
4. On the anomaly detection configuration pane, configure the following options:
- Analyze all combinations of these categories – If you select three categories, Amazon QuickSight will run anomaly detection on the following combinations, hierarchically: A, AB, ABC. If you select this option, Amazon QuickSight will analyze all combinations, including: A, AB, ABC, BC, AC. If your data is not hierarchical, you should select this option.
- Number of anomalies to show – This setting allows you to control the number of top anomalies you want to display on the insights cards as narratives.
- Schedule – Set the schedule to run anomaly detection on your data hourly, daily, weekly or monthly, depending on your data. Choose the start time and the time zone of the start time.
- Contribution analysis – You can select up to four additional dimensions for Amazon QuickSight to analyze for top contributors when an anomaly is detected. For example, Amazon QuickSight can show you the top customers that contributed to a spike in sales in the USA for Home Improvement products. If you have additional dimensions in your data (dimensions not used in the anomaly detection), you can add them here for contribution analysis. For this example, choose the Geo for contribution analysis.

5. Choose OK. Amazon QuickSight will not implement the schedule until you publish the analysis as a dashboard. Within an analysis, you will have the option to run anomaly detection manually without the schedule.
6. After the configuration is set, choose Run Now to run detection manually. You will see a “Analyzing for anomalies… This may take a while…” message. Depending on the size of your data set, analysis may take anywhere from a few minutes to an hour.

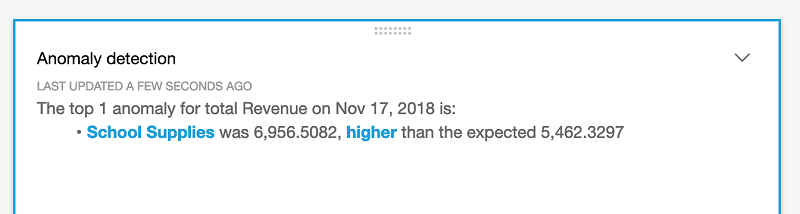
Once anomaly detection is complete, you will see the top anomalies for the latest period in your data listed in the insights visual. Amazon QuickSight also computes and displays the expected value so you can better understand the significance of the anomaly.
7. To see all anomalies for this data, choose the selector in the upper right of the visual and choose Explore Anomalies.
On the detailed anomalies page, you can see all of the anomalies detected for the latest period. The title of the visual represents the metric that is applied to the unique combination of the categorical fields. The highlighted data point on the chart—on the far right of the chart—represents the most recent anomaly detected for that time series.

On the left pane, you will see the top contributors to the anomaly based on the dimensions you have predefined. When you hover over the top contributors, Amazon QuickSight displays an explanation of the significance of the contribution.

8. To see anomalies by date, choose Show Anomalies by Date from the top of the visual to expose a date picker. The cart will display the number of anomalies detected for each unit of your anomaly detection configuration. You can choose a particular date to see the anomalies for that date. For example, if you choose Nov. 1st, 2018, from the graph, then the bar chart highlights the anomalies for that date.

Important: Amazon QuickSight uses the first 40 data points in a data set for training; these data points will not be scored by the anomaly detection algorithm. You may not see any anomalies on the first 40 data points.
9. Use the filter controls at the top of the pane to change the anomaly threshold to show anomalies with high, medium or low significance or to show only anomalies that are higher than expected or lower than expected. You can also filter by the categorical values that are present in your data set to look at anomalies only for those categories.

10. To go back to your analysis, choose Back to analysis at the top of the page.
ML-powered forecasting
Using the built-in ML algorithm, you can now forecast business metrics with point-and-click simplicity without having to write code or build a complex spreadsheet.
1. On your time series chart, choose the selector in the upper right corner of the visual, and then choose Add forecast. Amazon QuickSight will analyze the historical data using ML and present a forecast for the next 14 periods.

2. On the Forecast properties pane at the left, you can customize forecast settings. For example, you can change the number of periods to forecast into the future or add “forecast” periods into the past to compare historical actuals against ML-based expectations.
You can adjust the width of the prediction band by changing the prediction internal and manually setting the seasonality (number of periods). Choose Apply to save your changes.
3. Select a forecasted data point on the chart and choose What-if analysis. With What-if analysis, you can set target value for a particular date or date range, and Amazon QuickSight will adjust the forecast gracefully to meet the target.

4. Choose Apply to see the new forecast adjusted for the target along with the original forecast. You can hover over the data points to see details.

With ML-powered forecasting, Amazon QuickSight allows you to forecast complex, real-world scenarios such as data with multiple seasonality. Outliers will be excluded automatically, and missing values will be imputed.
To export the forecasting data in CSV format, choose the selector in the upper right corner of the visual, and then choose Export to CSV.
Auto-narratives
Auto narratives allow you to create natural language summaries of your visuals. You can embed these summaries into your dashboard to highlight key insights that are important for your readers, allowing them to access the data without having to sift through the entire dashboard. When you define a template, narratives update automatically as the data in your data set refreshes, just like a visual. The following steps show you how to get started with auto narratives.
1. In your time series chart, choose Insights again to show the suggested insights.
2. An easy way to add a narrative insight to your analysis is to choose the plus sign (+) next to a suggested insight. For the purpose of this walkthrough, choose the Day Over Day Change insight.
You’ll see an insight visual on your analysis with the predefined template. Notice that the field wells have the date, metric, and category filled in. These settings are populated from the visual that you used to create the insight visual. You can customize the fields as needed.

3. To edit the narrative, choose the insight visual menu and select Customize Narrative. You’ll see the Configure narrative pane where you can edit your insights template.. You can format the content with different sizes and colors using the formatting toolbar. You can also insert expressions and conditional statements like IF and FOR statements.
In the left pane, you can add computations to your narrative. Computations are predefined calculations such as period-over-period, period-to-date, growth-rate, max, min, and top movers, that you can reference in your template to describe your data. Currently, Amazon QuickSight supports 13 different types of computations. In this example, PeriodOverPeriod is added by default since we selected the Day Over Day Change insight from the suggested insights pane.

4. To add a new computation, choose Add computation in the bottom left corner of the pane. You’ll be prompted to select from a list of computations. For the purpose of this walkthrough, select the Growth rate computation type, and select Next.

5. You can configure certain aspects of the computation. In the case of growth rate, you can change the number of periods over which that you want to compute growth. After you make your selections, choose OK.

6. Now expand Computations on the left pane. You should see both PeriodOverPeriod and GrowthRate options.

Please note that computation names must be unique. When you create a computation, assign a unique name. You can reference multiple computations of the same type in your template. For example, if you have two metrics, such as $sales and units sold, you can create a GrowthRate computation for each of the metrics, with a different name for each computation. The specific computations can then be referenced by name in the template.
Also be aware that anomaly computation is not compatible with all other computation types. For example, if you have a PeriodOverPeriod or GrowthRate computation, you will not be able to add an Anomaly computation to the same insight visual.
7. To add growth rate to your narrative, enter the phrase Compounded Growth Rate for the last on the narrative template. From the Computations pane, choose GrowthRate, and then choose timePeriods to insert the expression GrowthRate.timePeriods into your narrative. This expression references the number of periods set in the configuration.
8. Complete the sentence by entering days is. Then add another expression from the Computations pane by choosing GrowthRate, then compounded GrowthRate, and then formattedValue. The selection formattedValue returns a phrase formatted according to the format applied to the metric on the field. To see a raw value in integer or decimal format, choose value instead of formattedValue.

Now, let’s try using a conditional statement.
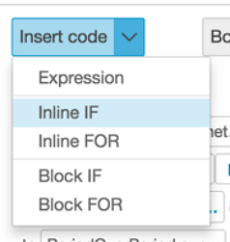
1. To insert an IF statement, place the cursor at the end of your narrative template. From the Insert Code menu, choose Inline IF.
2. You’ll be prompted to enter some code. On the left pane choose GrowthRate, then choose compoundedGrowthRate, and then choose value. To insert the value, enter > 3, and choose Save.

3. For the conditional content, enter Great! Select the text and use the format menu to format menu to change the color to green.
4. Repeat the previous steps, entering <3 for the growth rate value. For conditional content, enter Bad! And format the text as red.
5. Choose Apply. You should see the results similar to the following.

The template provides you with a sophisticated tool to customize your narrative. Within the template, you can also reference parameters in your analysis or dashboard and leverage a set of built-in functions to perform more calculations.
The best way to get started with auto narratives and to learn the syntax is to use the existing templates built from suggested insights. But you can also create insight visuals from scratch by choosing Add and then choosing Add Insight.

Try it yourself! Try creating a narrative that enumerates the top selling products for the last three months.
Conclusion
As you can see from the walkthrough, ML Insights helps you perform large scale anomaly detection and create business forecast in a few simple clicks. You can build rich and user-friendly auto narratives within your dashboards in minutes, without any custom development or ML skillset necessary.
About the Author
 Luis Wang is a principal product manager for Amazon QuickSight. He’s been with AWS for over 6 years, working on various services including Amazon EC2 and then launching Amazon QuickSight. Luis is now focused on the application of machine learning and AI to business intelligence and analytics at QuickSight. He enjoys running, watching sitcoms and spending time with his family.