Containers
AWS and Kubecost collaborate to deliver cost monitoring for EKS customers
This blog post was co-written by Linh Lam, Solution Architect, Kubecost
Introduction
Today, we are happy to announce cost monitoring for Amazon Elastic Kubernetes Service (Amazon EKS) in collaboration with Kubecost. As customers modernize their applications and deploy workloads using Amazon EKS, they gain efficiencies by consolidating the compute resources required to run their applications. However, this utilization efficiency comes at a tradeoff of increased difficulty measuring application costs. Our customers tell us they want finer-grained visibility into the cost distribution of applications running on Amazon EKS that share AWS resources like Amazon EC2 instances. We also see a need for deeper Kubernetes cost monitoring through surveys conducted by the CNCF and FinOps Foundation, where nearly a quarter (24%) of respondents do not monitor Kubernetes spending, and almost half (44%) use only monthly estimates.
While customers can track their Kubernetes control plane and EC2 costs using AWS Cost and Usage Reports, they need deeper insights to accurately track Kubernetes resource level costs by namespace, cluster, pod, or organizational concepts (e.g., by team or application). For example, to determine the resources used by a specific group of pods, customers previously had to manually aggregate the compute resource usage for a particular period to calculate the cost. Containers are also often short-lived and scale at various levels, so the resource usage fluctuates over time, further adding complexity to this equation. Amazon EKS is commonly used in dynamic and/or multi-tenant environments, which require purpose-built features for accurate cost monitoring.
This is the exact challenge that Kubecost is dedicated to tackling. Founded in 2019, Kubecost launched to provide customers with visibility into spend and resource efficiency in Kubernetes environments, and today helps thousands of teams address this challenge. Kubecost is built on OpenCost, which was recently accepted as a Cloud Native Computing Foundation (CNCF) Sandbox project, and is actively supported by AWS.
With this announcement, Amazon EKS customers can deploy an EKS optimized bundle of Kubecost for cluster cost visibility. This is available free of charge, and includes Kubecost troubleshooting support. Kubecost enables users to view costs broken down by Kubernetes resources including pods, nodes, namespaces, labels, and more. Kubernetes platform administrators and finance leaders can use Kubecost to visualize a breakdown of their Amazon EKS charges, allocate costs, and chargeback organizational units (e.g., application teams). Customers can provide their internal teams and business units with transparent and accurate cost data based on their actual AWS bill and get customized recommendations for cost optimization based on their infrastructure environment and usage patterns within a single cluster.
Deploying Kubecost on Amazon EKS
To get started, you can follow these steps to deploy Kubecost into your Amazon EKS cluster in a few minutes using Helm.
Prerequisites:
- Install the following tools: Helm 3.9+, kubectl, and optionally eksctl and awscli.
- You have access to an Amazon EKS cluster. To deploy one, see Getting started with Amazon EKS.
- If your cluster is running Kubernetes version 1.23 or later, you must have the Amazon EBS CSI driver installed on your cluster.
Step 1: Install Kubecost on your Amazon EKS cluster.
In your environment, run the following command from your terminal to install Kubecost on your existing Amazon EKS cluster.
Note: You can find all available versions of the EKS optimized Kubecost bundle here. We recommend finding and installing the latest available Kubecost cost analyzer chart version.
By default, the installation includes certain prerequisite software including Prometheus and kube-state-metrics. To customize your deployment (e.g., skipping these prerequisites if you already have them running in your cluster), you can find a list of available configuration options in the Helm configuration file.
Step 2: Generate Kubecost dashboard endpoint.
After you install Kubecost using the Helm command in step 2, it should take under two minutes to be completed. You can run the following command to enable port-forwarding to expose the Kubecost dashboard:
Step 3: Access cost monitoring dashboard.
On your web browser, navigate to http://localhost:9090 to access the dashboard.
You can now start monitoring your Amazon EKS cluster cost and efficiency. Depending on your organization’s requirements and set up, there are several options to expose Kubecost for on-going internal access. There are few examples that you can use for your references:
- Check out the Kubecost documentation for Ingress Examples as a reference for using Nginx ingress controller with basic auth.
- Consider using the AWS Load Balancer Controller to expose Kubecost and use Amazon Cognito for authentication, authorization, and user management. You can learn more this How to use Application Load Balancer and Amazon Cognito to authenticate users for your Kubernetes web apps
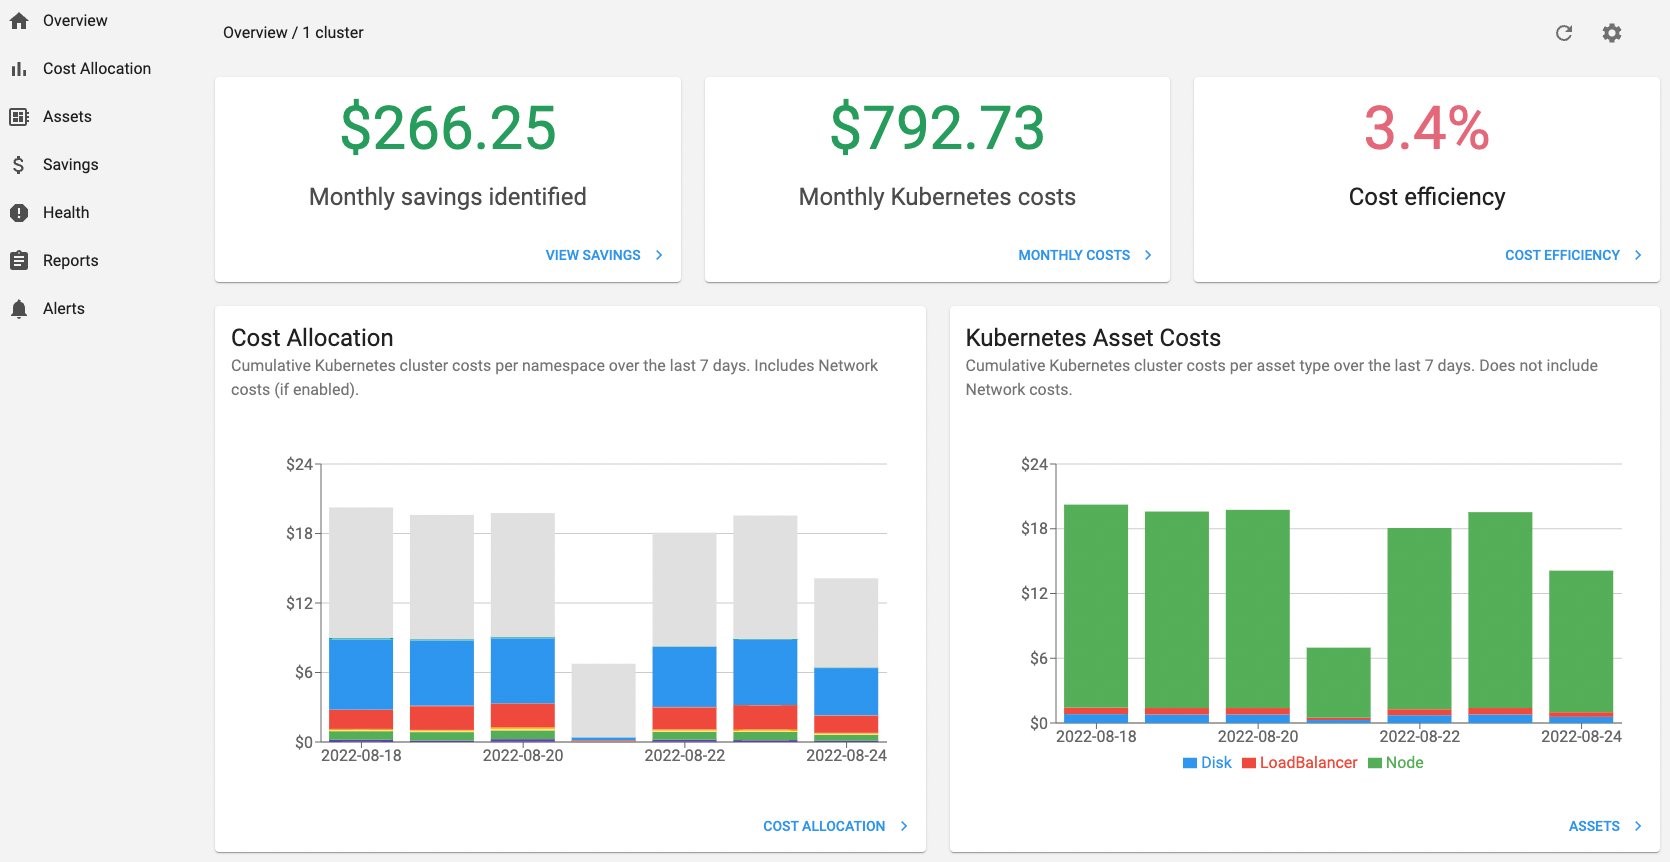
The following are examples of the metrics available within the Kubecost dashboard.
Cluster overview

Use Kubecost to quickly see an overview of Amazon EKS spend, including cumulative cluster costs, associated Kubernetes asset costs, and monthly aggregated spend.
Cost allocation by namespace

View monthly Amazon EKS costs as well as cumulative costs per namespace and other dimensions up to the last 15 days. This enables you to better understand which parts of your application are contributing to Amazon EKS spend.
Spend and usage for other AWS Services associated with Amazon EKS clusters

View the costs of AWS infrastructure assets that are associated with their EKS resources.
Export Cost Metrics
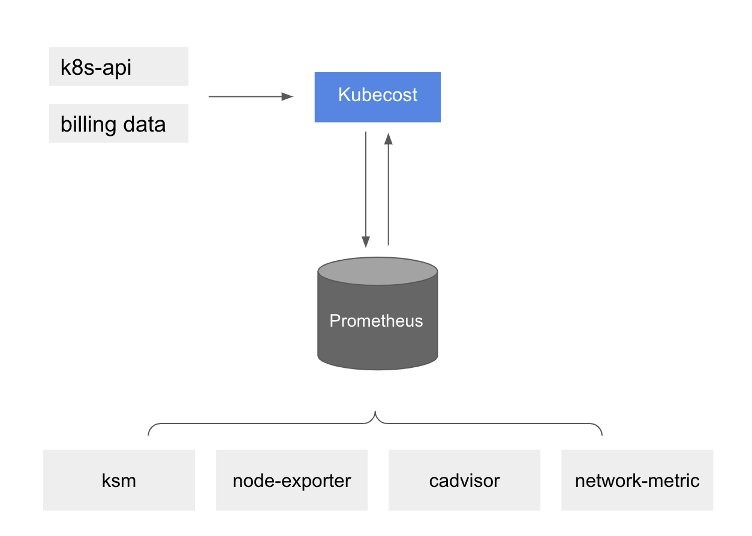
At a high level, Amazon EKS cost monitoring is deployed with Kubecost, which includes Prometheus, an open-source monitoring system and time series database. Kubecost reads metrics from Prometheus then performs cost allocation calculations and writes the metrics back to Prometheus. Finally, the Kubecost front end reads metrics from Prometheus and shows them on the Kubecost user interface (UI). The architecture is illustrated by the following diagram:

Kubecost reading metrics
With this pre-installed Prometheus, you can also write queries to ingest Kubecost data in your current business intelligence system for further analysis. You can also use it as a datasource for your current Grafana dashboard to display Amazon EKS cluster cost that your internal teams are familiar with. To learn more about how to write Prometheus queries, review Kubecost’s documentation or use example Grafana JSON models in the Kubecost Github repository as references.
AWS Cost and Usage Report (AWS CUR) integration
To perform cost allocation calculations for your Amazon EKS cluster, Kubecost retrieves the public pricing information of AWS services and resources from AWS Price List API. You can also integrate Kubecost with the AWS CUR to enhance the accuracy of pricing information that is specific to your AWS account (e.g., Enterprise Discount Programs, Reserved Instance usage, Savings Plans, and Spot usage). You can learn more on how the AWS CUR integration works at AWS Cloud Integration.
Cleanup
You can uninstall Kubecost from your cluster with the following command.
Conclusion
We’re excited to release these new cost monitoring features in collaboration with Kubecost, which enables customers to monitor and track the costs with Amazon EKS. We’ll highlight additional features over the coming months as they become available in the AWS supported version of Kubecost, such as multi cluster support and simplified integration with Amazon Managed Service for Prometheus and AWS Cost and Usage Reports. As always, you can provide feedback on the AWS Containers public roadmap. If you need support, you can submit a support request through your existing AWS support contract. If you would like to learn more from the Kubecost team, contact them here.
