Networking & Content Delivery
How to monitor internet traffic to CloudFront edge in one click with Amazon CloudWatch Internet Monitor
Amazon Web Services (AWS) offers a streamlined solution for you to monitor internet traffic to your Amazon CloudFront distribution with a simple integration for Amazon CloudWatch Internet Monitor in the CloudFront console. Ensuring optimal performance and availability is paramount for internet applications. With this integration, you can easily gain more insights into internet health and user experience for an application that you’ve set up with a CloudFront distribution.
By using the Internet Monitor integration, you can quickly start monitoring internet traffic for your application that’s set up with a CloudFront distribution. Internet Monitor uses the connectivity data that AWS captures from its global networking footprint to calculate a baseline of performance and availability for internet-facing traffic. This is the same data that AWS uses to monitor internet uptime and availability. With these baseline measurements, Internet Monitor can notify you when there are internet availability or performance issues in specific locations for users accessing your application with specific Autonomous System Numbers (ASNs), typically Internet Service Providers (ISPs). On the Internet Monitor dashboard, you can clearly visualize the extent of the impact and pinpoint the affected client locations and ISPs.
Internet Monitor offers continuous observability of internet traffic measurements for your application, such as availability and performance, tailored to your workload footprint on the internet. By analyzing your internet traffic, Internet Monitor provides visibility into how internet issues impact performance and availability for clients of your applications hosted on AWS. You can use Internet Monitor to view average internet performance metrics over time, and also get alerts for issues (health events) with client locations and ISPs. Using measurements associated with your application traffic can help you quickly identify the extent, location, and root cause of issues so that you can take actions to mitigate them. For example, you might identify an ISP that is experiencing specific issues, and work with them to resolve the problem.
Benefits of Internet Monitor integration
- Straightforward configuration – Add your CloudFront distribution to a monitor with a single action in the CloudFront console. With Internet Monitor, you can monitor internet traffic from clients to the CloudFront edge with no need to modify application code and no impact on the performance of your workloads.
- Comprehensive monitoring – Internet Monitor spans the internet path between users and CloudFront distribution edge locations, providing insights into internet traffic health and user experience. You can monitor metrics such as latency and availability, and also get insights into your application traffic profile.
- Automated alerting – When Internet Monitor detects significant performance degradation in your traffic, it creates a health event. Each health event includes information about the impacted client locations and ISPs. You can receive alerts on these health events by setting up CloudWatch alarms or Amazon EventBridge rules. Stay informed about significant performance degradation, based on thresholds that you control.
- Streamlined monitoring – Save time by easily switching to the Internet Monitor console from your distribution in the CloudFront console.
Things to know
When you use Internet Monitor to monitor traffic between your clients and your CloudFront distribution edge location, be aware of the following:
- A single monitor in Internet Monitor can monitor traffic for multiple CloudFront distributions.
- Internet Monitor is subject to standard CloudWatch charges for metrics, logs, and any additional dashboards, alarms, or insights that you create. For details, see Internet Monitor pricing information in the documentation.
- When you create a monitor in Internet Monitor, by default, the traffic percentage is set to 100%. You can change it later, if your needs change. For details, see the documentation.
Enable Internet Monitor from the CloudFront console
It’s quick and straightforward to enable monitoring with Internet Monitor from the CloudFront console. Follow these steps to set up monitoring.
Step 1. Sign in to the AWS Management Console and navigate to Amazon CloudFront. Then, under Telemetry, choose Monitoring, as shown in the following screenshot (Figure 1).

Figure 1: Screenshot of the CloudFront console Distributions page.
Step 2. Select a distribution, and then choose View distribution metrics, as shown in the following screenshot (Figure 2).

Figure 2: Screenshot of the CloudFront console Monitoring page.
Step 3. On the Distribution metrics page, scroll down to Enhance your monitoring experience with Amazon CloudWatch Internet Monitor. To set up monitoring, choose Monitor this distribution, as shown in the following screenshot (Figure 3).
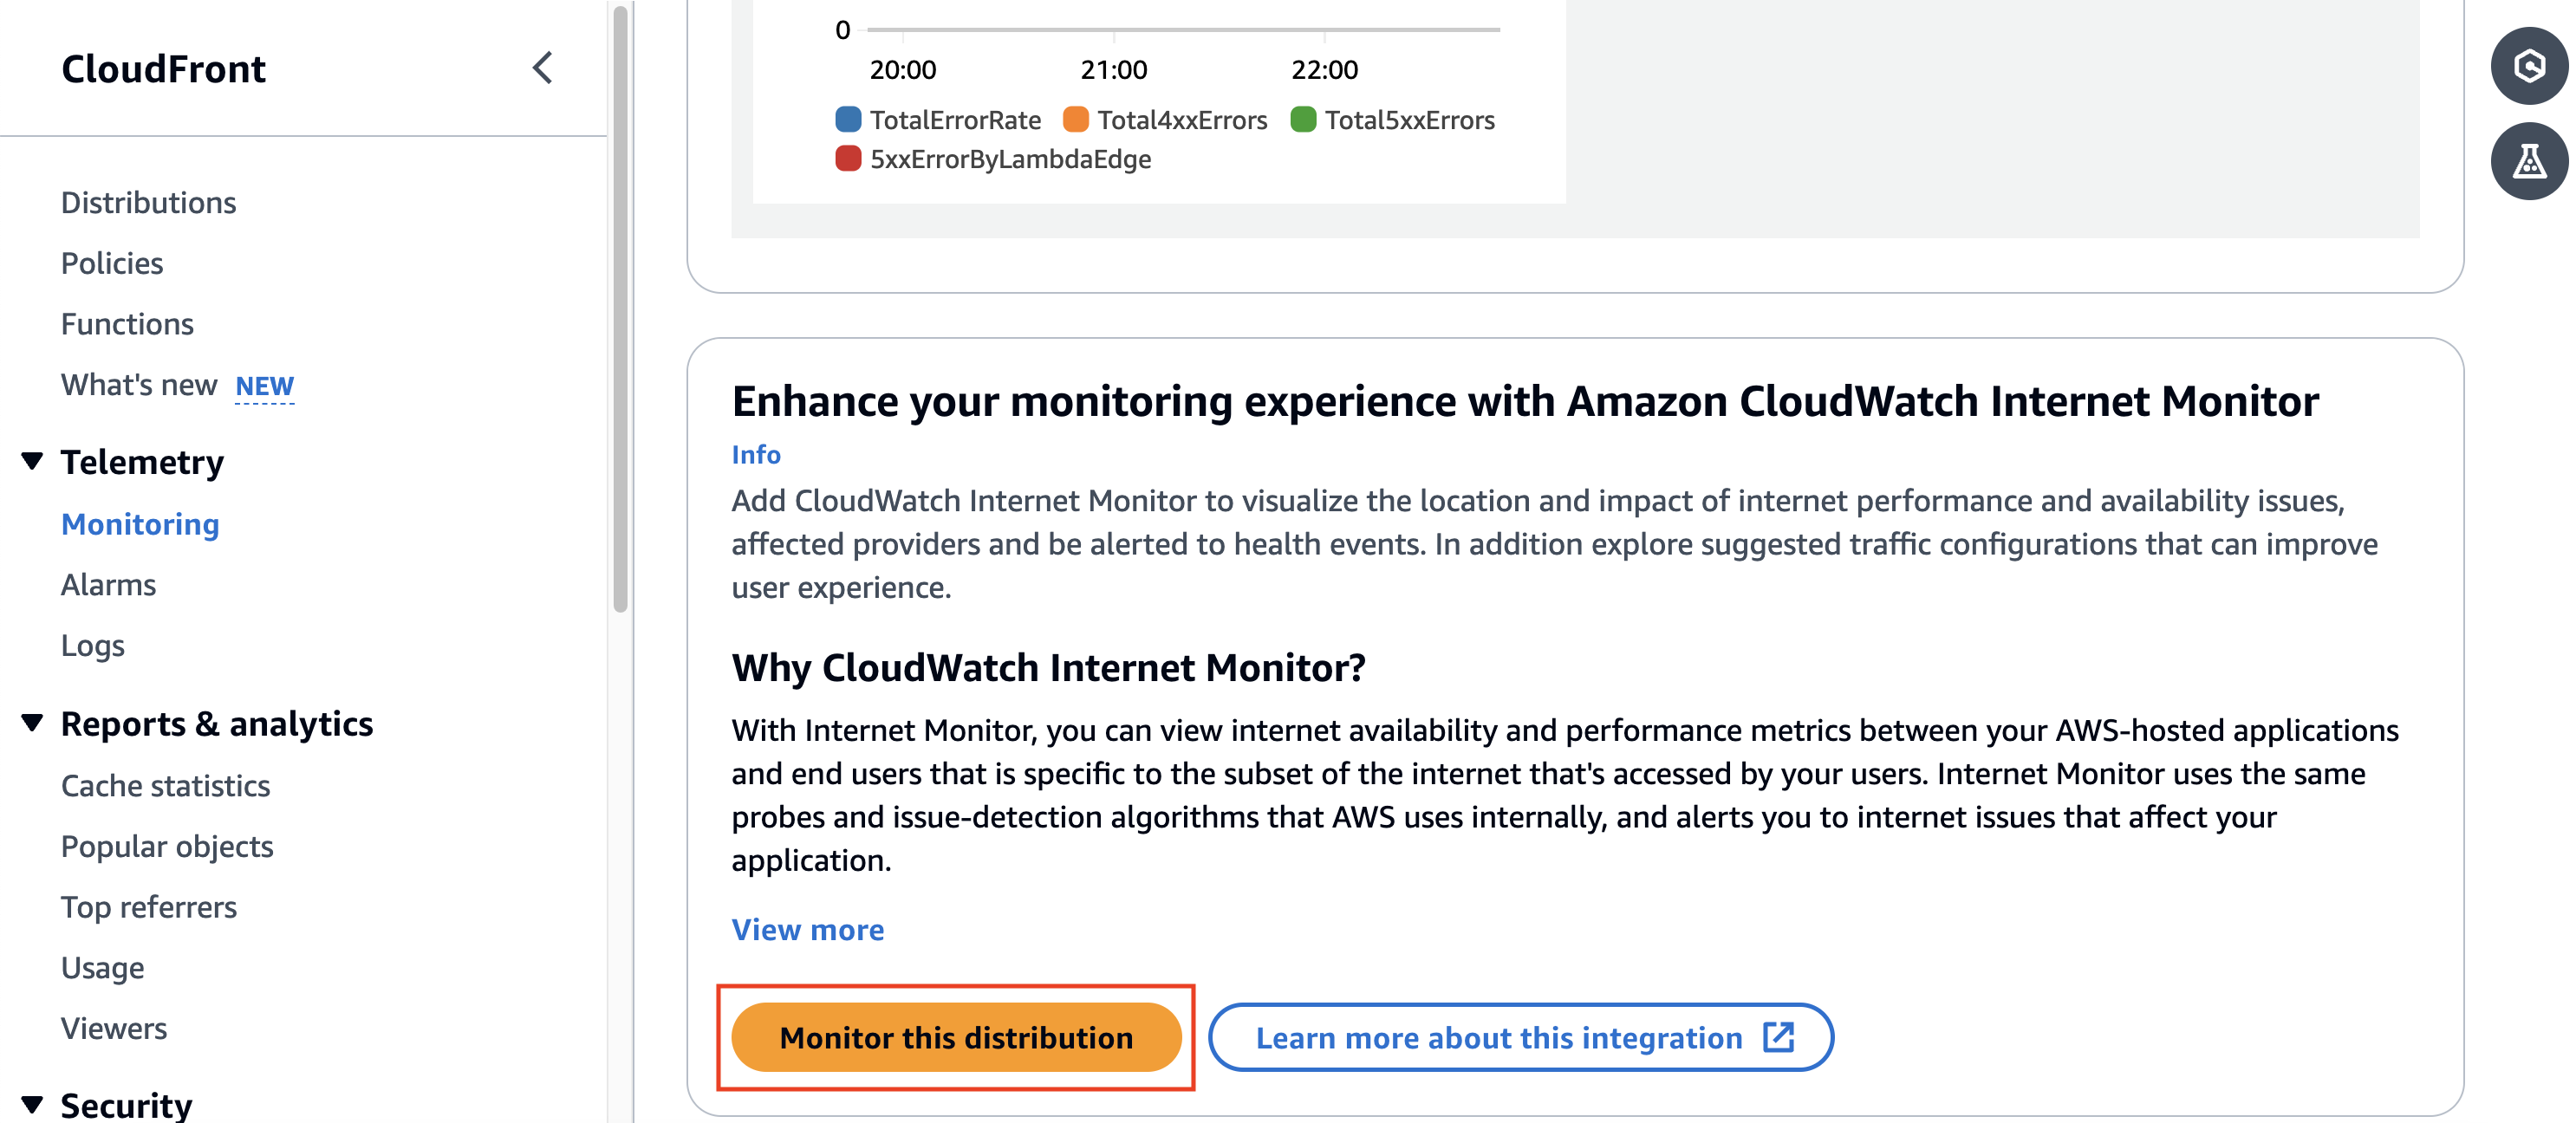
Figure 3: Screenshot of the CloudFront console Distribution metrics page with the Internet Monitor section.
Step 4. On the Monitor distribution with CloudWatch Internet Monitor popup dialog box, choose to create a new monitor or select an existing one, as shown in the following screenshot (Figure 4).

Figure 4: Screenshot of the dialog box for creating a monitor.
When you choose to create a new monitor, the monitor’s name automatically follows the format CF_<distributionID>_Monitor. With new monitors, by default, the traffic percentage is set to 100%, and the AWS Region is set as us-east-1. The percentage of traffic monitored impacts your pricing. Learn more about pricing in Pricing for Amazon CloudWatch Internet Monitor. The specified Region determines where your monitor is created, but it doesn’t limit monitoring of your distribution traffic to that Region.
Step 5. Choose Monitor this distribution. Now, on the CloudFront Distribution metrics page, in the Amazon CloudWatch Internet Monitor section, you’ll see the monitor and its state, as shown in the following screenshot (Figure 5). The monitor is initially in a data collection state for a few minutes, and then becomes active.

Figure 5: Screenshot of the CloudFront console Distribution metrics page showing active monitor
After your new monitor is active, the CloudFront console also shows any active health alerts for the monitor, as shown in the following screenshot (Figure 6). To see details about health events, choose the monitor, which opens the Internet Monitor dashboard.
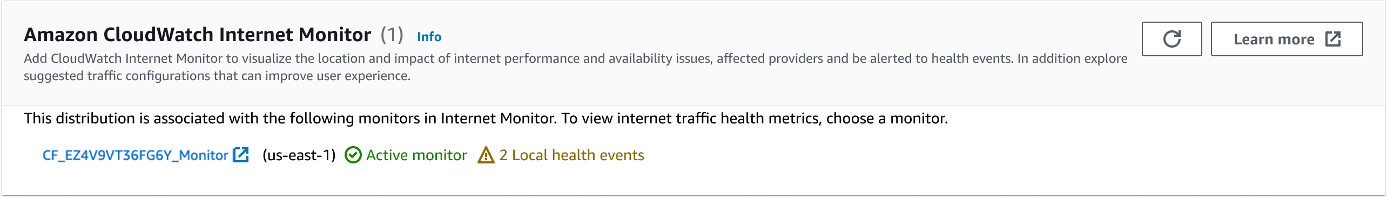
Figure 6: Screenshot of the Internet Monitor section with health event alerts
View Internet Monitor metrics and insights
To see additional Internet Monitor metrics and insights for traffic to your CloudFront distribution, choose the monitor. Then, on the Internet Monitor dashboard for the monitor, you can see a detailed view of your application’s traffic profile, health events, top client locations, and more.
The Overview tab on the Internet Monitor dashboard displays availability and performance scores for traffic to your CloudFront distribution edge locations, as well as related active health events, as shown in following screenshot (Figure 7).
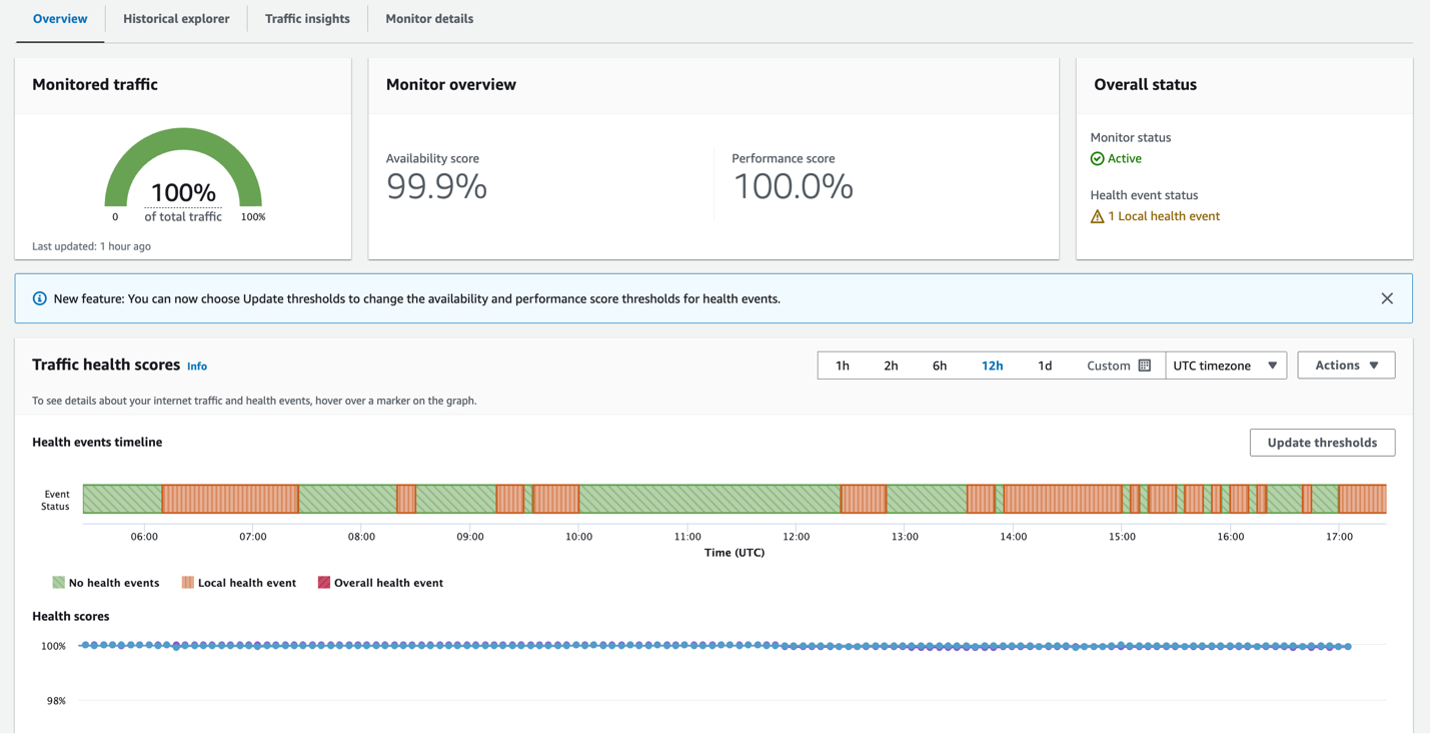
Figure 7: Screenshot of the Internet Monitor console Overview page.
Scroll down to see a map that highlights health events, as well as a summary table, as shown in the following screenshot (Figure 8).
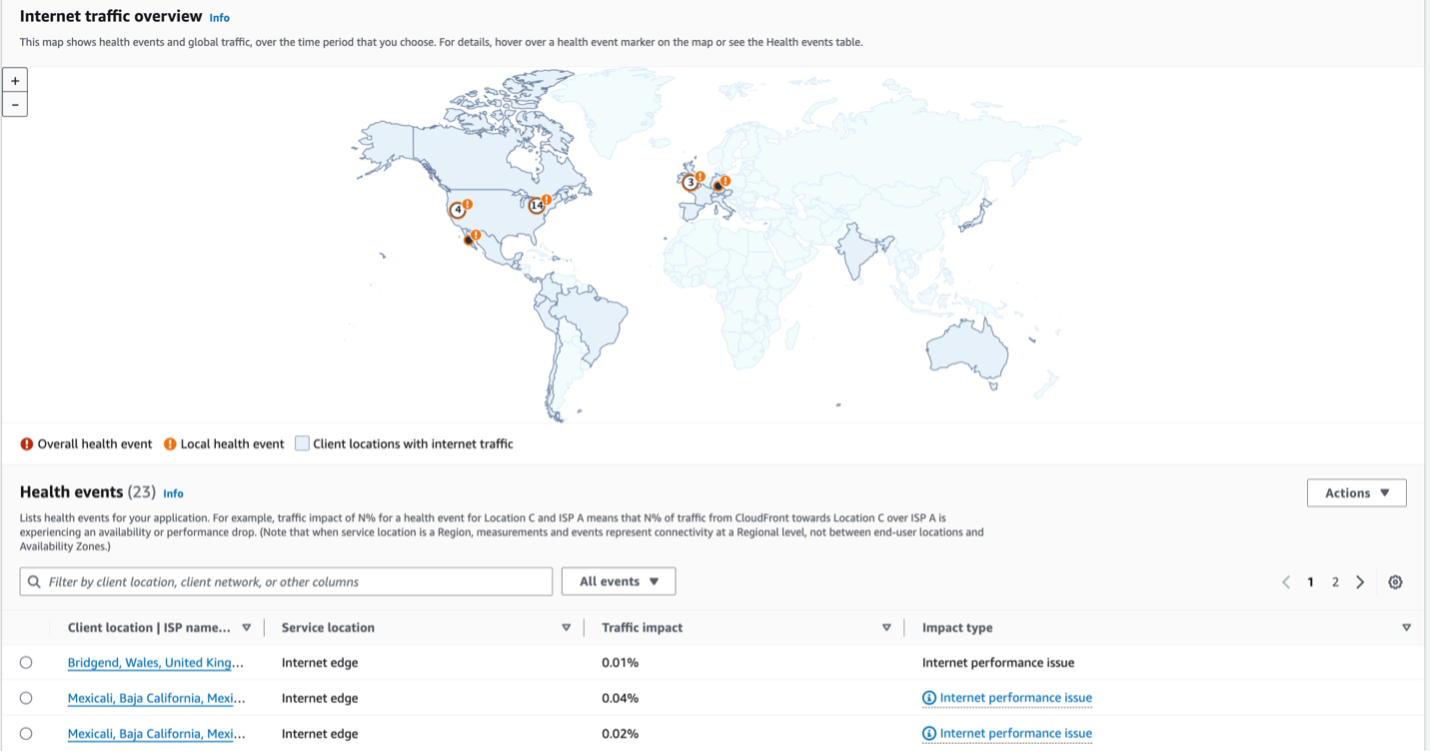
Figure 8: Screenshot of the Internet Monitor console dashboard.
To illustrate how your monitor provides insights to help you troubleshoot issues quickly, let’s consider an example where you have users in Ontario, Canada, who are experiencing higher latency. You can easily check if there are any health events associated with the location, and then choose a health event to see a visualization of the network path, as shown in following screenshot (Figure 9). The visualization can help you quickly pinpoint which ISP in the network path from the client to your distribution’s edge location is causing the issue.

Figure 9: Screenshot of the Internet Monitor dashboard showing a visualization of network hops.
If you need to make changes to your monitor, on the Monitor details tab, choose Edit monitor. You can update a monitor to change the configuration, as shown in the following screenshot (Figure 10).

Figure 10: Screenshot of the Internet Monitor console page for updating the monitor configuration.
For example, you could add more resources to your monitor to update the traffic profile, such as more CloudFront distributions. Or, you could adjust the percentage of application traffic that you want to monitor.
Conclusion
In this post, we described how to quickly and simply set up a monitor in Amazon CloudWatch Internet Monitor from an Amazon CloudFront distribution page in the console, allowing you to gain detailed monitoring of your application’s internet traffic from clients to the CloudFront edge. We also gave an overview of using the Internet Monitor dashboard for observability into internet traffic performance and availability for your application. Finally, we shared an example of how to use health alerts to quickly pinpoint where there are issues and what is causing them. Get started with using Internet Monitor for your CloudFront distributions today to take advantage of this critical monitoring and alerting tool.
To learn more about Internet Monitor, visit Using Amazon CloudWatch Internet Monitor. To learn more about CloudFront, visit the Amazon CloudFront documentation.
About the authors
 Anupam Anand is a senior Product Manager with the Network Availability Engineering team at Amazon Web Services. Anupam focuses on contributing to the design of product strategies and requirements that effectively meet the needs of customers. Anupam is based out of Seattle, USA. Outside of work, he loves playing badminton, cooking, and spending time with his family.

Karthik Gotluru is a senior Technical Account Manager based in Seattle, USA. Karthik supports AWS customers in building scalable, reliable, and cost-effective applications in the AWS Cloud. In his free time, he enjoys hiking and long drives.