AWS Cloud Financial Management
Getting Started with AWS Cost Explorer
It’s a blustery Thursday in San Francisco and we just kicked off Day 1 of our 2-day AWS Cost Management Workshop at AWS’s SF Loft. With that in mind, I’m going to start this post in the same way we tend to start our workshops: by diving into AWS Cost Explorer.
In this post, I will walk you through a set of tips and tricks to help get started using AWS Cost Explorer. This is the first installment of the AWS Cost Explorer product training blog post series.
Enabling Cost Explorer
Cost Explorer allows you to dive deeper into your cost and usage data to identify trends, isolate cost drivers, and detect anomalies. AWS Cost Explorer is accessible via the AWS Management Console, either using the dedicated service link under the AWS Cost Management service category or through search. You can also access Cost Explorer directly from the AWS Billing Console.
When you access Cost Explorer, this signals to AWS that you would like for the system to auto-fill your cost and usage data. It can take up to 24 hours for your month-to-date cost and usage information to become available, and up to 72 hours to prepare up to 12 months of your historical data.
Getting started
When your cost and usage information is available, you can access information regarding your month-to-date costs, forecasted costs, and monthly trends from the overview dashboard. You can also view a summary of your costs for the current and previous months in order to determine whether your cost and usage patterns are in alignment with expectations.

You can further review the insights surfaced in the Monthly Trends component, which highlights usage that appears anomalous as compare to your usage patterns in the previous month.
Exploring your costs and usage
To get started analyzing your costs and usage on your own, on the left navigation pane, choose Cost Explorer > Costs & Usage.
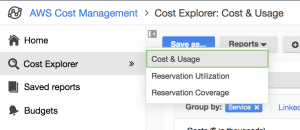
This allows you to access the data exploration surface, where you will see your monthly costs grouped by service. This data is set to track the last 6 months of AWS usage at a monthly level of detail. Customize the date range and granularity using the time controls located in the top left corner of the chart. For this example, I leave these values as-is.
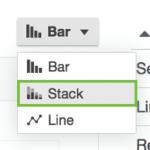
First, to make this chart easier to read, it may make sense to change the chart type from Bar to Stacked using the control at the top right corner of the chart.
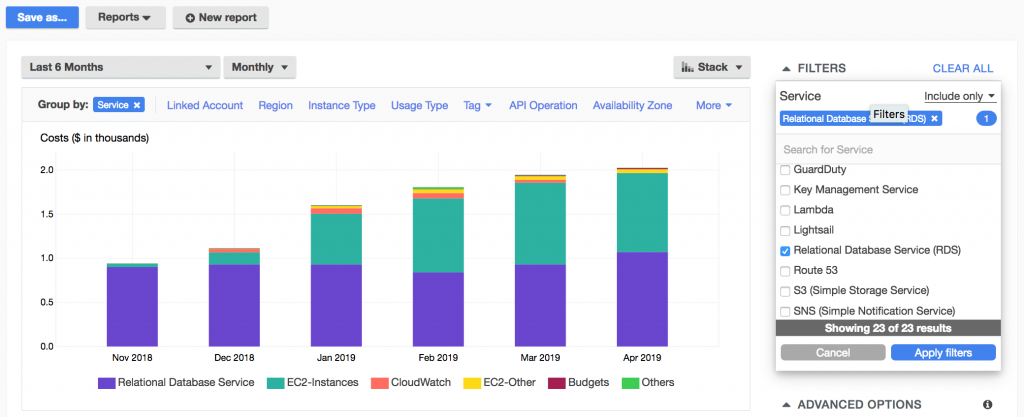
At a high level, it appears that the majority of my costs are related to using Amazon RDS. To dive deeper into this pattern, I could filter my costs so that only information relating to Amazon RDS is returned.
At this juncture, you are probably wondering what specific kinds of usage are driving your costs. To get at this information, you can use the grouping functionality available at the top of the chart. For this particular scenario, I chose to group by Usage Type. You can group your data along almost any usage dimension, including by Region, Account, and Tag.
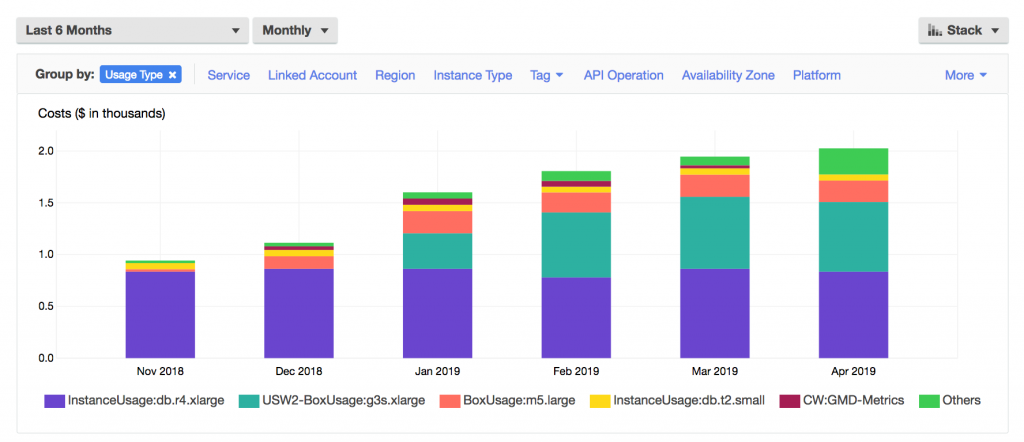
This data grouping tells me that the costs associated with my ml.m4.xlarge host tend to drive the majority of my costs. There have been some changes in this pattern over the last four months, likely due to some cost optimizations that were performed in November.
The chart only visualizes your top five cost-incurring usage types, while any additional costs are bundled into the Others category. To access a detailed breakdown of your costs, you can scroll down to the table located just below the chart.
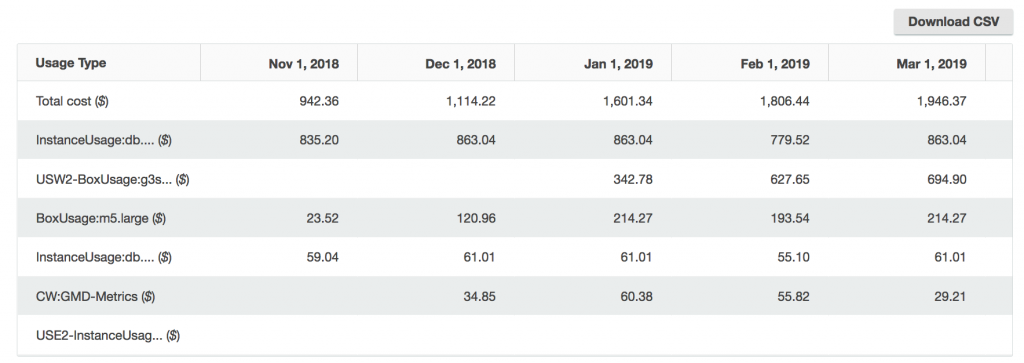
From the table, identify the total monthly cost associated with each usage type. You can also view the total cost driven by this usage type over the selected time period (in this case, the past 6 months)
Please note that you can export a CSV extract of either your chart or tabular data for further analysis at any time.
Saving a custom report
After you have reached a helpful view of your data, it often makes sense to save this view as a custom report. To do this, choose Save Report at the top of the page. From there, give your report a descriptive name.

To access a list of all default and saved reports, choose Saved Reports from the left menu. You can maintain up to 50 saved reports.
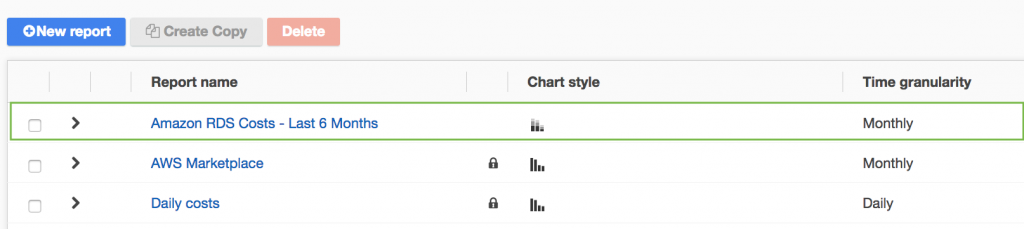
You can refer back to these reports at any time — or even use these reports as a starting point for your next set of analyses.
Conclusion
Using Cost Explorer, you can dive deep into your usage patterns and cost drivers. Review your monthly trends, conduct free-form data exploration using the robust filtering and grouping functionality, and save your progress as a custom report — all from a single location!
This is what it looks like in real life — hopefully we’ll be able to catch up with you next time we’re in your city!
