AWS News Blog
AWS Cost Explorer Update – Reserved Instance Utilization Report
Cost Explorer is a tool that helps you to manage your AWS spending using reporting and analytics tools (read The New Cost Explorer for AWS to learn more). You can sign up with a single click and then visualize your AWS costs, analyze trends, and look at spending patterns. You can look at your spending through a set of predefined views (by service, by linked account, daily, and so forth). You can drill in to specific areas of interest and you can also set up custom filters.
Enterprise-scale AWS customers invariably take advantage of the cost savings (up to 75% when compared to On-Demand) provided by Reserved Instances. These customers commonly have thousands of Reserved Instance (RI) subscriptions and want to make sure that they are making great use of them.
New Reserved Instance Utilization Report
Today we are adding a new Reserved Instance Utilization report to Cost Explorer. It gives you the power to track and manage aggregate RI utilization across your entire organization, even as your usage grows to thousands of subscriptions spread across linked accounts. You can also look at aggregate usage or individual RI usage going back up to one year. You can also look at aggregate usage or individual RI usage going back up to one year and define an RI utilization threshold to monitor your actual usage against it. If you find an RI subscription that is tracking below your predefined utilization target, you can drill down and find the account owner, instance type, and unused hours. You also have access to all of the existing filtering functions provided by Cost Explorer.
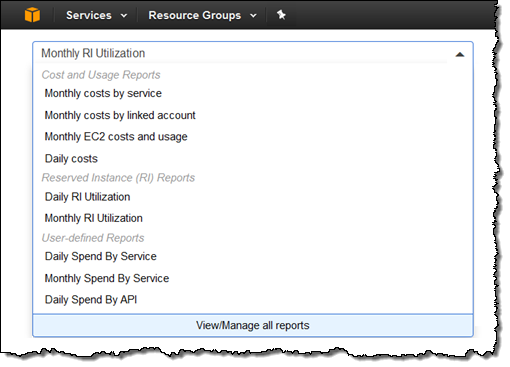
I don’t happen to own thousands of Reserved Instances, so I’ll use some sample screen shots and test data to show you what the report looks like and how you can use it! The new report is available in daily and monthly flavors from the Cost Explorer menu (this menu includes three reports that I defined myself):
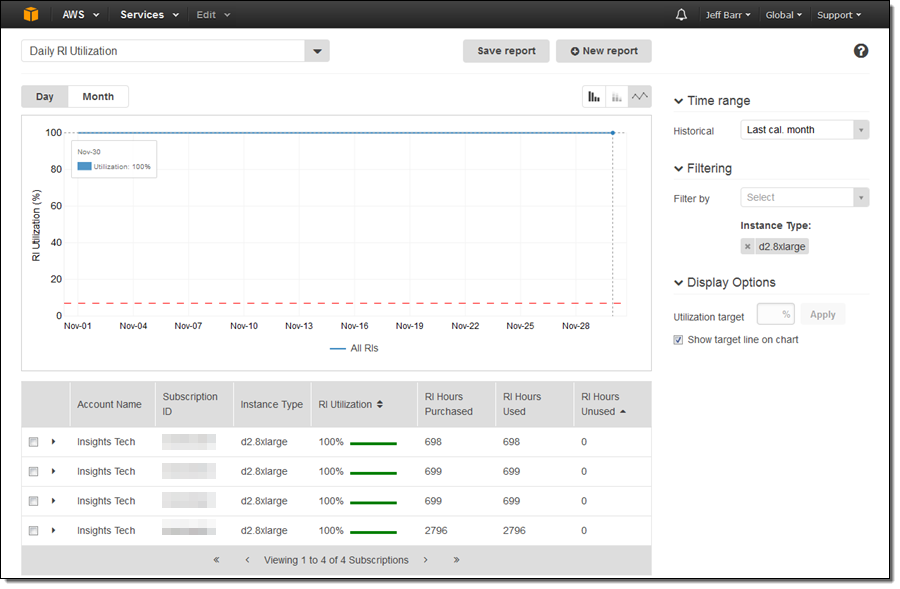
Here’s the Daily RI Utilization report:
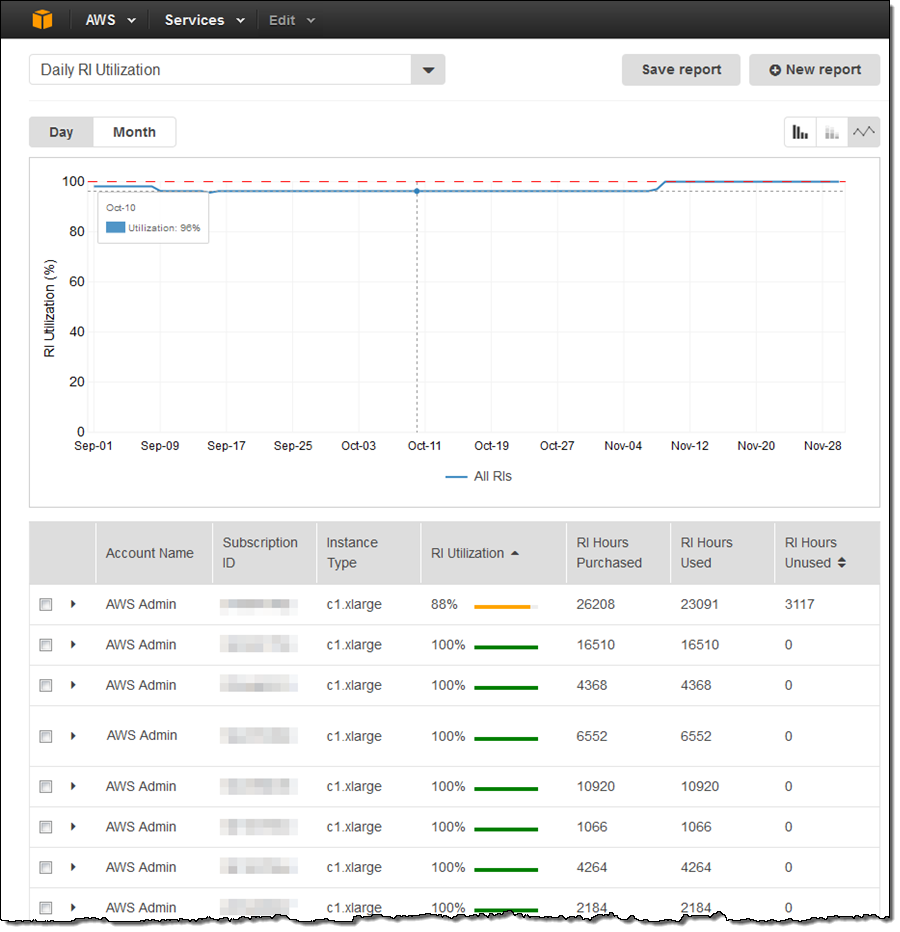
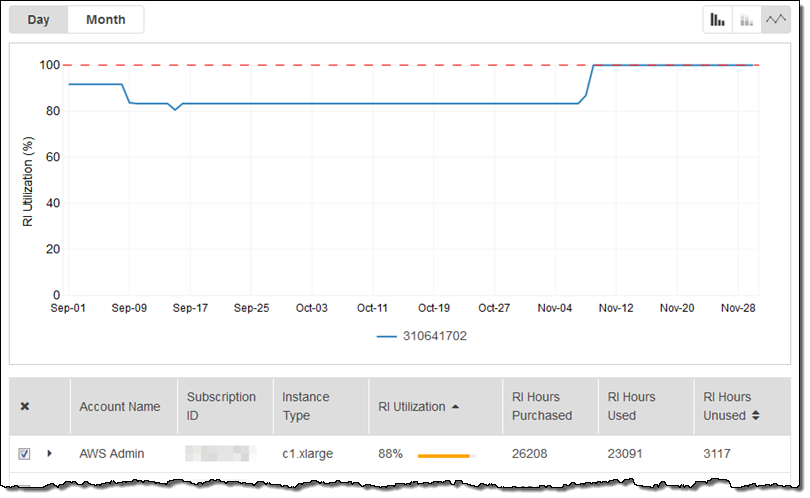
The RI are displayed in descending order of RI Utilization; the least-used RI’s are at the top of the list by default. I can see utilization over time and detailed information about the RI with a click:
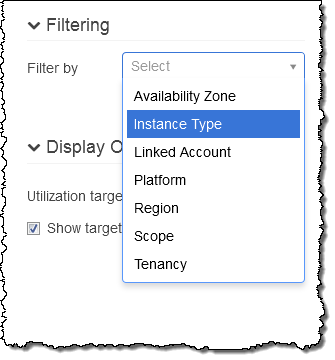
I can filter by instance type or other attributes in order to focus on particular RI’s:
I can also set the desired time range. Here’s how I can verify that I made good use of my d2.8xlarge RI’s last month by filtering on an instance type and setting the time range:
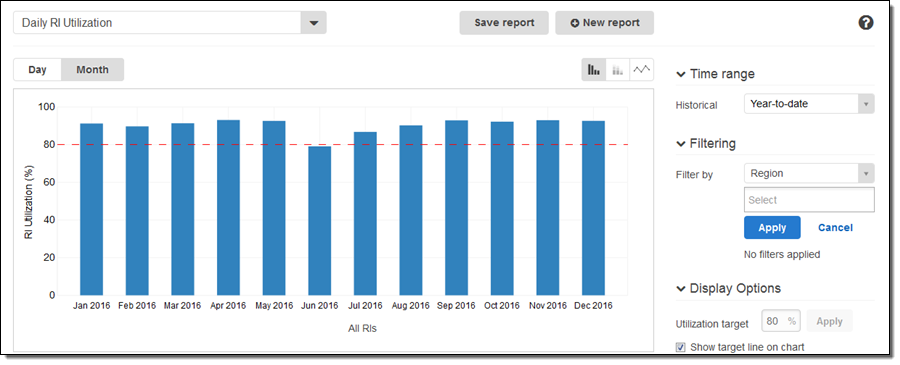
I can set the Utilization Target to any desired percentage and it will be shown on the graph as a reference line. Here, I can see that utilization dipped below 80% in June:
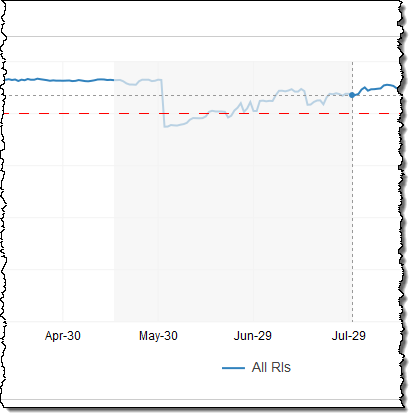
From there I can switch to the daily view and zoom in (click and drag) to learn more:
As I mentioned earlier, you can also filter on linked accounts, regions, and other aspects of each RI.
Now Available
This report is available now and you can start using it today!
— Jeff;