AWS News Blog
AWS X-Ray Update – General Availability, Including Lambda Integration
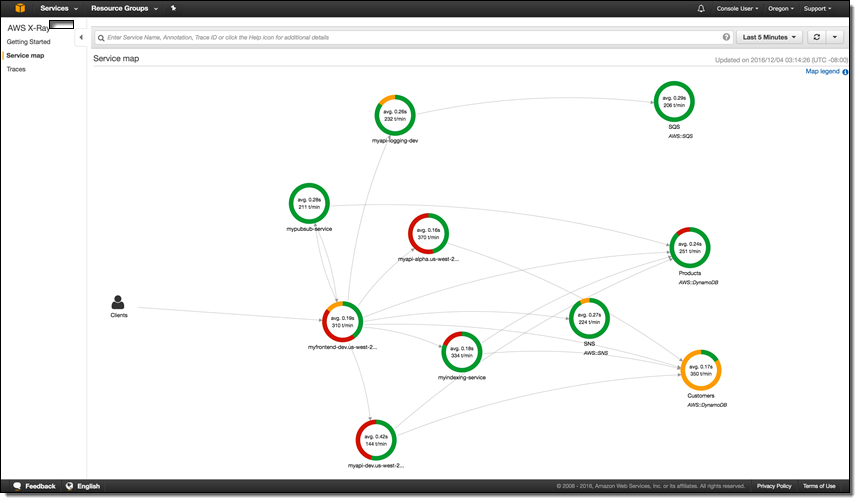
I first told you about AWS X-Ray at AWS re:Invent in my post, AWS X-Ray – See Inside Your Distributed Application. X-Ray allows you to trace requests made to your application as execution traverses Amazon EC2 instances, Amazon ECS containers, microservices, AWS database services, and AWS messaging services. It is designed for development and production use, and can handle simple three-tier applications as well as applications composed of thousands of microservices. As I showed you last year, X-Ray helps you to perform end-to-end tracing of requests, record a representative sample of the traces, see a map of the services and the trace data, and to analyze performance issues and errors. This helps you understand how your application and its underlying services are performing so you can identify and address the root cause of issues.
 You can take a look at the full X-Ray walk-through in my earlier post to learn more.
We launched X-Ray in preview form at re:Invent and invited interested developers and architects to start using it. Today we are making the service generally available, with support in the US East (N. Virginia), US West (N. California), US East (Ohio), US West (Oregon), Europe (Ireland), Europe (Frankfurt), South America (São Paulo), Asia Pacific (Tokyo), Asia Pacific (Seoul), Asia Pacific (Sydney), Asia Pacific (Sydney), and Asia Pacific (Mumbai) Regions.
New Lambda Integration (Preview)
During the preview period we fine-tuned the service and added AWS Lambda integration, which we are launching today in preview form. Now, Lambda developers can use X-Ray to gain visibility into their function executions and performance. Previously, Lambda customers who wanted to understand their application’s latency breakdown, diagnose slowdowns, or troubleshoot timeouts had to rely on custom logging and analysis.
In order to make use of this new integration, you simply ensure that the functions of interest have execution roles that gives the functions permission to write to X-Ray, and then enable tracing on a function-by-function basis (when you create new functions using the console, the proper permissions are assigned automatically). Then you use the X-Ray service map to see how your requests flow through your Lambda functions, EC2 instances, ECS containers, and so forth. You can identify the services and resources of interest, zoom in, examine detailed timing information, and then remedy the issue.
Each call to a Lambda function generates two or more nodes in the X-Ray map:
Lambda Service – This node represents the time spent within Lambda itself.
User Function – This node represents the execution time of the Lambda function.
Downstream Service Calls – These nodes represent any calls that the Lambda function makes to other services.
To learn more, read Using X-Ray with Lambda.
Now Available
We will begin to charge for the usage of X-Ray on May 1, 2017.
Pricing is based on the number of traces that you record, and the number that you analyze (each trace represent a request made to your application). You can record 100,000 traces and retrieve or scan 1,000,000 traces every month at no charge. Beyond that, you pay $5 for every million traces that you record and $0.50 for every million traces that you retrieve for analysis, with more info available on the AWS X-Ray Pricing page. You can visit the AWS Billing Console to see how many traces you have recorded or accessed (data collection began on March 1, 2017).
Check out AWS X-Ray and the new Lambda integration today and let me know what you think!
— Jeff;