AWS News Blog
New – AWS Application Discovery Service Console

|
Update (March 2020) – In the years that have passed since this post was published, we have removed the network visualization feature.
AWS Application Discovery Service helps you to plan your migration to the cloud. As a central component of the AWS Cloud Adoption Framework, it simplifies the process of automating the process of discovering and collecting important information about your system (read New – AWS Application Discovery Service – Plan Your Cloud Migration to learn more).
There are two different data collection options. You can install a lightweight agent on your physical servers or VMs, or you can run the Agentless Discovery Connector in your VMWare environment. Either way, AWS Application Discovery Service collects the following information:
- System identification information (hostname, IP addresses, MAC addresses, operating system name & version)
- System resource specifications (CPU, RAM, storage)
- System-level resource utilization
The lightweight agent also collects information about TCP listening ports and associated processes.
The information is collected, stored locally for optional review, and then uploaded to the cloud across a secure connection on port 443. It is processed and correlated, and then stored in a repository in encrypted form. You can then use the information to analyze the total cost of ownership (TCO) of running your existing on-premises environment on AWS. You can also use it to group the discovered servers into applications for migration planning.
New Application Discovery Service Console
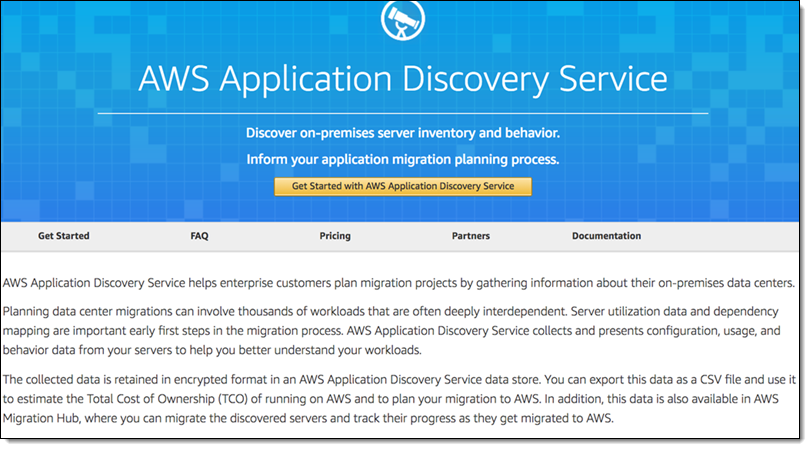
The new AWS Application Discovery Service Console is now part of the AWS Migration Hub in order to simplify tracking of migrations (this happens after the discovery and grouping process). The landing page gives you an overview of the service, with a listing of the benefits and features. Click on Get Started with AWS Application Discovery Service to move ahead:
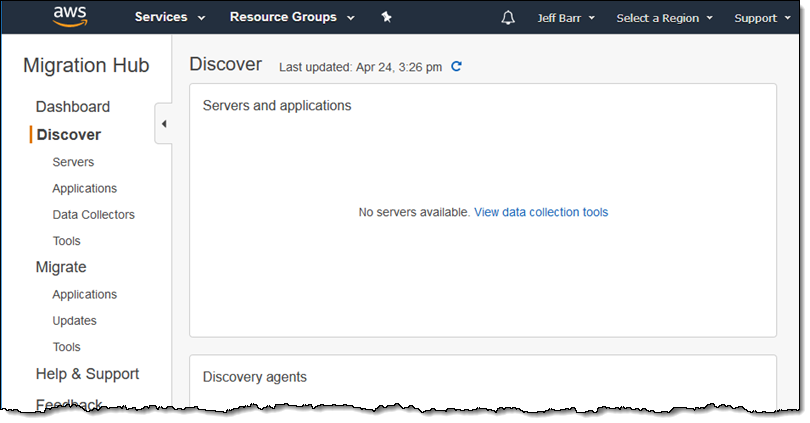
 Log in to the console if necessary, then click on Tools in the Discover section:
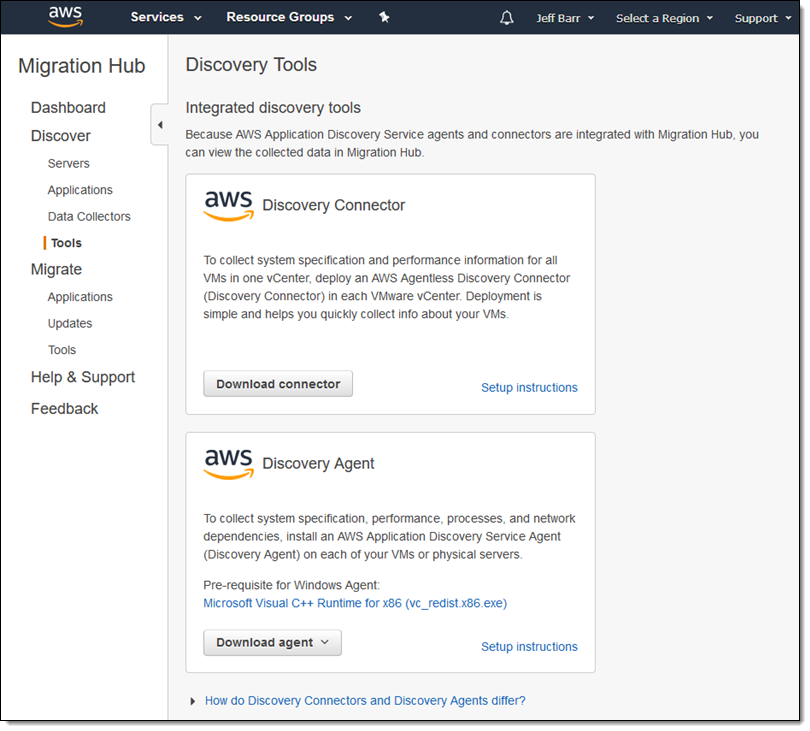
Choose your data collection option (agent on the servers or VMs, or agentless in your VMware environment). You can click on Learn more for detailed setup instructions:
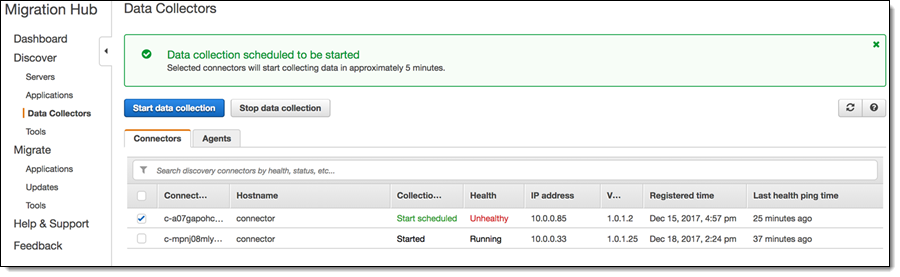
With the agents and connectors (you can use both together) set up and ready to go, you can start discovery from selected agents/connectors by clicking on Start data collection on the Data Collectors page:
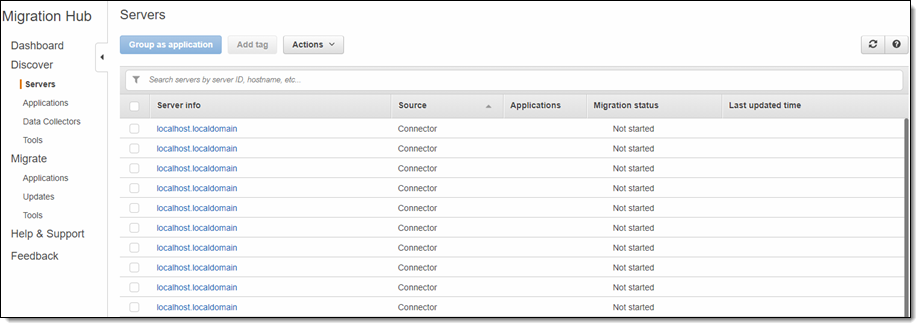
You can see the servers as they are discovered:
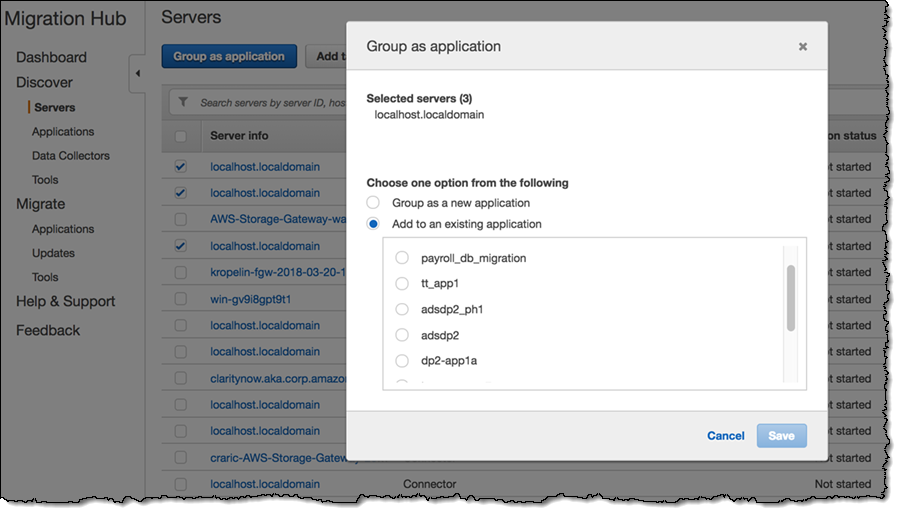
You can select one or more servers and group them into a named application, again with a couple of clicks:
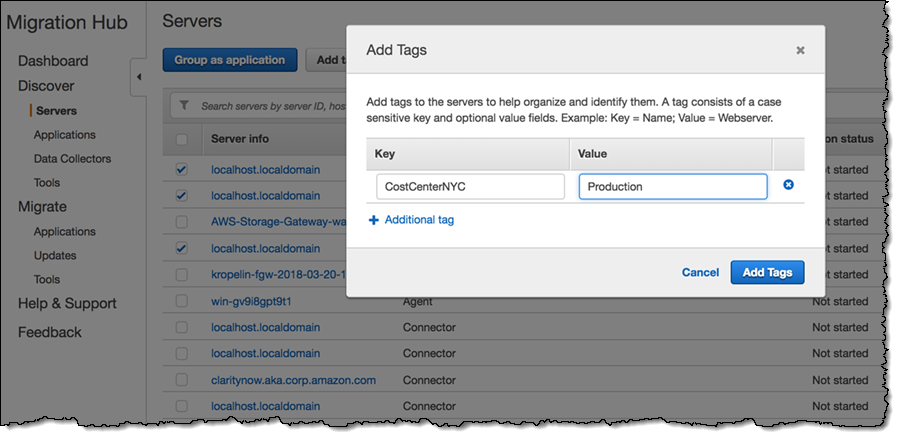
You can add one or more tags to each server:
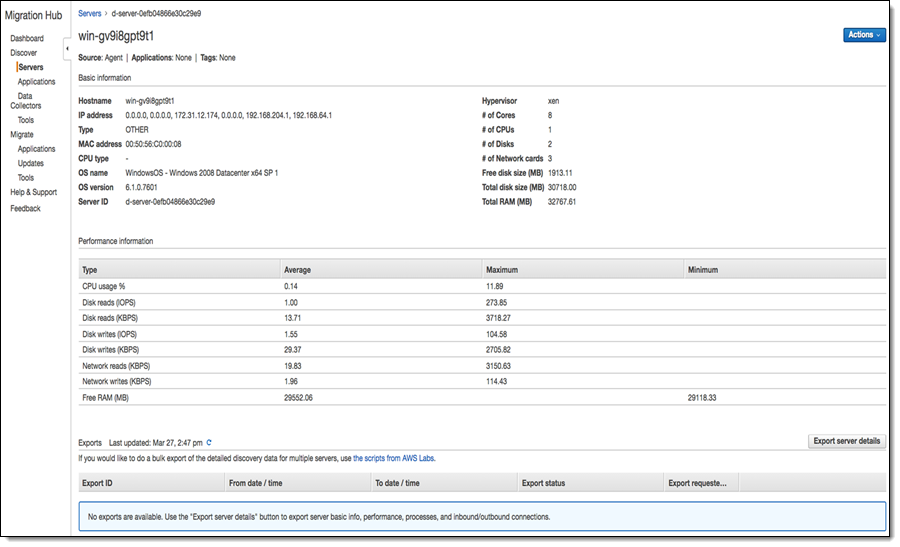
You can see all of the detailed information for each server and export the network connections and processes that are producing or consuming network traffic (for agents only) by clicking the Export server details button:
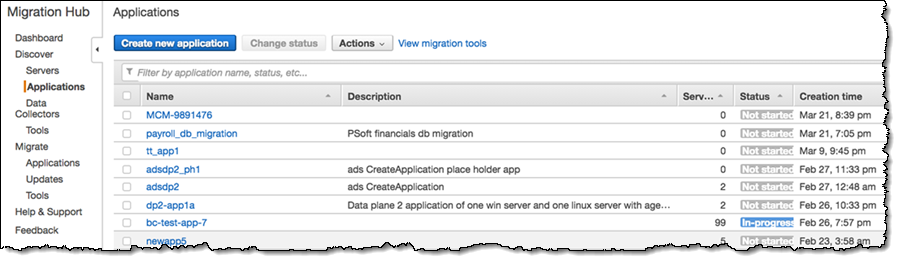
You can see a list of the applications (each one consisting of on one or more discovered servers) in the Discover->Applications section:
Export System Performance Data for all Servers
After starting the data collection, you can export a summary of the system performance data for all the servers discovered by agents and collectors from the AWS Command Line Interface (AWS CLI). Install and configure it, using us-west-2 for the default region and text for the default output format.
Begin by starting an export task:
List all of the tasks, find the one with the matching exportId, and capture the configurationsDownloadUrl (I have simplified it here for clarity, and also replaced my AWS account Id with xxxxxxxxxxxx):
Use the URL to download a ZIP file that contains system performance data for all of the discovered servers:
Data Exploration in Athena
You can also use the AWS Discovery Utilities scripts to download the system performance data and transform it for use in Amazon Athena, using an S3 bucket for storage. The utilities package includes the following scripts:
export.py – Perform a bulk, CSV-format export of all servers discovered by agents.
convert_csv.py – Convert the CSV files to Parquet format and upload them to an S3 bucket.
discovery_athena.ddl – Import the Parquet files to Athena (this script must be modified to reference the actual S3 bucket).
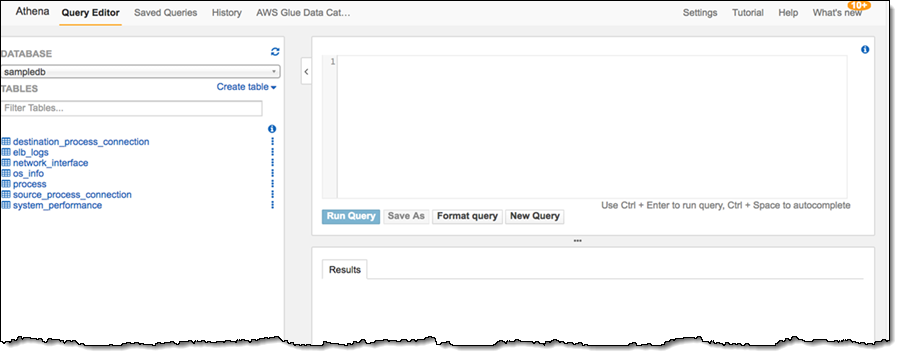
After you have run all of the scripts you can query the data in the Athena console using SQL commands.
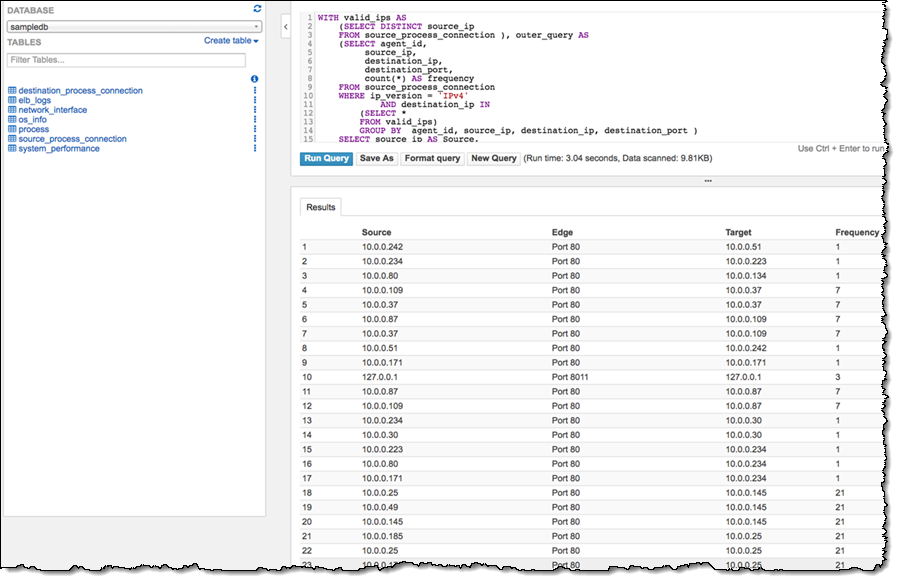
Here’s a query that identifies network communication between servers on a per-port basis:
Here’s the result:
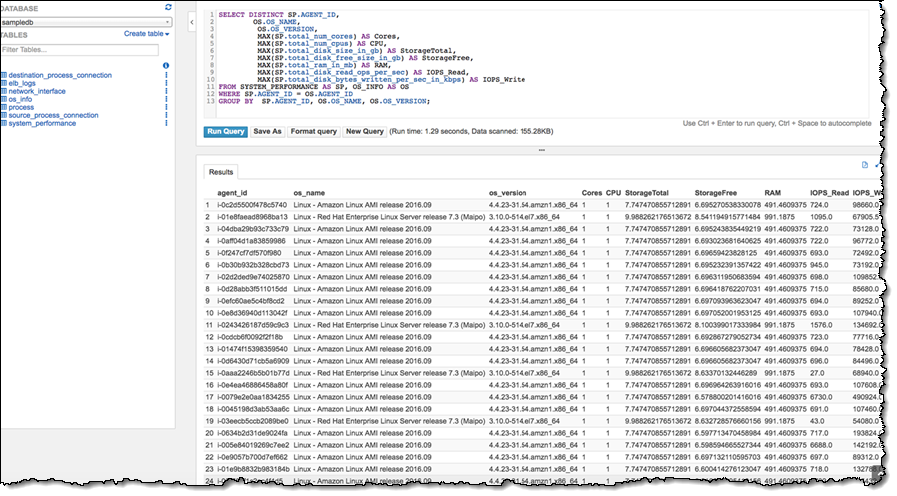
Here’s a query that identifies system performance data for cost analysis:
With this information at hand, you will be ready to plan and execute your migration to the AWS Cloud! To learn more, read the Application Discovery Service User Guide.
— Jeff;
PS – Our Application Discovery Service Partners would love to help you with your cloud migration.
PPS – I edited this post on April 24, 2018 to address some changes to the service.