AWS News Blog
New Metrics for EC2 Container Service: Clusters & Services
 The Amazon EC2 Container Service helps you to build, run, and scale Docker-based applications. As I noted in an earlier post (EC2 Container Service – Latest Features, Customer Successes, and More), you will benefit from easy cluster management, high performance, flexible scheduling, extensibility, portability, and AWS integration while running in an AWS-powered environment that is secure and efficient.
Container-based applications are built from tasks. A task is one or more Docker containers that run together on the same EC2 instance; instances are grouped in to a cluster. The instances form a pool of resources that can be used to run tasks.
This model creates some new measuring and monitoring challenges. In order to keep the cluster at an appropriate size (not too big and not too small), you need to watch memory and CPU utilization for the entire cluster rather than for individual instances. This becomes even more challenging when a single cluster contains EC2 instances with varied amounts of compute power and memory.
New Cluster Metrics
In order to allow you to properly measure, monitor, and scale your clusters, we are introducing new metrics that are collected from individual instances, normalized based on the instance size and the container configuration, and then reported to Amazon CloudWatch. You can observe the metrics in the AWS Management Console and you can use them to drive Auto Scaling activities.
The ECS Container Agent runs on each of the instances. It collects the CPU and memory metrics at the instance and task level, and sends them to a telemetry service for normalization. The normalization process creates blended metrics that represent CPU and memory usage for the entire cluster. These metrics give you a picture of overall cluster utilization.
Let’s take a look! My cluster is named default and it has one t2.medium instance:
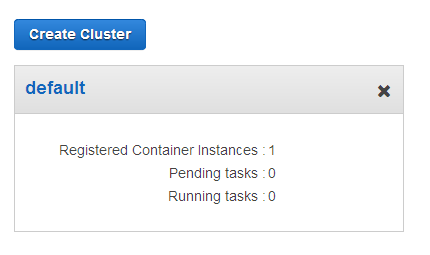
At this point no tasks are running and the cluster is idle:
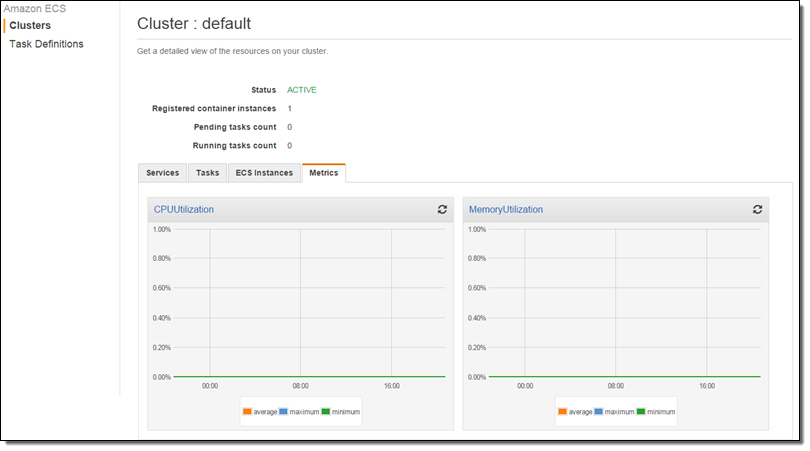
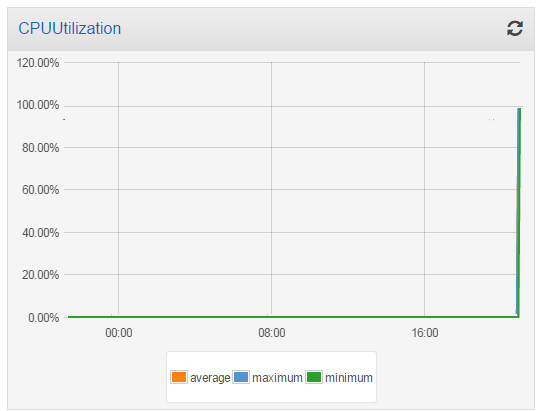
I ran two tasks (as a service) with the expectation that they will consume all of the CPU:
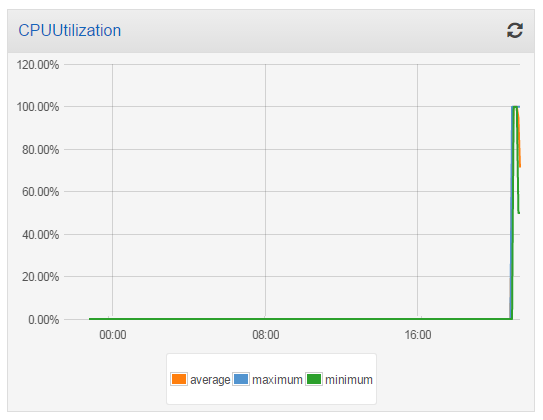
I took a short break to water my garden while the task burned some CPU and the metrics accumulated! I came back and here’s what the CPU Utilization looked like:
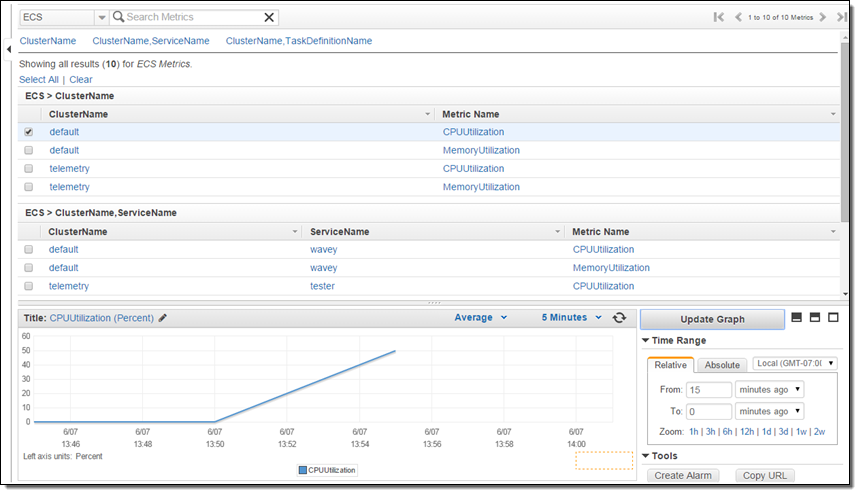
Then I launched another t2.medium instance into my cluster, and checked the utilization again. The additional processing power reduced the overall utilization to 50%:
The new metrics (CPUUtilization and MemoryUtilization) are available via CloudWatch and can also be used to create alarms. Here’s how to find them:
New Service Metrics
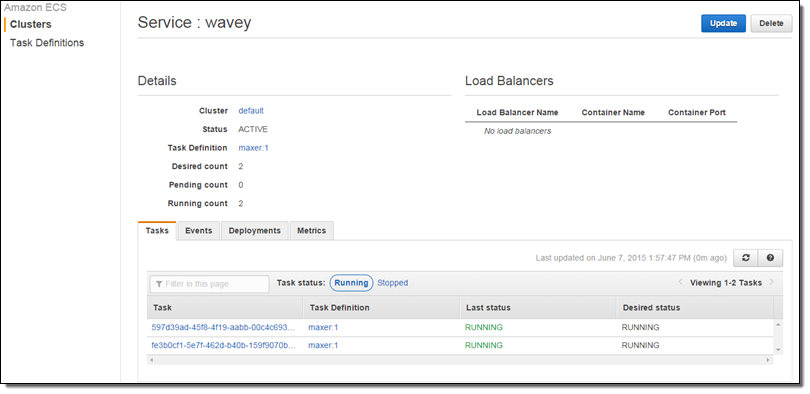
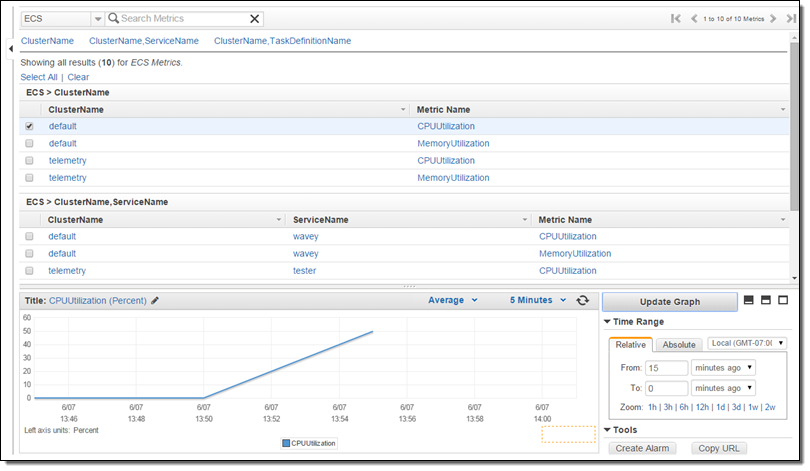
Earlier this year we announced that the EC2 Container Service supports long-running applications and load balancing. The Service scheduler allows you to manage long-running applications and services by keeping them healthy and scaled to the desired level. CPU and memory utilization metrics are now collected and processed on a per-service basis, and are visible in the Console:
The new cluster and server metrics are available now and you can start using them today!
— Jeff;